. 2023 Feb;107(4):1405-1420.
doi: 10.1007/s00253-022-12321-2. Epub 2023 Jan 17.

Role of ST6GAL1 and ST6GAL2 in subversion of cellular signaling during enteroaggregative Escherichia coli infection of human intestinal epithelial cell lines

Affiliations

Role of ST6GAL1 and ST6GAL2 in subversion of cellular signaling during enteroaggregative Escherichia coli infection of human intestinal epithelial cell lines

Shipra Chandel et al. Appl Microbiol Biotechnol. 2023 Feb.

Abstract

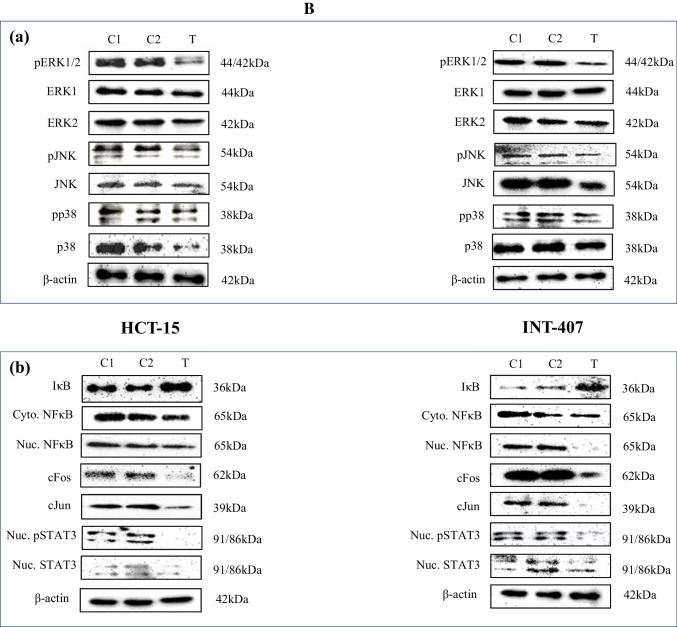
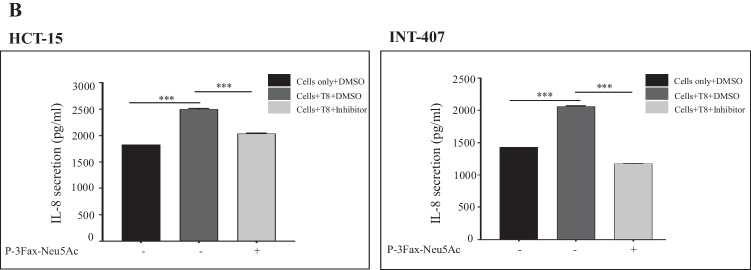
Emerging evidence have suggested that aberrant sialylation on cell-surface carbohydrate architecture may influence host-pathogen interactions. The α2,6-sialyltransferase (ST) enzymes were found to alter the glycosylation pattern of the pathogen-infected host cell-surface proteins, which could facilitate its invasion. In this study, we assessed the role of specific α2,6-ST enzymes in the regulation of enteroaggregative E. coli (EAEC)-induced cell signaling pathways in human intestinal epithelial cells. EAEC-induced expression of α2,6-ST family genes in HCT-15 and INT-407 cell lines was assessed at mRNA level by qRT-PCR. Specific esi-RNA was used to silence the target ST-gene in each of the EAEC-infected cell type. Subsequently, the role of these enzymes in regulation of EAEC-induced cell signaling pathways was unraveled by analyzing the expression of MAPkinases (ERK1/2, p38, JNK) and transcription factors (NFκB, cJun, cFos, STAT) at mRNA and protein levels by qRT-PCR and western immunoblotting, respectively, expression of selected sialoglycoproteins by western immunoblotting along with the secretory IL-8 response using sandwich ELISA. ST6GAL-1 and ST6GAL-2 were efficiently silenced in EAEC-infected HCT-15 and INT-407 cells, respectively. Significant reduction in EAEC-induced activation of MAPKs, transcription factors, sialoglycoproteins, and IL-8 secretion was noted in ST-silenced cells in comparison to the respective control cells. We propose that ST6GAL-1 and ST6GAL-2 are quintessential for EAEC-induced stimulation of MAPK-mediated pathways, resulting in activation of transcription factors, leading to an inflammatory response in the human intestinal epithelial cells. Our study may be helpful to design better therapeutic strategies to control EAEC- infection. KEY POINTS: • EAEC induces α2,6-sialyltransferase (ST) upregulation in intestinal epithelial cells • Target STs (ST6GAL-1 & ST6GAL-2) were efficiently silenced using specific esiRNAs • Expression of MAPKs, transcription factors & IL-8 was reduced in ST silenced cells.

Keywords: Enteroaggregative Escherichia coli; IL-8 secretion; P-3Fax-Neu5Ac; Sialyltransferases; Silencing; qRT-PCR.


Conflict of interest statement

The authors declare no competing interests.

Figures

Fig. 1
Fig. 1
Relative expression profile of ST6-family genes at mRNA level in both cell lines infected with and without EAEC. One-way ANOVA, followed by Tukey’s multiple comparison test, was applied; ***p < 0.001, **p < 0.01, and *p < 0.05 [EAEC-T8, EAEC-pT8, and EAEC-O42 vs. uninfected (UI) cells]; ns, non-significant
Fig. 2
Fig. 2
Relative expression profile of EAEC-T8–induced target sialyltransferases at mRNA level in both cell lines infected with and without EAEC. The bar diagrams show the expression fold of a ST6GAL-1 and b ST6GAL-2 at mRNA level in ST6GAL-1 and ST6GAL-2–silenced respective cell type as compared to the negative control (EAEC-T8–infected cells transfected with esi-FLUC RNA) and experimental control (EAEC-T8–infected cells treated with only lipofectamine); one-way ANOVA, followed by Tukey’s multiple comparison test, was used; ***p < 0.001 (ST6GAL-1 and ST6GAL-2–silenced cells vs. experimental control); ns, non-significant (negative control vs. experimental control)
Fig. 3
Fig. 3
A Relative expression profile of cell signaling molecules at mRNA level in EAEC-T8–infected target ST-silenced respective cell types. The bar diagrams indicate EAEC-T8–induced expression of ERK1, ERK2, JNK, p38, NFκB, cJun, cFos, STAT3, and IL-8 in ST6GAL-1 and ST6GAL-2–silenced HCT-15 and INT-407 cells, respectively, as compared to respective negative control and experimental control. One-way ANOVA, followed by Tukey’s multiple comparison test, was used; ***p < 0.001, **p < 0.01, and *p < 0.05 indicate the level of significance; ns, non-significant. B Expression profile of cell signaling molecules at protein level in cells. Western blots showing the expression of a MAPKs [pERK1/2, ERK1, ERK2, pJNK, JNK, pp38, and p38] and b transcription factors [IκB, NF-κB (cytoplasmic), NF-κB (nuclear), cFos (nuclear), cJun (nuclear), pSTAT-3 (nuclear) and STAT-3 (nuclear)] in ST6GAL-1 and ST6GAL-2–silenced respective HCT-15 and INT-407 cell types as compared to the respective negative control and experimental control. In the case of MAPKs, the blots were probed with anti-pERK, anti-pJNK, and anti-pp38 as the primary antibodies followed by incubation with HRP-conjugated secondary antibody. The bands on the blots were then stripped off and reprobed with the antibody to total ERK2 and ERK1, JNK, and p38. For transcription factors, the blots were probed with NF-κB (cytoplasmic), NF-κB (nuclear), cFos, cJun, and pSTAT-3 (nuclear) as the primary antibodies followed by incubation with HRP-conjugated secondary antibody. The NF-κB (cytoplasmic) and pSTAT-3 (nuclear) bands on the blots were then stripped off and reprobed with the antibody to IκB and STAT-3. Normalization was done by using β-actin (internal control). C1, lipofectamine-treated; C2, esi-FLUC-RNA–transfected; T, esi-ST6GAL-1-RNA/esi-ST6GAL-2-RNA–transfected EAEC-T8–infected HCT-15 and INT-407 cells; Mr, protein markers. C Bar diagrams revealing the expression of a MAPKs and b transcription factors in EAEC-T8–infected ST6GAL-1 and ST6GAL-2–transfected respective cell line as evaluated by Scion analysis with ImageJ software. The intensity of the band of each parameter was normalized to that of β-actin as the internal control. Further, the level of expression of each activated MAPK was obtained by normalization of each value against the value of respective total MAPK. The expression of each molecule in lipofectamine-treated control cells (C1) was set to 1, with respect to which the expression of the respective molecule in esi-FLUC RNA–transfected cells (C2) and esi-ST6GAL-1-RNA and esi-ST6GAL-2-RNA–transfected cells (T) was calculated. D ELISA-based estimation of IL-8 secretion by EAEC-T8–infected target ST-silenced respective cell types as compared to that of response in control cells (lipofectamine-treated cells and esi-FLUC RNA–transfected cells). One-way ANOVA, followed by Tukey’s multiple comparison test, was applied which revealed a significant reduction in secretory IL-8 concentration in each of the ST-silenced cell line [ST6GAL-1–silenced HCT-15 cells, 1451.7 pg/ml; ST6GAL-2–silenced INT-407 cells, 1389.1 pg/ml] in comparison to the respective vehicle control [HCT-15, 2269.583 pg/ml; INT-407, 2230 pg/ml); ***p < 0.001 (esi-ST6GAL-1-RNA and esi-ST6GAL-2-RNA vs. the lipofectamine-treated cells); ns, non-significant (esi-FLUC-RNA vs. the lipofectamine-treated cells)
Fig. 3
Fig. 3
A Relative expression profile of cell signaling molecules at mRNA level in EAEC-T8–infected target ST-silenced respective cell types. The bar diagrams indicate EAEC-T8–induced expression of ERK1, ERK2, JNK, p38, NFκB, cJun, cFos, STAT3, and IL-8 in ST6GAL-1 and ST6GAL-2–silenced HCT-15 and INT-407 cells, respectively, as compared to respective negative control and experimental control. One-way ANOVA, followed by Tukey’s multiple comparison test, was used; ***p < 0.001, **p < 0.01, and *p < 0.05 indicate the level of significance; ns, non-significant. B Expression profile of cell signaling molecules at protein level in cells. Western blots showing the expression of a MAPKs [pERK1/2, ERK1, ERK2, pJNK, JNK, pp38, and p38] and b transcription factors [IκB, NF-κB (cytoplasmic), NF-κB (nuclear), cFos (nuclear), cJun (nuclear), pSTAT-3 (nuclear) and STAT-3 (nuclear)] in ST6GAL-1 and ST6GAL-2–silenced respective HCT-15 and INT-407 cell types as compared to the respective negative control and experimental control. In the case of MAPKs, the blots were probed with anti-pERK, anti-pJNK, and anti-pp38 as the primary antibodies followed by incubation with HRP-conjugated secondary antibody. The bands on the blots were then stripped off and reprobed with the antibody to total ERK2 and ERK1, JNK, and p38. For transcription factors, the blots were probed with NF-κB (cytoplasmic), NF-κB (nuclear), cFos, cJun, and pSTAT-3 (nuclear) as the primary antibodies followed by incubation with HRP-conjugated secondary antibody. The NF-κB (cytoplasmic) and pSTAT-3 (nuclear) bands on the blots were then stripped off and reprobed with the antibody to IκB and STAT-3. Normalization was done by using β-actin (internal control). C1, lipofectamine-treated; C2, esi-FLUC-RNA–transfected; T, esi-ST6GAL-1-RNA/esi-ST6GAL-2-RNA–transfected EAEC-T8–infected HCT-15 and INT-407 cells; Mr, protein markers. C Bar diagrams revealing the expression of a MAPKs and b transcription factors in EAEC-T8–infected ST6GAL-1 and ST6GAL-2–transfected respective cell line as evaluated by Scion analysis with ImageJ software. The intensity of the band of each parameter was normalized to that of β-actin as the internal control. Further, the level of expression of each activated MAPK was obtained by normalization of each value against the value of respective total MAPK. The expression of each molecule in lipofectamine-treated control cells (C1) was set to 1, with respect to which the expression of the respective molecule in esi-FLUC RNA–transfected cells (C2) and esi-ST6GAL-1-RNA and esi-ST6GAL-2-RNA–transfected cells (T) was calculated. D ELISA-based estimation of IL-8 secretion by EAEC-T8–infected target ST-silenced respective cell types as compared to that of response in control cells (lipofectamine-treated cells and esi-FLUC RNA–transfected cells). One-way ANOVA, followed by Tukey’s multiple comparison test, was applied which revealed a significant reduction in secretory IL-8 concentration in each of the ST-silenced cell line [ST6GAL-1–silenced HCT-15 cells, 1451.7 pg/ml; ST6GAL-2–silenced INT-407 cells, 1389.1 pg/ml] in comparison to the respective vehicle control [HCT-15, 2269.583 pg/ml; INT-407, 2230 pg/ml); ***p < 0.001 (esi-ST6GAL-1-RNA and esi-ST6GAL-2-RNA vs. the lipofectamine-treated cells); ns, non-significant (esi-FLUC-RNA vs. the lipofectamine-treated cells)
Fig. 4
Fig. 4
A Expression profile of IL-8 at mRNA level and B ELISA-based estimation of IL-8 secretion in the case of both cell lines infected with and without EAEC-T8 in the presence of sialyltransferase inhibitor (P-3Fax-Neu5Ac). Reduced levels of secretory IL-8 in both inhibitor-treated EAEC-T8–infected cell lines (HCT-15, 2041.7 pg/ml; INT-407, 1177.7 pg/ml) in comparison to the respective infected cells (HCT-15, 2501.4 pg/ml; INT-407, 2063.7 pg/ml) in the absence of inhibitor. One-way ANOVA, followed by Tukey’s multiple comparison test, was used; ***p < 0.001 indicates the level of significance
Fig. 4
Fig. 4
A Expression profile of IL-8 at mRNA level and B ELISA-based estimation of IL-8 secretion in the case of both cell lines infected with and without EAEC-T8 in the presence of sialyltransferase inhibitor (P-3Fax-Neu5Ac). Reduced levels of secretory IL-8 in both inhibitor-treated EAEC-T8–infected cell lines (HCT-15, 2041.7 pg/ml; INT-407, 1177.7 pg/ml) in comparison to the respective infected cells (HCT-15, 2501.4 pg/ml; INT-407, 2063.7 pg/ml) in the absence of inhibitor. One-way ANOVA, followed by Tukey’s multiple comparison test, was used; ***p < 0.001 indicates the level of significance
Fig. 5
Fig. 5
A Expression profile of Prohibitin-2 and VDAC-2 at protein level in EAEC-T8–infected ST6GAL-1 and ST6GAL-2–silenced respective cell types. The blots were probed with the antibodies against Prohibitin-2 and VDAC-2 separately followed by incubation with HRP-conjugated secondary antibody. Normalization was done by using β-actin as the internal control. C1, lipofectamine-treated; C2, esi-FLUC RNA–transfected; T, esi-ST6GAL-1-RNA/esi-ST6- GAL-2-RNA–transfected EAEC-T8–infected HCT-15 and INT-407 cells; Mr, protein markers. Corresponding bar diagrams indicate the percentage decrease in the expression of Prohibitin-2 and VDAC-2 in ST6GAL-1 and ST6GAL-2–silenced respective cell lines [(HCT-15: PHB2, 56.36%; VDAC2, 82.30%); (INT-407 cells: PHB2, 29.33%; VDAC2, 81.47%)] as obtained by ImageJ analysis of western blots in comparison to control cells (lipofectamine-treated cells and esi-FLUC RNA–transfected cells). One-way ANOVA, followed by Tukey’s multiple comparison test, was applied; ***p < 0.001 (esi-ST6GAL-1-RNA and esi-ST6GAL-2-RNA vs. the lipofectamine-treated cells); ns, non-significant (esi-FLUC-RNA vs. the lipofectamine-treated cells)
Fig. 6
Fig. 6
Aggregative adherence of EAEC-T8 to A HCT-15 and B INT-407 cells transfected with esi-ST6GAL-1-RNA and esi-ST6-GAL-2-RNA as assessed by Giemsa staining. C and D depict the aggregative adherence of EAEC-T8 to silenced HCT-15 and INT-407 cells as shown by bar diagrams in view of CFU. **p < 0.01 (iii vs. i in the case of HCT-15); ***p < 0.001 (iii vs. i in the case of INT-407) and non-significant (ii vs. i). One-way ANOVA followed by Tukey’s multiple comparison test in comparison to lipofectamine-treated cells, was applied. Each bar represents the mean ± S.D. of three independent experiments. (iii) Cells transfected with esi-ST6GAL-1-RNA and esi-ST6GAL-2-RNA, (ii) cells transfected with esi-FLUC-RNA, and (i) cells treated with lipofectamine

Similar articles

Cited by

References

    1. Alto NM, Orth K. Subversion of cell signaling by pathogens. Cold Spring Harb Perspect Biol. 2012;4(9):a006114. doi: 10.1101/cshperspect.a006114. - DOI - PMC - PubMed
    1. Anthony RM, Nimmerjahn F, Ashline DJ, Reinhold VN, Paulson JC, Ravetch JV. A recombinant IgG Fc that recapitulates the anti-inflammatory activity of IVIG. Science. 2008;320(5874):373. doi: 10.1126/science.1154315. - DOI - PMC - PubMed
    1. Bahia D, Satoskar AR, Dussurget O. Editorial: cell signaling in host-pathogen interactions: the host point of view. Front Immunol. 2018;9:221. doi: 10.3389/fimmu.2018.00221. - DOI - PMC - PubMed
    1. Britain CM, Dorsett KA, Bellis SL. The glycosyltransferase ST6Gal-I protects tumor cells against serum growth factor withdrawal by enhancing survival signaling and proliferative potential. J Biol Chem. 2017;292(11):4663–4673. doi: 10.1074/jbc.M116.763862. - DOI - PMC - PubMed
    1. Caballero I, Ringot-Destrez B, Si-Tahar M, Barbry P, Guillon A, Lantier I, Berri M, Chevaleyre C, Fleurot I, Barc C, Ramphal R, Pons N, Paquet A, Lebrigand K, Baron C, Bähr A, Klymiuk N, Léonard R, Robbe-Masselot C. Evidence of early increased sialylation of airway mucins and defective mucociliary clearance in CFTR-deficient piglets. J Cyst Fibros. 2021;20(1):173–182. doi: 10.1016/j.jcf.2020.09.009. - DOI - PubMed