. 2023 Apr 11;115(4):456-467.
doi: 10.1093/jnci/djad008.

Metabolically (un)healthy obesity and risk of obesity-related cancers: a pooled study

Affiliations

Metabolically (un)healthy obesity and risk of obesity-related cancers: a pooled study

Ming Sun et al. J Natl Cancer Inst. .

Abstract

Background: Studies of obesity with or without metabolic aberrations, commonly termed metabolically unhealthy or healthy obesity, in relation to cancer risk are scarce.

Methods: We investigated body mass index (normal weight, overweight, obesity) jointly and in interaction with metabolic health status in relation to obesity-related cancer risk (n = 23 630) among 797 193 European individuals. A metabolic score comprising mid-blood pressure, plasma glucose, and triglycerides was used to define metabolically healthy and unhealthy status. Hazard ratios (HRs) and multiplicative interactions were assessed using Cox regression, and additive interactions were assessed using the relative excess risk for interaction. All statistical tests were 2-sided.

Results: Metabolically unhealthy obesity, with a baseline prevalence of 7%, was, compared with metabolically healthy normal weight, associated with an increased relative risk of any obesity-related cancer and of colon, rectal, pancreas, endometrial, liver, gallbladder, and renal cell cancer (P < .05), with the highest risk estimates for endometrial, liver, and renal cell cancer (HR = 2.55-3.00). Metabolically healthy obesity showed a higher relative risk for any obesity-related cancer and colon (in men), endometrial, renal cell, liver, and gallbladder cancer, though the risk relationships were weaker. There were no multiplicative interactions, but there were additive, positive interactions between body mass index and metabolic health status on obesity-related and rectal cancer among men and on endometrial cancer (P < .05).

Conclusions: This study highlights that the type of metabolic obesity phenotype is important when assessing obesity-related cancer risk. In general, metabolic aberrations further increased the obesity-induced cancer risk, suggesting that obesity and metabolic aberrations are useful targets for prevention.


Figures

Figure 1.
Figure 1.
Hazard ratios (95% confidence interval) of obesity-related cancers for specific sites in 797 193 women and men according to combinations of metabolic health status and body mass index. Other obesity-related cancers include esophageal adenocarcinoma and stomach-cardia cancer. Hazard ratios were calculated by use of Cox regression using age as timescale, adjusted for sex, baseline age, and smoking status and pack-years and stratified by cohort and date of birth. Normal weight: 18.5≤BMI < 25 kg/m2; overweight: 25≤BMI < 30 kg/m2; obese: BMI ≥ 30 kg/m2; metabolically healthy: middle and lowest tertile of metabolic score; metabolically unhealthy: top tertile of metabolic score. Metabolic score composes equal weight from mid-blood pressure, glucose, and triglycerides. BMI = body mass index; CI = confidence interval; HR = hazard ratio; Met. = metabolically.
Figure 2.
Figure 2.
Hazard ratios (95% confidence interval) of all obesity-related cancers and common cancer forms in 397 082 women according to combinations of metabolic health status and body mass index. Hazard ratios were calculated by use of Cox regression using age as timescale, adjusted for sex, baseline age, and smoking status and pack-years and stratified by cohort and date of birth. Normal weight: 18.5≤ BMI < 25 kg/m2; overweight: 25≤BMI < 30 kg/m2; obese: BMI ≥ 30 kg/m2; metabolically healthy: middle and lowest tertile of metabolic score; metabolically unhealthy: top tertile of metabolic score. Metabolic score composes equal weight from mid-blood pressure, glucose, and triglycerides. BMI = body mass index; CI = confidence interval; HR = hazard ratio; Met. = metabolically.
Figure 3.
Figure 3.
Hazard ratios (95% confidence interval) of all obesity-related cancers and common cancer forms in 400 111 men according to combinations of metabolic health status and body mass index. Hazard ratios were calculated by use of Cox regression using age as timescale, adjusted for sex, baseline age, and smoking status and pack-years and stratified by cohort and date of birth. Normal weight: 18.5≤BMI < 25 kg/m2; overweight: 25≤BMI < 30 kg/m2; obese: BMI ≥ 30 kg/m2; metabolically healthy: middle and lowest tertile of metabolic score; metabolically unhealthy: top tertile of metabolic score. Metabolic score composes equal weight from mid-blood pressure, glucose, and triglycerides. BMI = body mass index; CI = confidence interval; HR = hazard ratio; Met. = metabolically.
Figure 4.
Figure 4.
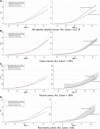
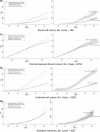
Risk of all obesity-related cancers (A), colon cancer (B), rectal cancer (C), pancreatic cancer (D), renal cell cancer (E), postmenopausal breast cancer (F), endometrial cancer (G), and multiple myeloma (H) among 397 082 women according to combinations of metabolic health status and body mass index. Cumulative risks were calculated using age as time metric and death as competing event. Shaded areas are 95% confidence bands. Absolute risks at age 80 years were calculated using the same model. Normal weight: 18.5≤BMI < 25 kg/m2; obese: BMI ≥ 30 kg/m2; metabolically healthy: middle and lowest tertile of metabolic score; metabolically unhealthy: top tertile of metabolic score. Metabolic score composes equal weight from mid-blood pressure, glucose, and triglycerides. BMI = body mass index.
Figure 4.
Figure 4.
Continued.
Figure 5.
Figure 5.
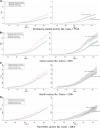
Risk of all obesity-related cancers (A), colon cancer (B), rectal cancer (C), pancreatic cancer (D), renal cell cancer (E), and multiple myeloma (F), among 400 111 men according to combinations of metabolic health status and body mass index. Cumulative risks were calculated using age as time metric and death as competing event. Shaded areas are 95% confidence bands. Absolute risks at age 80 years were calculated using the same model. Normal weight: 18.5≤BMI < 25 kg/m2; obese: BMI ≥ 30 kg/m2; metabolically healthy: middle and lowest tertile of metabolic score; metabolically unhealthy: top tertile of metabolic score. Metabolic score composes equal weight from mid-blood pressure, glucose, and triglycerides. BMI = body mass index.
Figure 5.
Figure 5.
Continued.

References

    1. Kyrgiou M, Kalliala I, Markozannes G, et al.Adiposity and cancer at major anatomical sites: umbrella review of the literature. BMJ . 2017;356:j477. - PMC - PubMed
    1. Lauby-Secretan B, Scoccianti C, Loomis D, et al.Body fatness and cancer–viewpoint of the IARC working group. New Engl J Med. 2016;375(8):794-798. - PMC - PubMed
    1. Stone TW, McPherson M, Gail Darlington L.. Obesity and cancer: existing and new hypotheses for a causal connection. EBioMedicine. 2018;30:14-28. - PMC - PubMed
    1. Arcidiacono B, Iiritano S, Nocera A, et al.Insulin resistance and cancer risk: an overview of the pathogenetic mechanisms. Exp Diabetes Res. 2012;2012:789174. - PMC - PubMed
    1. Esposito K, Chiodini P, Colao A, et al.Metabolic syndrome and risk of cancer: a systematic review and meta-analysis. Diabetes Care. 2012;35(11):2402-2411. - PMC - PubMed

Publication types