. 2023 Jan;13(1):e1176.
doi: 10.1002/ctm2.1176.

Basal cell adhesion molecule promotes metastasis-associated processes in ovarian cancer

Affiliations

Basal cell adhesion molecule promotes metastasis-associated processes in ovarian cancer

Suresh Sivakumar et al. Clin Transl Med. 2023 Jan.

Abstract

Background: Basal cell adhesion molecule (BCAM) is a laminin α5 (LAMA5) binding membrane-bound protein with a putative role in cancer. Besides full-length BCAM1, an isoform lacking most of the cytoplasmic domain (BCAM2), and a soluble form (sBCAM) of unknown function are known. In ovarian carcinoma (OC), all BCAM forms are abundant and associated with poor survival, yet BCAM's contribution to peritoneal metastatic spread remains enigmatic.

Methods: Biochemical, omics-based and real-time cell assays were employed to identify the source of sBCAM and metastasis-related functions of different BCAM forms. OC cells, explanted omentum and a mouse model of peritoneal colonisation were used in loss- and gain-of-function experiments.

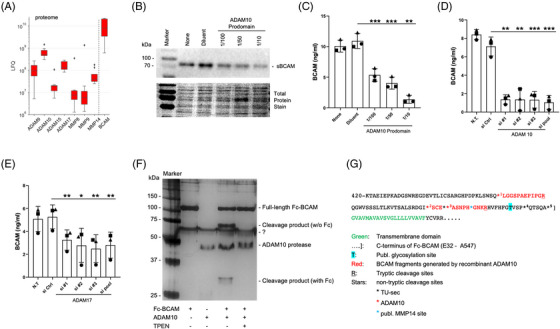
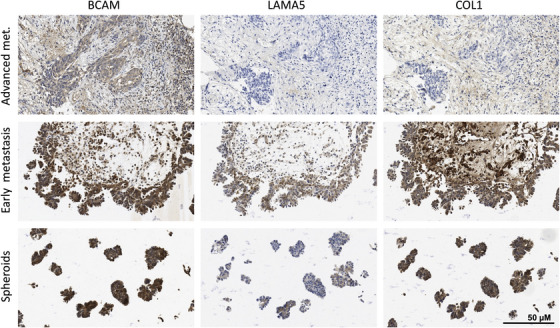
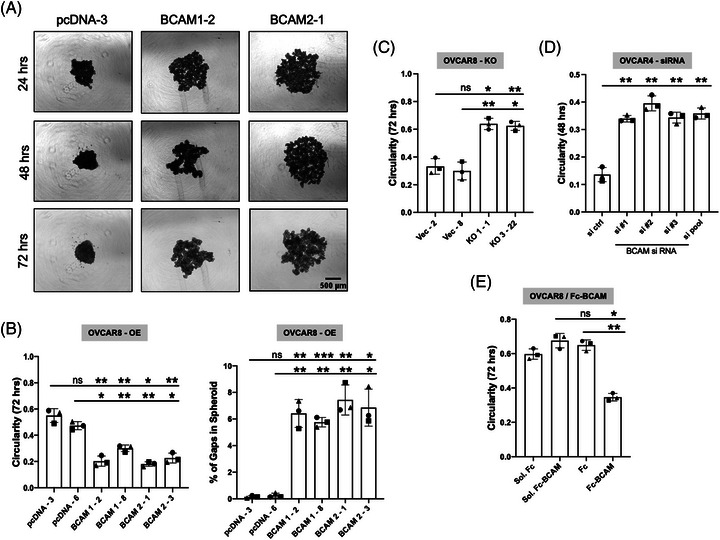
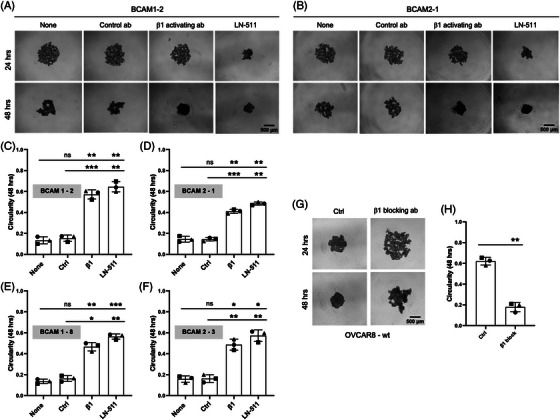
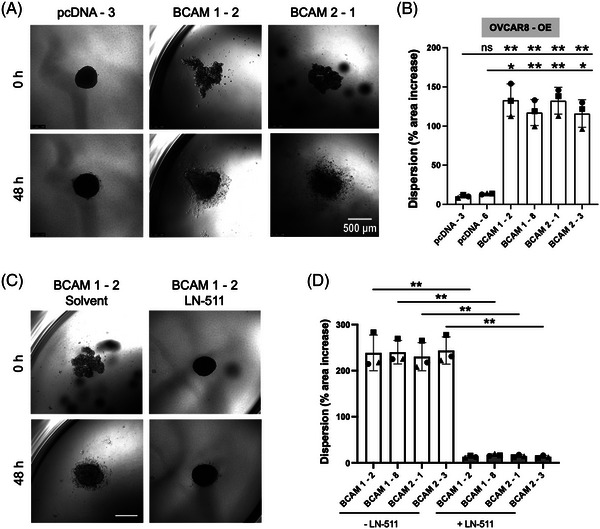
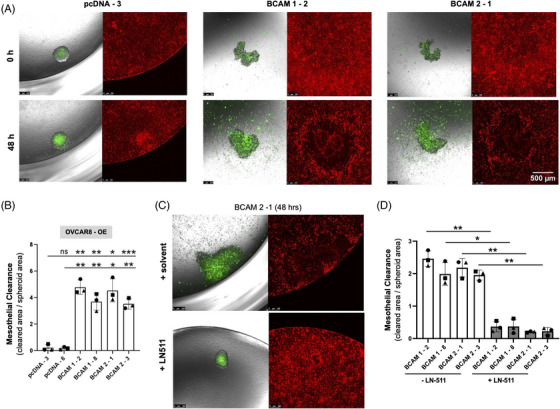
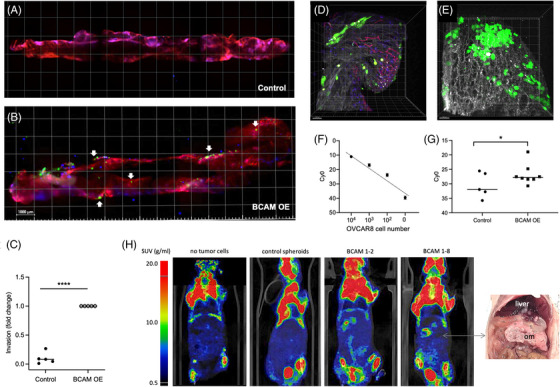
Results: We identified ADAM10 as a major BCAM sheddase produced by OC cells and identified proteolytic cleavage sites proximal to the transmembrane domain. Recombinant soluble BCAM inhibited single-cell adhesion and migration identically to membrane-bound isoforms, confirming its biological activity in OC. Intriguingly, this seemingly anti-tumorigenic potential of BCAM contrasts with a novel pro-metastatic function discovered in the present study. Thus, all queried BCAM forms decreased the compactness of tumour cell spheroids by inhibiting LAMA5 - integrin β1 interactions, promoted spheroid dispersion in a three-dimensional collagen matrix, induced clearance of mesothelial cells at spheroid attachment sites in vitro and enhanced invasion of spheroids into omental tissue both ex vivo and in vivo.

Conclusions: Membrane-bound BCAM as well as sBCAM shed by ADAM10 act as decoys rather than signalling receptors to modulate metastasis-related functions. While BCAM appears to have tumour-suppressive effects on single cells, it promotes the dispersion of OC cell spheroids by regulating LAMA5-integrin-β1-dependent compaction and thereby facilitating invasion of metastatic target sites. As peritoneal dissemination is majorly mediated by spheroids, these findings offer an explanation for the association of BCAM with a poor clinical outcome of OC, suggesting novel therapeutic options.

Keywords: ADAM10; BCAM; ovarian cancer; spheroids.


Conflict of interest statement

The authors declare no competing financial interests.

Figures

FIGURE 1
FIGURE 1
Analysis of BCAM in OC ascites and comparative functional analysis of membrane‐bound and soluble BCAM. (A) Immunoblot of BCAM in eight different cell‐free ascites samples. For comparison, conditioned medium (containing sBCAM) and lysate from OVCAR4 cell was included (right‐most lanes). Quantitation of relative signal intensities as well as BCAM levels in ascites samples measured by ELISA are shown at the bottom. The band labelled with ‘?’ denotes an unspecific background band. The bottom panel shows the membrane after staining with the Pierce Reversible Total Protein Stain Kit as loading control. (B) Concentration of BCAM protein in the ascites from n = 70 high‐grade serous OC patients determined by ELISA. (C) Kaplan–Meier plot analysing the relapse‐free survival (RFS) of n = 65 evaluable patients analysed in panel B. Groups were split at the q = 0.7 quantile (best‐fit); p: logrank p value; HR: median hazard ratio; rfs: months to 50% RFS for patients with high/low BCAM levels. (D) Effect of BCAM on OC cell adhesion to LN‐511 on non‐adhesive microplates coated with LN‐511. Cell adhesion was quantified by RTCA. Left: BCAM‐overexpressing OVCAR8 cells (OVCAR8‐OE). Clones stably transfected with BCAM1 or BCAM2 (Figure S4) were compared with cells transduced with the empty expression vector (pcDNA‐6). Right: Adhesion of OVCAR8 cells was analysed in the presence of Fc‐BCAM or negative control (Fc) at equimolar concentration (1 μg/ml of Fc‐BCAM; 0.33 μg/ml of Fc). (s): solvent for Fc or Fc‐BCAM. (E) Effect of BCAM on two‐dimensional OC cell migration under the same conditions as in panel D, except that a further control clone (pcDNA3) was included. Transwell‐chamber microplates were coated with LN‐511 and cell migration was quantified by RTCA. The data in D and E are based on n = 3 biological replicates. *p < .05; **p < .01; ***p < .001; ns, not significant by unpaired t test.
FIGURE 2
FIGURE 2
Role of ADAM10 in the generation of sBCAM and identification of cleavage sites. (A) Distribution of BCAM and metalloproteinase expression in tumour cells from n = 9 OC patients, based on a previously published dataset obtained by MS‐based proteomic analysis. Signal intensities reflect LFQ values. Boxplots show medians (line), upper and lower quartiles (box), ranges (whiskers) and outliers (diamonds). (B) Immunoblot of medium from OVCAR4 cells cultured in the presence of different concentrations of the ADAM10 prodomain (selective ADAM10 inhibitor) for 24 h. The panel below the immunoblot show the respective membranes stained with the Pierce Reversible Total Protein Stain Kit. (C) ELISA‐based quantification of sBCAM secretion by OVCAR4 cells treated as in panel B. (D) Analysis of BCAM release by OVCAR4 cells treated with three different siRNAs targeting ADAM10 (s1#1, si#2, si#3), a pool of all three siRNAs (si pool) or negative control siRNA (si Ctrl). The leftmost bar represents non‐transfected cells (NT). Cell culture media were analysed by ELISA as in panel C. (E) Analysis of OVCAR4 cells as in panel D but treated with ADAM17‐targeting siRNAs. *p < .05; **p < .01; ***p < .001 by unpaired t‐test. (F) Silver‐stained PAGE gel of recombinant Fc‐BCAM after digestion with recombinant ADAM10 and in the absence or presence of the zinc chelator TPEN. ‘?’ denotes an unspecific background band. (G) Schematic representation of the C‐terminal amino acid sequence of BCAM, including the ADAM10 cleavage sites in recombinant BCAM identified in panel F (Table S3), the cleavage sites found in the secretome of tumour cells from OC ascites (TU‐sec; Table S4) and the previously published MMP14 cleavage site.
FIGURE 3
FIGURE 3
Immunohistochemical analysis of BCAM, LAMA5 and COL1 in matched samples of OC metastases and spheroids from ascites. Paraffin sections from metastases at different stages (early metastases: tumour cells still near the surface; advanced metastases: deeply invading larger tumour masses) and spheroids from ascites were stained by immunohistochemistry as described in Materials and Methods. A quantification of the images is shown in Table 2 (patient OC114). Further examples are depicted in Figure S13 and quantified in Table 2. Scale bar: 50 μm
FIGURE 4
FIGURE 4
Impact of BCAM on OC cell spheroid formation. (A) Morphology of spheroids derived from BCAM‐overexpressing OVCAR8 clones (BCAM1‐2, BCAM2‐1) compared with cells transduced with the empty pcDNA‐3 vector (representative examples). Scale bar: 500 μm. (B) Circularity of spheroids and percentage of gaps in spheroids as in panel A. The plot shows quantifications for two different clones in each case. (C) OVCAR8 cells with disrupted BCAM (OVCAR8‐KO) compared with cells transduced with the empty vector (clones Vec‐2, Vec‐8). The plot shows circularities for two different clones in each case. (D) OVCAR4 cells transfected with control‐siRNA (si ctrl), three different BCAM‐siRNAs (#1, #2, #3) or pooled siRNAs (pool). (E) Spheroids from OVCAR8 cells formed in the presence of Fc‐BCAM or Fc control at equimolar concentration (1 μg/ml of Fc‐BCAM; 0.33 μg/ml of Fc). Sol: solvent for Fc or Fc‐BCAM. Each plot is based on n = 3 biological replicates. *p < .05; **p < .01; ***p < .001; ns: not significant by unpaired t‐test
FIGURE 5
FIGURE 5
Role of LN‐511 and integrin β1 in BCAM‐regulated spheroid compaction. (A, B) Morphology of spheroids derived from BCAM‐overexpressing OVCAR8 clones (BCAM1 in panel A; BCAM‐2 in panel B) cultured in the presence of an integrin‐β1 activating antibody, a control antibody or exogenous LN‐511 (representative examples). None: untreated cells. Scale bar: 500 μm. (C, D) Quantification of circularity of spheroids in panels A and B (n = 3 biological replicates each). (E, F) Circularity of spheroids from two additional BCAM‐overexpressing clones (n = 3 replicates). (G) Morphology of spheroids derived from OVCAR8 cells in the presence of an integrin‐β1 blocking antibody or a control antibody (Ctrl). Scale bar: 500 μm. (H) Quantification of circularity of spheroids in panels G. Data are shown for n = 3 biological replicates in panels C–F and H. *p < .05; **p < .01; ***p < .001; ns: not significant by unpaired t‐test
FIGURE 6
FIGURE 6
Effect of BCAM on spheroid dispersion. (A) Spheroids of BCAM‐overexpressing OVCAR8 clones (BCAM1‐2, BCAM2‐1) and cells transduced with the empty vector (pcDNA‐3) were embedded in a 3D collagen matrix for 48 h. The photomicrographs show a clear dispersion only for the BCAM‐overexpressing cells. Scale bar: 500 μm. (B) Quantification of dispersion of spheroids in panel A plus one additional clone for each condition (n = 3 biological replicates each). *p < .05; **p < .01; ***p < .001; ns: not significant by unpaired t‐test. (C) Spheroids were generated from BCAM‐overexpressing BCAM1‐2 cells in the presence or absence of exogenous LN‐511 (10 μg/ml) as in panel A. Pictures were taken at times 0 and 48 h after embedding. (D) Quantification of dispersion of spheroids generated from four different BCAM‐overexpressing and four control clones in the presence or absence of exogenous LN‐511 as in panel C (n = 3 biological replicates each). **p < .01 by paired t‐test
FIGURE 7
FIGURE 7
Effect of BCAM on clearance of a mesothelial monolayer. (A) The same clones as in Figure 6 (labelled with Cell Tracker green) were plated on a confluent monolayer of omental mesothelial cells (Cell Tracker orange) and mesothelial cell clearance was observed after 48 h. Scale bar: 500 μm. (B) Quantification of mesothelial cell clearance by clones in panel A plus one additional clone for each condition (n = 3 biological replicates each). *p < .05; **p < .01; ***p < .001; ns: not significant by unpaired t‐test. (C) Spheroids were generated from BCAM‐overexpressing BCAM2‐1 cells in the presence or absence of exogenous LN‐511 (10 μg/ml) as in panel A and analysed after 48 h. (D) Quantification of mesothelial cell clearance by spheroids generated from four different BCAM‐overexpressing and four control clones in the presence or absence of exogenous LN‐511 as in panel C (n = 3 biological replicates each). *p < .05; **p < .01 by paired t‐test
FIGURE 8
FIGURE 8
Effect of BCAM on invasion of mouse omentum by tumour cell spheroids. (A, B) Representative light‐sheet microscopic images showing the invasion of explanted mouse omentum ex vivo by spheroids derived from control (A) and BCAM1‐overexpressing (B) OVCAR8 cells pre‐labelled with Cell Tracker Green. Spheroids derived from equal numbers of cells were added to freshly resected omentum and co‐cultured for 48 h. Thereafter, the omentum was stained for immune cells (CD45; blue) and microvessels (CD31; red) and observed by light‐sheet microscopy. Arrows point to areas of tumour cells that are not in the vicinity of milky spots (examples). These areas are characterised by the absence of CD45+ cell clusters (blue), which appear purple if co‐localising with CD31+ endothelial cells. Scale bar: 1000 μm. The sharp blue spots represent staining artefacts. (C) Quantification of the number of invaded cells analysed as in panels A and B for n = 5 biological replicates. ****p < .0001 by t test. (D, E) Multiphoton microscopy of tumour cells from BCAM‐overexpressing OVCAR8 spheroids pre‐labelled with Cell Tracker Green. Collagen fibres are visualised in white by second‐harmonic generation. Panel D shows the area below a milky spot, panel E an area distant from milky spots. Scale bar: 50 μM. (F) Validation of Taqman‐PCR for the quantification of tumour cell invasion into omentum. Genomic DNA from human OVCAR8 cells and mouse omentum (100 pg) were mixed at the indicated ratios and the signal for human DNA (hAlu sequences) was determined. The plot shows a linear relationship between signal intensity and the amount of human DNA. (G) Quantification by Taqman‐PCR of human DNA in omentum samples after incubation with spheroids generated from control and BCAM1‐overexpressing OVCAR8 cells as in panels A–E. The plot shows the data for n = 5–8 biological replicates as indicated by symbols. *p < .05; by t‐test. (H) Longitudinal 18F‐FDG PET/CT images of mice 28 days after i.p. injection of spheroids derived from OVCAR8 control cells and from two different clones of BCAM‐overexpressing OVCAR8 cells. Leftmost image: mouse not inoculated with tumour cells for comparison. The picture on the right shows large space‐occupying BCAM1‐8 tumour masses in the omentum (om) displacing the liver and other organs.

Similar articles

Cited by

References

    1. Rahuel C, Le Van Kim C, Mattei MG, Cartron JP, Colin Y. A unique gene encodes spliceoforms of the B‐cell adhesion molecule cell surface glycoprotein of epithelial cancer and of the Lutheran blood group glycoprotein. Blood. 1996;88:1865‐1872. - PubMed
    1. Nemer El, W R, Colin Y, et al. Organization of the human LU gene and molecular basis of the Lu(a)/Lu(b) blood group polymorphism. Blood. 1997;89:4608‐4616. - PubMed
    1. Gauthier E, Nemer El, Wautier MP, et al. Role of the interaction between Lu/BCAM and the spectrin‐based membrane skeleton in the increased adhesion of hereditary spherocytosis red cells to laminin. Br J Haematol. 2010;148:456‐465. - PubMed
    1. Kikkawa Y, Sudo R, Kon J, et al. Laminin alpha 5 mediates ectopic adhesion of hepatocellular carcinoma through integrins and/or Lutheran/basal cell adhesion molecule. Exp Cell Res. 2008;314:2579‐2590. - PubMed
    1. Kikkawa Y, Ogawa T, Sudo R, et al. The lutheran/basal cell adhesion molecule promotes tumor cell migration by modulating integrin‐mediated cell attachment to laminin‐511 protein. J Biol Chem. 2013;288:30990‐31001. - PMC - PubMed

Publication types

Substances