

Caspase-8-driven apoptotic and pyroptotic crosstalk causes cell death and IL-1β release in X-linked inhibitor of apoptosis (XIAP) deficiency
- PMID: 36647737
- PMCID: PMC9975961
- DOI: 10.15252/embj.2021110468
Caspase-8-driven apoptotic and pyroptotic crosstalk causes cell death and IL-1β release in X-linked inhibitor of apoptosis (XIAP) deficiency
Abstract
Genetic lesions in X-linked inhibitor of apoptosis (XIAP) pre-dispose humans to cell death-associated inflammatory diseases, although the underlying mechanisms remain unclear. Here, we report that two patients with XIAP deficiency-associated inflammatory bowel disease display increased inflammatory IL-1β maturation as well as cell death-associated caspase-8 and Gasdermin D (GSDMD) processing in diseased tissue, which is reduced upon patient treatment. Loss of XIAP leads to caspase-8-driven cell death and bioactive IL-1β release that is only abrogated by combined deletion of the apoptotic and pyroptotic cell death machinery. Namely, extrinsic apoptotic caspase-8 promotes pyroptotic GSDMD processing that kills macrophages lacking both inflammasome and apoptosis signalling components (caspase-1, -3, -7, -11 and BID), while caspase-8 can still cause cell death in the absence of both GSDMD and GSDME when caspase-3 and caspase-7 are present. Neither caspase-3 and caspase-7-mediated activation of the pannexin-1 channel, or GSDMD loss, prevented NLRP3 inflammasome assembly and consequent caspase-1 and IL-1β maturation downstream of XIAP inhibition and caspase-8 activation, even though the pannexin-1 channel was required for NLRP3 triggering upon mitochondrial apoptosis. These findings uncouple the mechanisms of cell death and NLRP3 activation resulting from extrinsic and intrinsic apoptosis signalling, reveal how XIAP loss can co-opt dual cell death programs, and uncover strategies for targeting the cell death and inflammatory pathways that result from XIAP deficiency.
Keywords: Gasdermin D; XIAP; caspase-8; inflammasome; pyroptosis.
© 2023 The Authors.
Figures
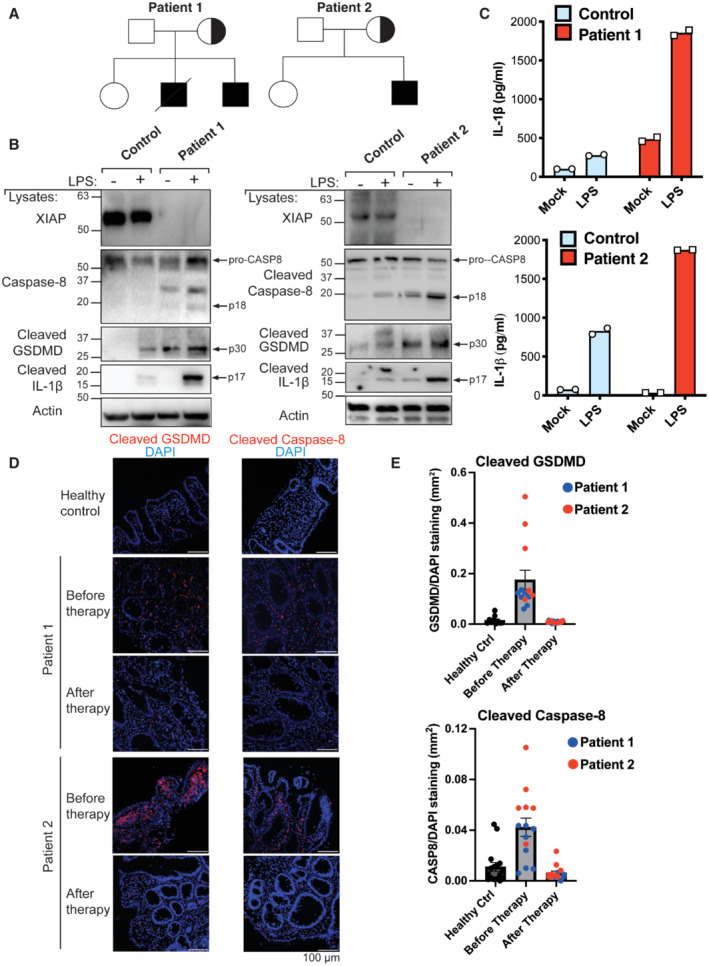
- A
Pedigrees of the XIAP‐deficient patients identified in this study.
- B, C
PBMCs were stimulated with LPS (500 ng/ml) and after 24 h cell lysates and supernatants analysed by western blot (B) and ELISA (C), respectively. The mean of experimental duplicates (symbols) is shown (C).
- D, E
Immunofluorescence staining showing activation of caspase‐8 and GSDMD in the colonic mucosae of XIAP‐deficient patients relative to healthy control colonic biopsies before and after early enteral nutrition (patient 1) or anti‐TNF and immune suppression (patient 2) therapies, with several images (symbols) quantified in panel E (mean ± SEM of caspase‐8 or GSDMD stained area relative to overall tissue staining (DAPI) analysed using ImageJ software. Caspase‐8 staining quantified from; n = 16 healthy control, n = 8 and 6 before therapy (patient 1 and 2, respectively) and n = 5 and 9 after therapy (patient 1 and 2, respectively) separate images. GSDMD staining quantified from; n = 10 healthy control, n = 7 and 6 before therapy (patient 1 and 2, respectively) and n = 8 and 8 after therapy (patient 1 and 2, respectively) separate images.
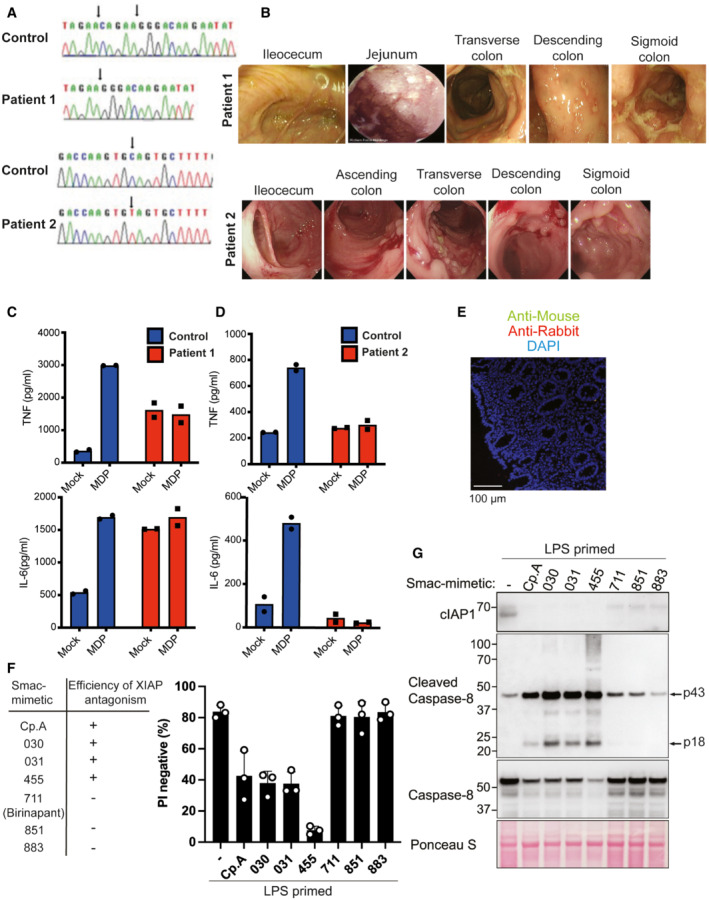
- A
Sanger‐sequencing confirming XIAP frameshift (T933del‐AGAAC) in patient 1 and a misssense mutation (c.595C>T:p.Q199X) in patient 2.
- B
Colonoscopy images of the XIAP‐deficient patients at diagnosis.
- C, D
ELISA analysis of IL‐6 and TNF in PBMC supernatants upon NOD2 ligand muramyl dipeptide (10 μg/ml) stimulation for 24 h. The mean of duplicate experiments is shown.
- E
Paraffin‐embedded sections of colonic biopsies were stained with secondary Alexa fluor anti‐rabbit 594 and or anti‐mouse 488.
- F, G
BMDMs were seeded at a density of 4 × 10⁵ cells per well, primed with 20 ng/ml of LPS for 6 h then treated, as indicated, with 500 nM of the indicated smac‐mimetic compounds for 20 h. Cell viability (F) was determined by PI staining and flow cytometry and measured as a proportion of PI‐negative (live) cells. Data represent the mean of three independent experiments (symbols). Error bars are the mean ± SD. Alternatively, cell lysates were analysed by western blot (G). Data representative of two independent experiments.
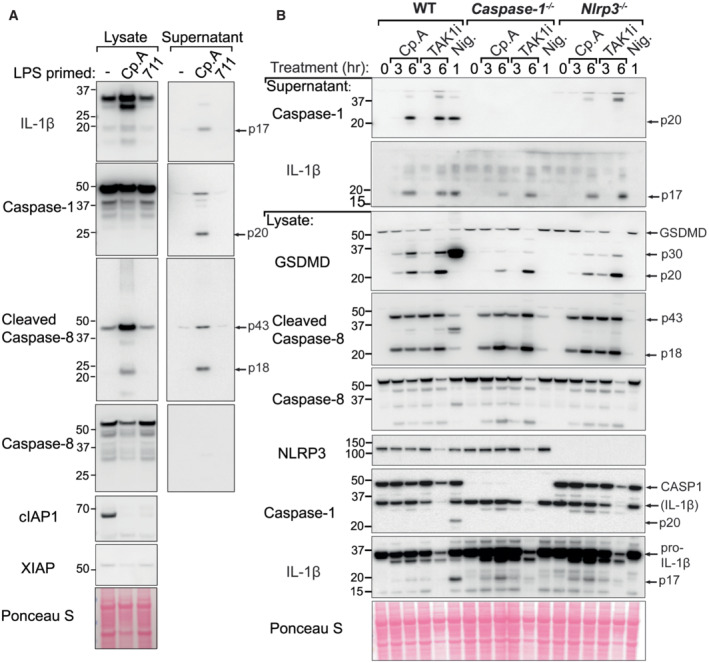
BMDMs were seeded at a density of 4 × 10⁵ cells per well, primed with 20 ng/ml of LPS for 3 h then treated, as indicated, with 500 nM of Cp. A or 711 for 20 h and cell lysates and supernatants were analysed by western blot. Ponceau staining depicts protein loading. Data representative of two independent experiments.
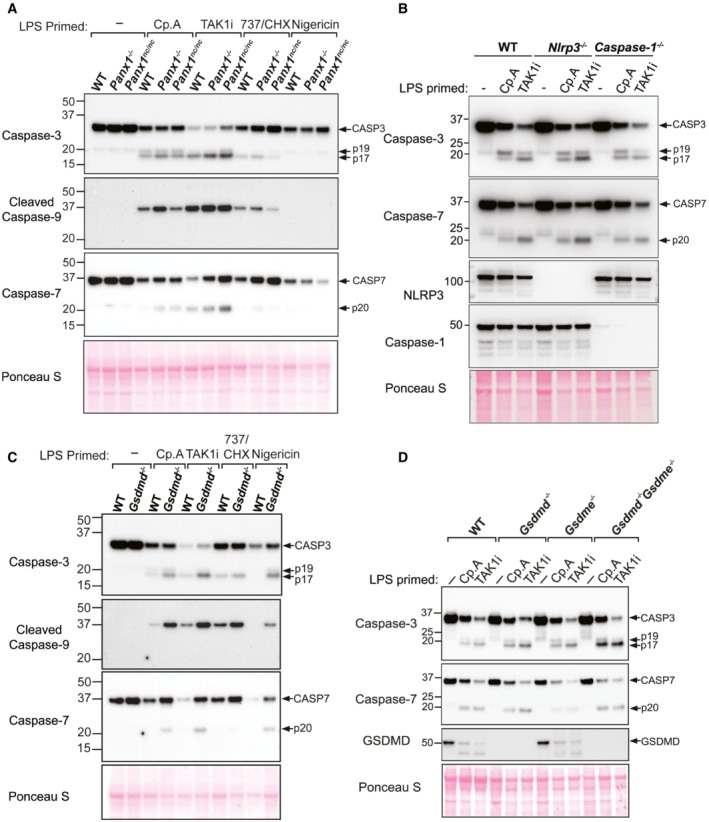
BMDMs of the indicated genotypes were seeded at a density of 5 × 10⁵ cells per well and primed with 100 ng/ml of LPS for 3 h then treated, as indicated, with Cp. A (1 μM), 5Z‐7 oxozeaenol (TAK1i, 250 nM) for 3 or 6 h or nigericin (10 μM) for 45 min. Cell lysates and supernatants were analysed by western blot. Ponceau staining depicts protein loading. Data representative of two independent experiments.
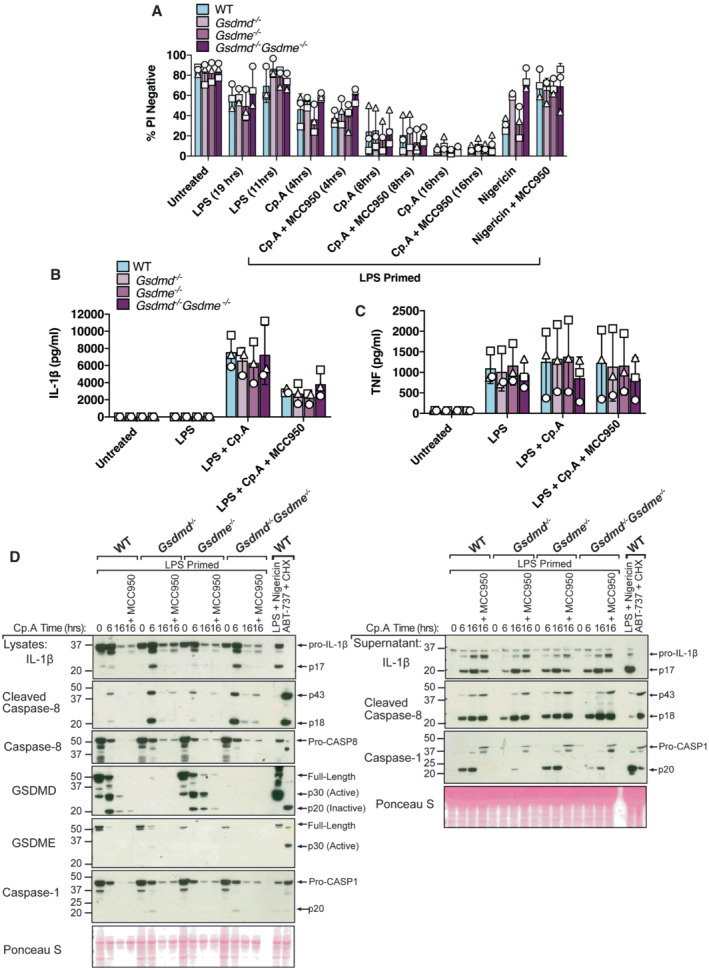
- A–C
BMDMs (5 × 10⁵ cells per well) of the indicated genotypes were primed with 100 ng/ml of LPS for 3 h before treatment with Cp. A (1 μM, up to 16 h as indicated) or nigericin (10 μM) for 20 min, in the absence or presence of the NLRP3 inhibitor MCC950 (5 μM). (A) Cell viability was measured through propidium iodide (PI) uptake and flow cytometry and expressed as a proportion of PI negative (live) cells. (B and C) IL‐1β (B) and TNF (C) levels in cell supernatants were measured by ELISA at the 6 h time point. Data for (A–C) represent the mean of three independent experiments (symbols) and error bars represent the mean ± SD.
- D
BMDMS of the indicated genotypes were treated as in A, and cell lysates and supernatants analysed by western blot. Representative of three independent experiments.
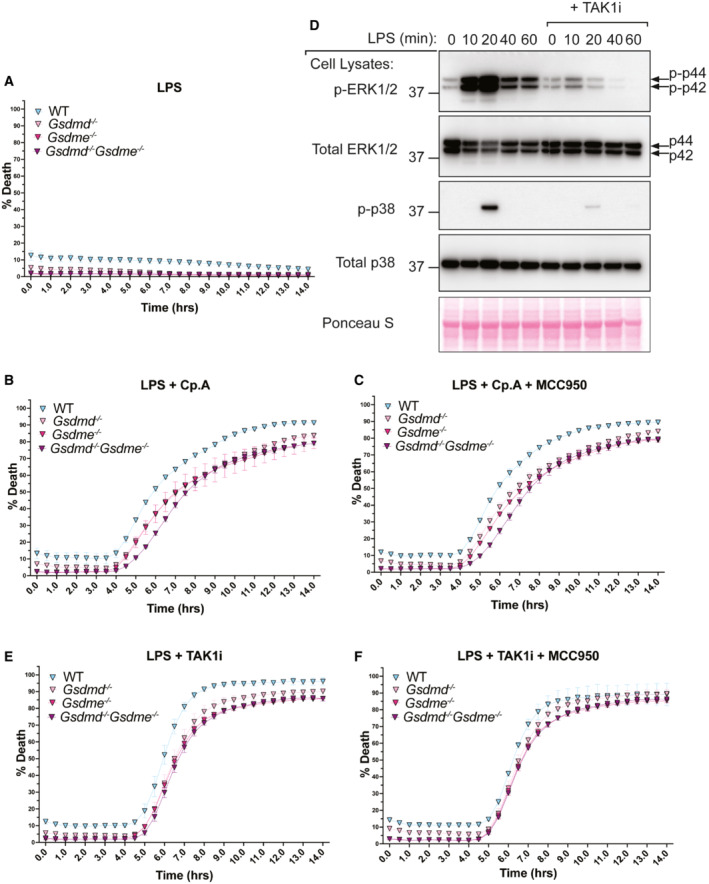
- A–C
BMDMs of the indicated genotypes were seeded at a density of 7.5 × 10⁴ cells per well and treated with LPS alone (A) or primed with LPS (100 ng/ml) for 3 h before treatment with either Cp. A (1 μM) (B) or with Cp. A and MCC950 (5 μM) (C). Cell viability was determined through IncuCyte analysis and measured as the proportion of Cytotox Green positive cells versus SPY620‐DNA positive cells. Each graph is representative of three independent experiments, data points represent the mean of triplicate wells. Error bars are the mean ± SD.
- D
BMDMs were seeded at a density of 4 × 10⁵ cells per well and pre‐treated with TAK1i (250 nM) for 1 h prior to the addition of LPS (100 ng/nl) for 0, 10, 20, 40 and 60 min. Cell lysates were collected and analysed by western blot. Data represent one experiment.
- E, F
BMDMs of the indicated genotypes were seeded at a density of 7.5 × 10⁴ cells per well and primed with LPS (100 ng/ml) for 3 h before treatment with either TAK1i (250 nM) (E) or with TAK1i and MCC950 (5 μM) (F). Cell viability was determined through IncuCyte analysis and measured as the proportion of Cytotox Green positive cells versus SPY620‐DNA positive cells. Each graph is representative of three independent experiments, data points represent the mean of triplicate wells. Error bars are the mean ± SD.
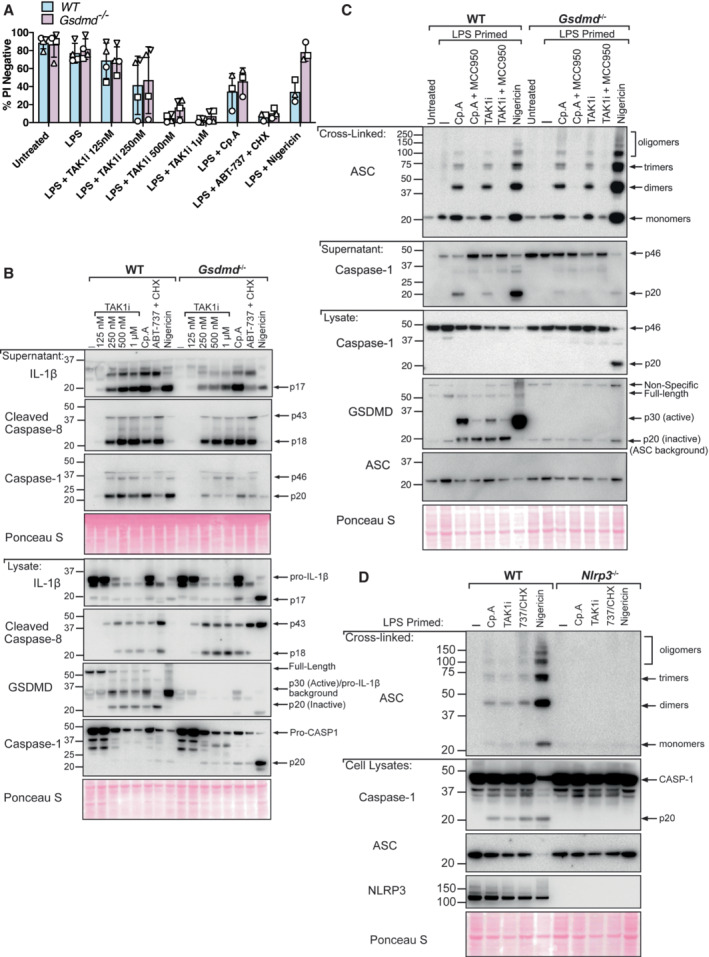
BMDMs of the indicated genotypes were primed with 100 ng/ml of LPS for 3 h before treatment with 5Z‐7 oxozeaenol (TAK1i, 125 nM, 250 nM, 500 nM, and, 1 μM), Cp. A (1 μM) or ABT‐737 (1 μM) and CHX (20 μg/ml) for 6 h, or nigericin (10 μM) for 20 min. Cell viability was measured by propidium iodide (PI) uptake and flow cytometry and expressed as a percentage of PI‐negative (live) cells. Three to four independent experiments are shown (symbols), and error bars represent the mean ± SD.
BMDMs of the indicated genotypes were primed with 100 ng/ml of LPS for 3 h before treatment with 5Z‐7 oxozeaenol (TAK1i, 125 nM, 250 nM, 500 nM, and, 1 μM), Cp. A (1 μM) or ABT‐737 (1 μM) and CHX (20 μg/ml) for 6 h, or nigericin (10 μM) for 45 min. Cell supernatants and total cell lysates were analysed by western blot. Ponceau staining depicts protein loading. One of three independent experiments.
BMDMs of the indicated genotypes were seeded at a density of 2 × 10⁶ cells per well and primed with LPS (100 ng/ml) for 3 h before treatment with Cp. A (1 μM) or 5Z‐7 oxozeaenol (TAK1i, 250 nM) with or without the NLRP3 inhibitor MCC950 (5 μM) for 6 h or were treated with nigericin (10 μM) for 45 min. Cell lysates and supernatants were analysed by western blot. Following freeze‐thawing of cells, the PBS‐insoluble fraction of the cell lysate was cross‐linked and assessed for ASC oligomerisation by western blot. Ponceau staining depicts protein loading. Data representative of three independent experiments.
BMDMs of the indicated genotypes were seeded at a density of 2 × 10⁶ cells per well and primed with 100 ng/ml LPS for 6 h before treatment with Cp. A (1 μM) or TAK1i (250 nM) for 6 h, ABT‐737 (1 μM) and CHX (20 μg/ml) for 3 h and Nigericin (10 μΜ) for 1 h. PBS insoluble fractions of cell lysates were cross‐linked to assess ASC oligomerisation and these, alongside cell lysates and supernatants, were analysed by western blot. Data represent two independent experiments.
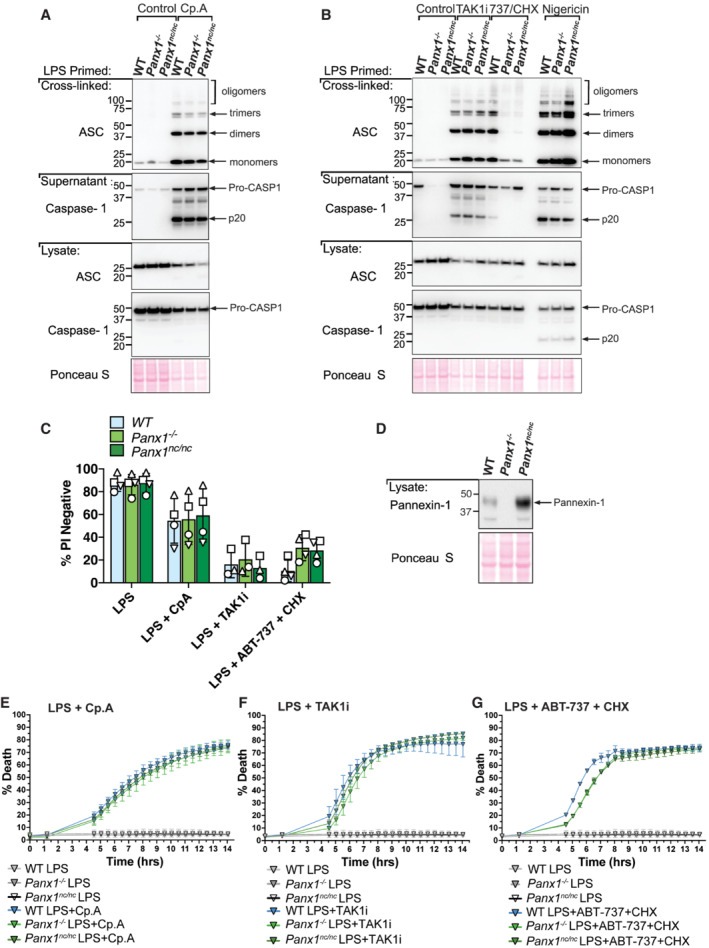
- A, B
BMDMs of the indicated genotypes were seeded at a density of 2 × 10⁶ cells per well and were primed with 100 ng/ml LPS for 3 h and then treated with Cp. A (1 μM) for 6 h (A) or with 5Z‐7 oxozeaenol (TAK1i, 250 nM) or ABT‐737 (1 μM) and CHX (20 μg/ml) for 6 h, or nigericin (10 μM) for 45 min (B). Cell lysates and supernatants were analysed by western blot and the PBS‐insoluble fraction of the cell lysate was cross‐linked and assessed for ASC oligomerisation by western blot. Ponceau staining depicts protein loading. Data representative of two independent experiments.
- C
BMDMs of the indicated genotypes were seeded at a density of 5 × 10⁵ cells per well and were treated as outlined in (A) and (B). Cell viability was determined by PI staining and flow cytometry and measured as a proportion of PI‐negative (live) cells. Data represent the mean of three to four independent experiments (symbols). Error bars are the mean ± SD.
- D
BMDMs of the indicated genotypes were seeded at a density of 5 × 10⁵ cells per well and cell lysates were analysed by western blot.
- E–G
IncuCyte live cell imaging analysis of BMDM death kinetics. BMDMs were seeded at a density of 7.5 × 10⁴ per well and primed with LPS (100 ng/ml) for 3 h before treatment with Cp.A (1 μΜ, E), TAK1i (250 nM, F) or ABT‐737 (1 μΜ) + CHX (20 μg/ml, G) for 14 h. Cell death was measured as a percentage of cytox green positive cells versus SPY620‐DNA positive cells. Each graph is representative of three independent experiments, data points represent the mean of triplicate wells. Error bars are the mean ± SD.
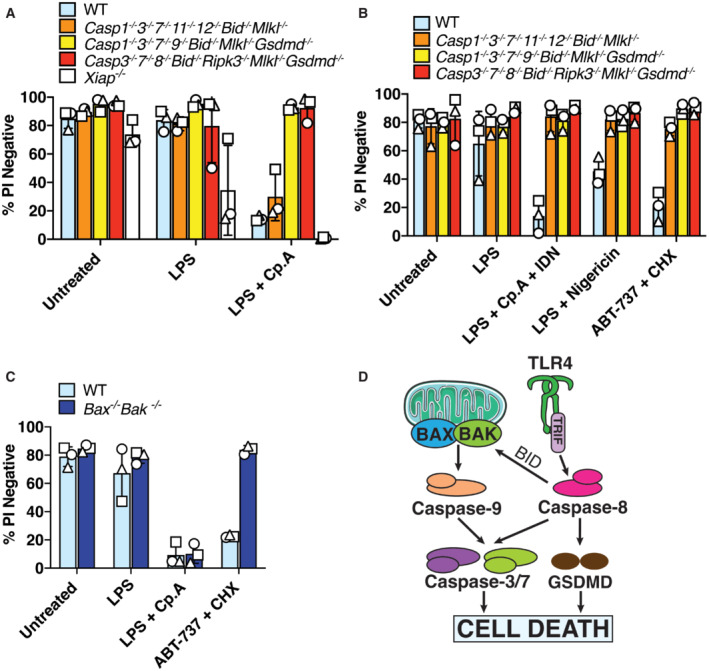
- A
iBMDMs of the indicated genotypes were seeded at a density of 2 × 10⁵ cells per well and were primed with 50 ng/ml LPS for 3 h then treated with Cp. A (2 μM) for 24 h. Cell viability was determined by PI staining and flow cytometry and measured as a proportion of PI‐negative (live) cells. Data represent the mean of three independent experiments (symbols). Error bars are the mean ± SD.
- B, C
iBMDMs of the indicated genotypes seeded at a density of 2 × 10⁵ cells per well were treated with ABT‐737 (1 μM) and CHX (20 μg/ml) for 6 h, or LPS (50 ng/ml) and Cp. A (2 μM) and IDN‐6556 (10 μM) for 24 h, or with LPS (50 ng/ml) for 3 h followed by nigericin (10 μM) for 1.5 h. Cell viability was determined by PI staining and flow cytometry and measured as a proportion of PI‐negative (live) cells. Data represent the mean of three independent experiments (symbols). Error bars are the mean ± SD.
- D
Schematic model for how intrinsic and extrinsic cell death signalling are executed in macrophages.
- A–D
BMDMs of the indicated genotypes were seeded at a density of 4 × 10⁵ cells per well and primed with LPS (100 ng/ml) for 3 h before treatment with Cp. A (1 μM) or TAK1i (250 nM) for 6 h, ABT‐737 (1 μM) and CHX (20 μg/ml) for 4 h, or nigericin (10 μM) for 45–60 min. Cell lysates were harvested and analysed by western blot. Data represent 3 (A and C) or 2 (B and D) independent experiments.
- A, B
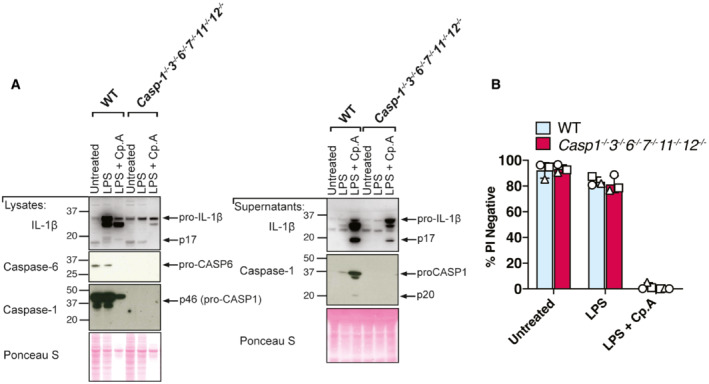
iBMDMs of the indicated genotypes were seeded at a density of 3 × 10⁵ cells per well and primed with 100 ng/ml of LPS for 3 h before treatment with Cp. A (2 μM) for 24 h. Total cell lysates and supernatants were analysed by western blot (A) or cell viability determined by propidium iodide (PI) uptake and flow cytometry (B). Data representative of three independent experiments (A), or three independent experiments (symbols) are shown (B). Error bars represent the mean ± SD.
- A
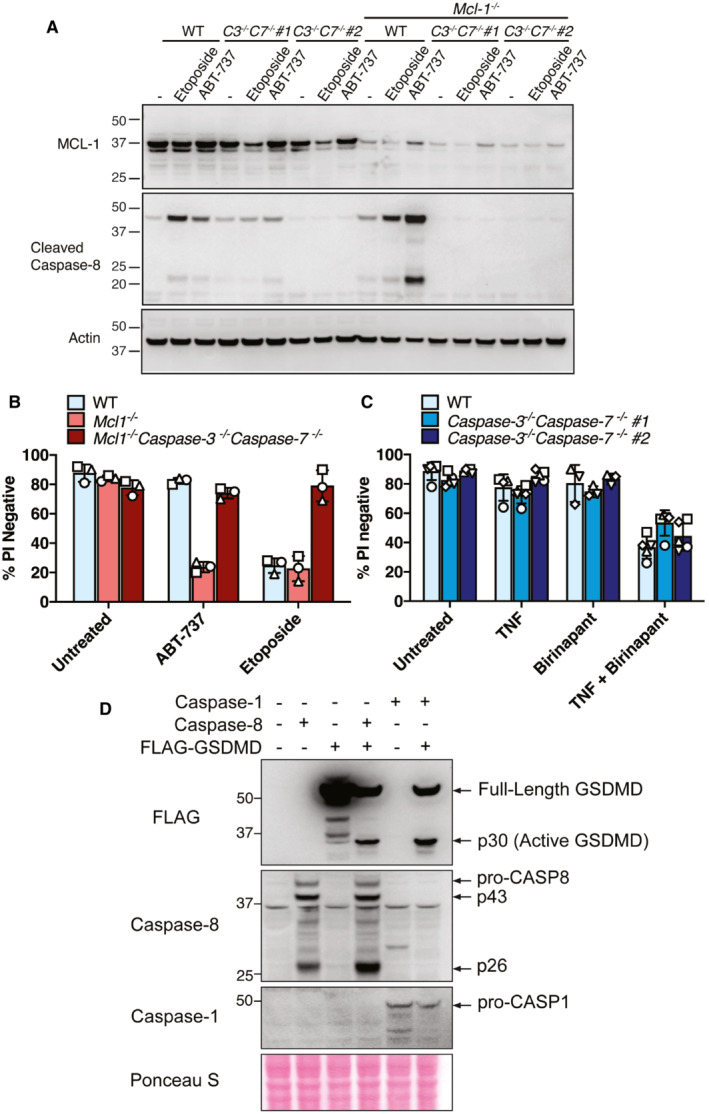
Western blot showing CRISPR/Cas9 targeting of MCL‐1 (polyclonal population) and caspase‐8 processing in SV40T immortalised MEFs derived from two separate caspase‐3 −/− caspase‐7 −/− (C3 −/‐ C7 −/−) embryos treated with or without ABT‐737 (1 μM) or etoposide (34 μM) for 24 h. Data represent one experiment.
- B, C
SV40T immortalised MEFs of the indicated genotypes (caspase‐3 −/− caspase‐7 −/− MEFs generated from two mice shown in C) were treated with ABT‐737 (1 μM), etoposide (34 μM), TNF (100 ng/ml) or the IAP antagonist birinapant (1 μM) as depicted for 24 h and cell death analysed by PI uptake and flow cytometry. Three to five independent experiments (symbols) are shown. Error bars represent the mean ± SD.
- D
293 T cells were transfected with the indicated cDNAs and caspase‐1‐ or caspase‐8‐mediated processing of FLAG‐tagged GSDMD evaluated by western blot. Ponceau staining depicts protein loading. One of two experiments.
- A, B
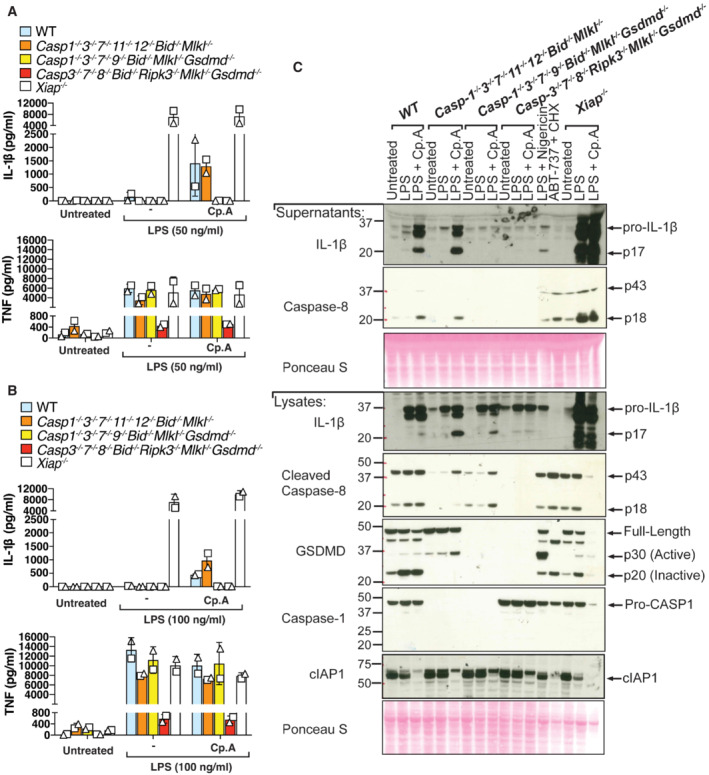
iBMDMs of the indicated genotypes were seeded at a density of 4 × 10⁵ cells per well and primed with either 50 ng/ml (A) or 100 ng/ml (B) of LPS for 3 h then treated with Cp. A (2 μM) for 24 h. Cell supernatants were analysed by ELISA for levels of IL‐1β and TNF, as indicated. Data represent the mean of two independent experiments, error bars are the mean ± SD.
- C
iBMDMs of the indicated genotypes were seeded at a density of 4 × 10⁵ cells per well and primed with 100 ng/ml of LPS for 3 h then treated with Cp. A (2 μM) for 24 h. As control stimuli, WT iBMDMs were primed with LPS (100 ng/ml) for 3 h then treated with nigericin (10 μM) for 1.5 h or ABT‐737 (1 μM) and CHX (20 μg/ml) for 6 h. Total cell lysates and supernatants were analysed by western blot. Ponceau staining depicts protein loading. Data representative of four independent experiments.
References
-
- Aguilar C, Latour S (2015) X‐linked inhibitor of apoptosis protein deficiency: more than an X‐linked lymphoproliferative syndrome. J Clin Immunol 35: 331–338 - PubMed
-
- Aguilar C, Lenoir C, Lambert N, Begue B, Brousse N, Canioni D, Berrebi D, Roy M, Gerart S, Chapel H et al (2014) Characterization of Crohn disease in X‐linked inhibitor of apoptosis‐deficient male patients and female symptomatic carriers. J Allergy Clin Immunol 134: 1131–1141.e39 - PubMed
-
- Alvarez‐Diaz S, Dillon CP, Lalaoui N, Tanzer MC, Rodriguez DA, Lin A, Lebois M, Hakem R, Josefsson EC, O'Reilly LA et al (2016) The Pseudokinase MLKL and the kinase RIPK3 have distinct roles in autoimmune disease caused by loss of death‐receptor‐induced apoptosis. Immunity 45: 513–526 - PMC - PubMed
Publication types
MeSH terms
Substances
Supplementary concepts
LinkOut - more resources
Full Text Sources
Research Materials
Miscellaneous
