. 2023 Jan 17:12:e81032.
doi: 10.7554/eLife.81032.

Gain-of-function variants in the ion channel gene TRPM3 underlie a spectrum of neurodevelopmental disorders

Affiliations

Gain-of-function variants in the ion channel gene TRPM3 underlie a spectrum of neurodevelopmental disorders

Lydie Burglen et al. Elife. .

Abstract

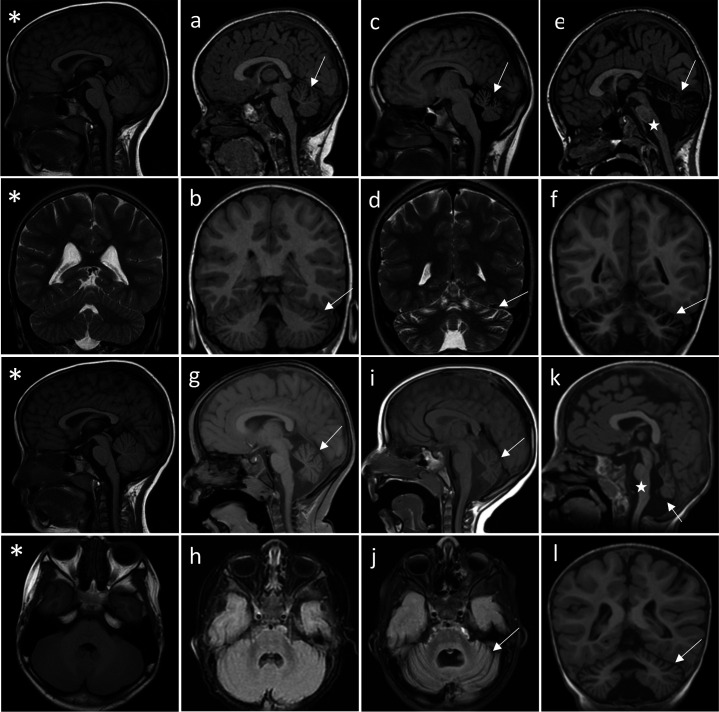
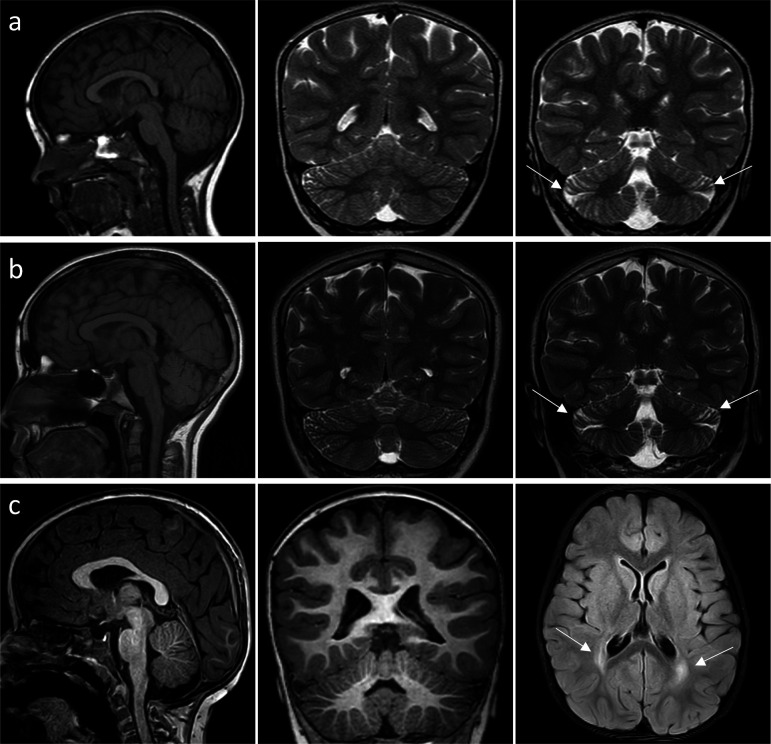
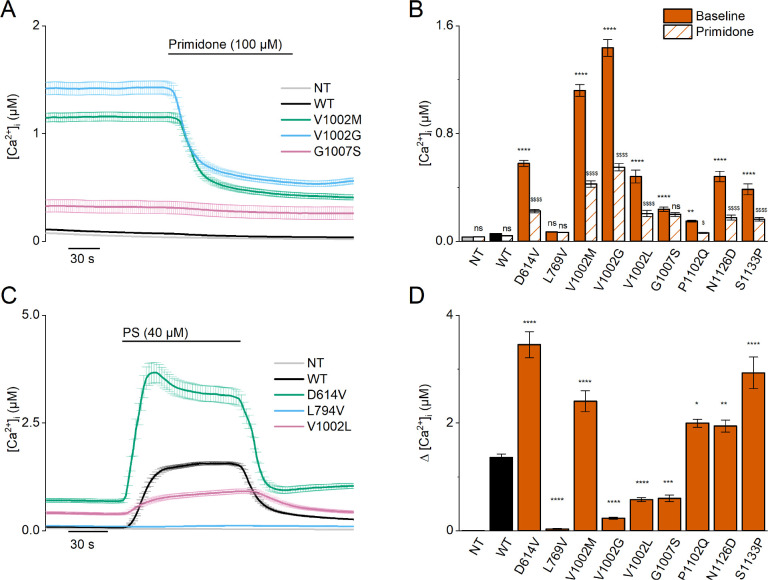
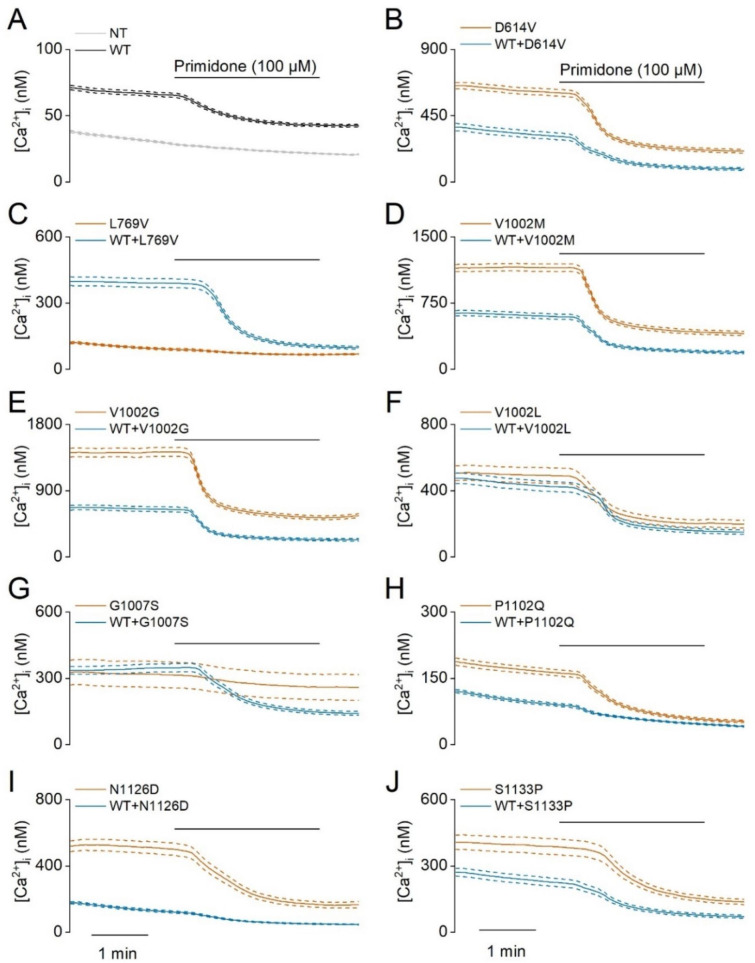
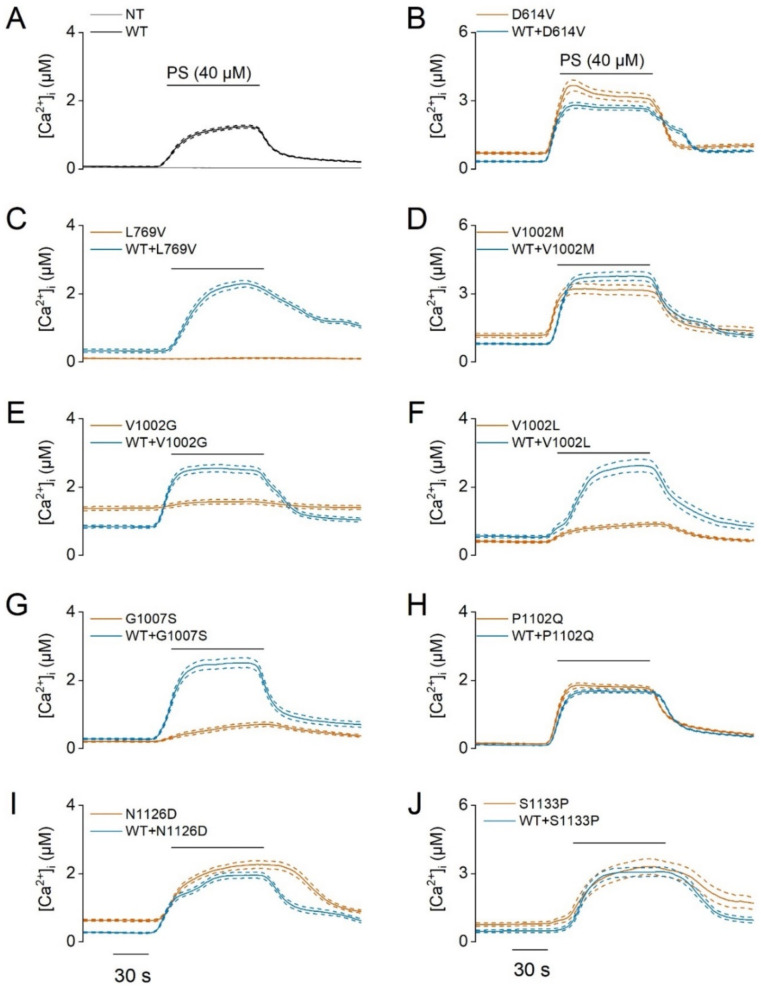
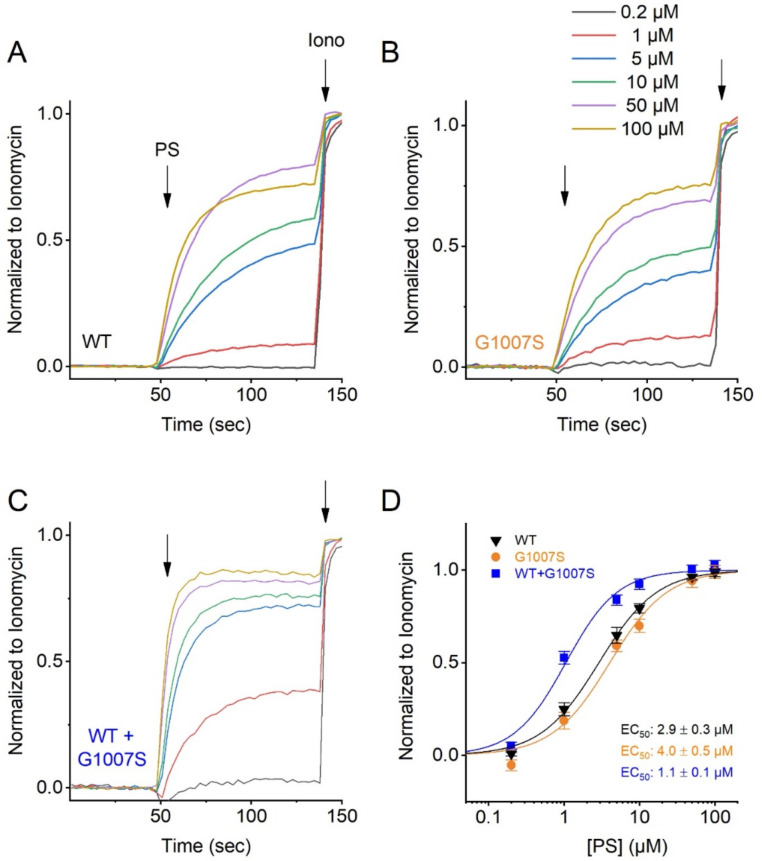
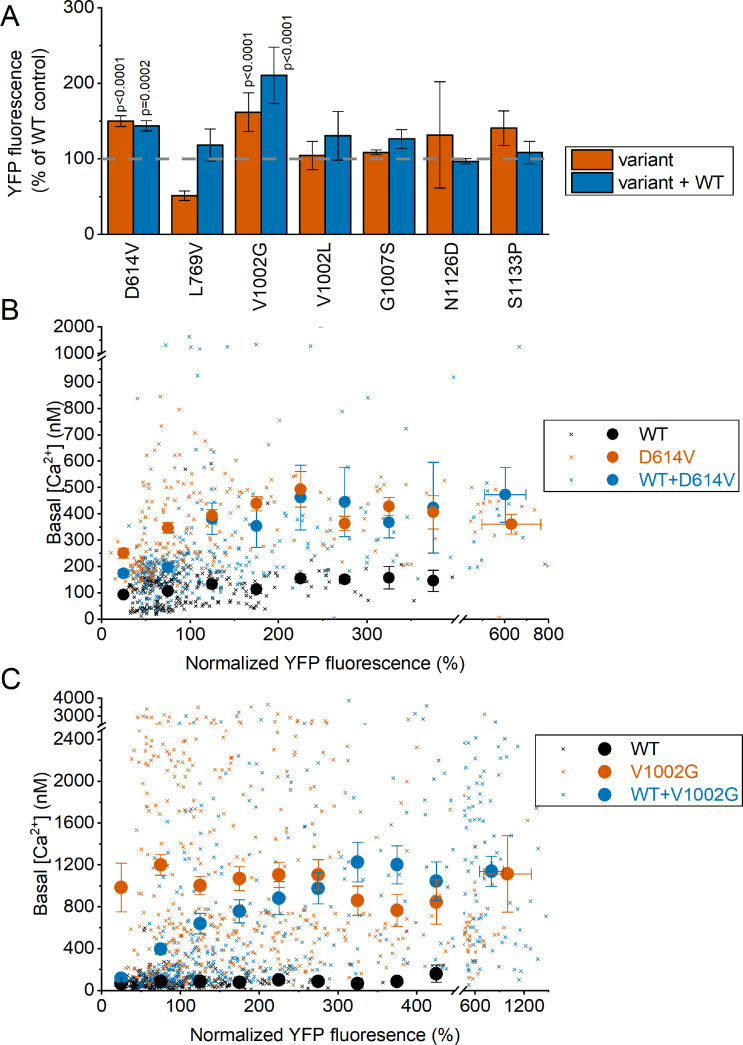
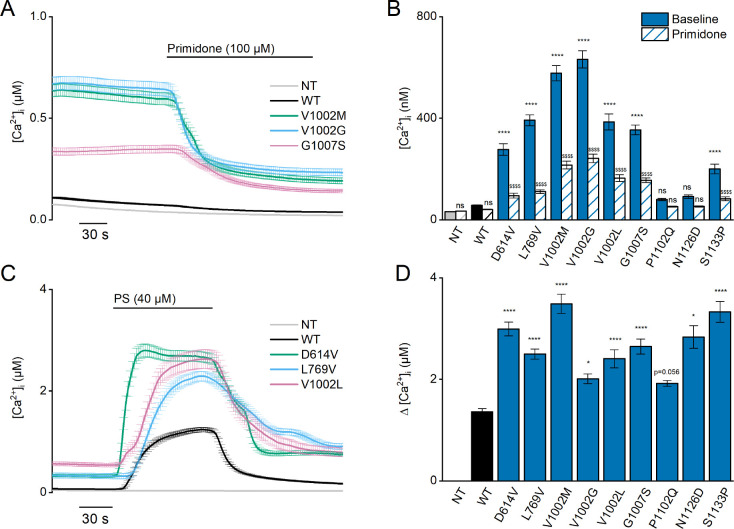
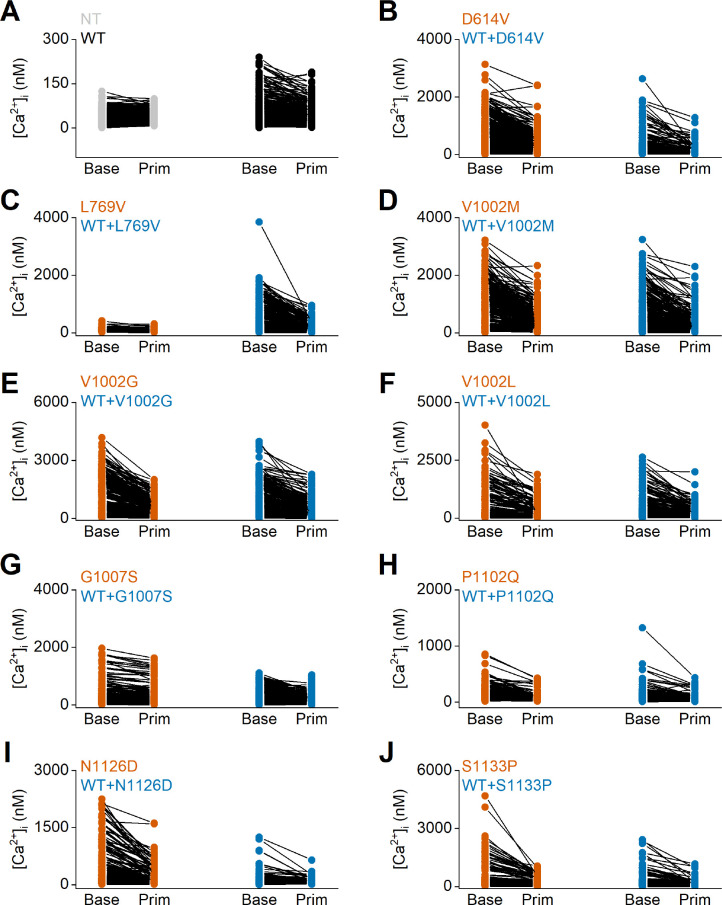
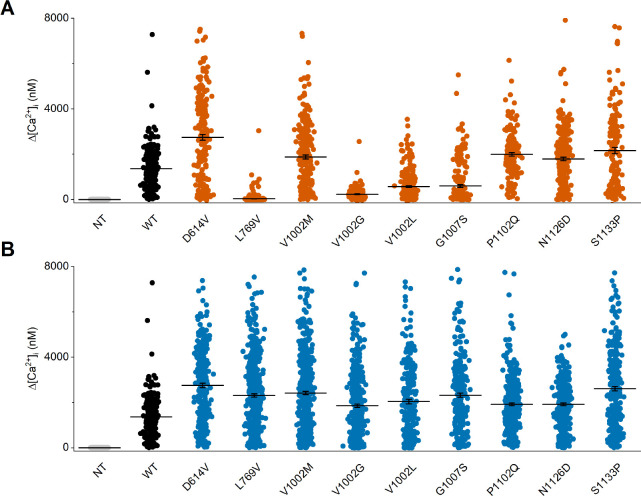
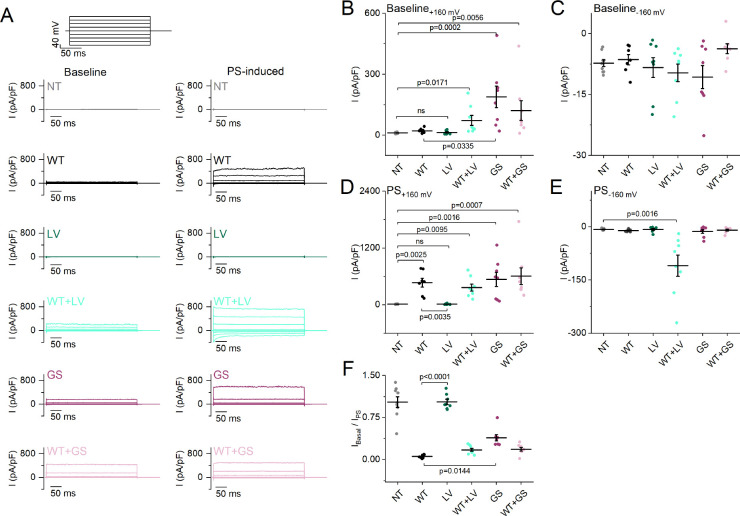
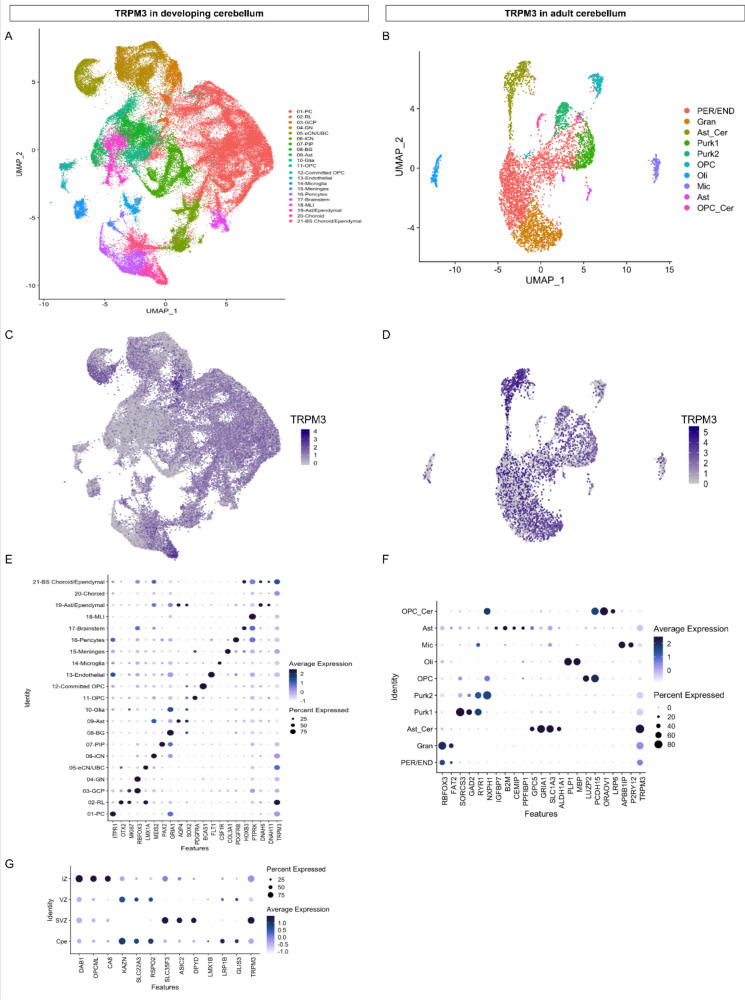
TRPM3 is a temperature- and neurosteroid-sensitive plasma membrane cation channel expressed in a variety of neuronal and non-neuronal cells. Recently, rare de novo variants in TRPM3 were identified in individuals with developmental and epileptic encephalopathy, but the link between TRPM3 activity and neuronal disease remains poorly understood. We previously reported that two disease-associated variants in TRPM3 lead to a gain of channel function . Here, we report a further 10 patients carrying one of seven additional heterozygous TRPM3 missense variants. These patients present with a broad spectrum of neurodevelopmental symptoms, including global developmental delay, intellectual disability, epilepsy, musculo-skeletal anomalies, and altered pain perception. We describe a cerebellar phenotype with ataxia or severe hypotonia, nystagmus, and cerebellar atrophy in more than half of the patients. All disease-associated variants exhibited a robust gain-of-function phenotype, characterized by increased basal activity leading to cellular calcium overload and by enhanced responses to the neurosteroid ligand pregnenolone sulfate when co-expressed with wild-type TRPM3 in mammalian cells. The antiseizure medication primidone, a known TRPM3 antagonist, reduced the increased basal activity of all mutant channels. These findings establish gain-of-function of TRPM3 as the cause of a spectrum of autosomal dominant neurodevelopmental disorders with frequent cerebellar involvement in humans and provide support for the evaluation of TRPM3 antagonists as a potential therapy.

Keywords: TRPM3; cell biology; cerebellar atrophy; epilepsy; gain-of-function; human; intellectual disability; neurodevelopment; neuroscience.


Conflict of interest statement

LB, EV, LQ, MB, NB, FB, CD, KD, AD, MF, NF, CG, IH, KH, DH, AJ, AK, VN, CP, MR, AA, SZ, VR, SR, ST, SV, LV, TR, DR, DD, TV, JV No competing interests declared

Figures

Figure 1.
Figure 1.. Overview of the TRPM3 gene and location of the different variants.
(A) Exon-intron structure and alternative splicing of TRPM3. Percentages above colored exons indicate the percentage of transcripts that include the indicated exons in human cerebellar RNA-seq analyses. Exons included for numbering of the disease-associated variants are indicated in gray, blue, and green, resulting in the functional channel construct indicated in (B). Variant numbering was based on the amino acid position of the mutated residue in the NM_001366145.2 isoform. See text for more details.
Figure 1—figure supplement 1.
Figure 1—figure supplement 1.. Functional characterization of different human TRPM3 constructs.
(A–B) Three different variants of human TRPM3 (AJ505026.1 black, n=416 cells), NM_001366145.2 (dark gray, n=673), and NM_001366147.2 (light gray, n=644) were functionally characterized via Fura-2 fluorimetric experiments (N≥3 independent experiments). The TRPM3 agonist pregnenolone sulfate (PS; 40 µM) and clotrimazole (Clt; 10 µM) were applied at the indicated time periods. (B) Corresponding calcium amplitudes after stimulation by PS, Clt, and co-application of PS + Clt, represented as mean ± SEM. (C–D) NM_001366145.2 construct was further characterized via whole-cell patch-clamp experiments in HEK293T cells (N=5) after stimulation by PS (40 µM), Clt (10 µM), and co-application PS + Clt. (C) Time course of whole-cell patch clamp recording at holding of +150 mV (open circles) and –150 mV (closed circles) of HEK293T cells expressing the TRPM3 NM_001366145.2 construct. (D) Current-voltage relationship of time points indicated in panel (C).
Figure 1—figure supplement 2.
Figure 1—figure supplement 2.. Structural model of TRPM3 based on the cryo-Electron Microscopy (EM) structure (pdb: 8DDQ).
(A–B) Structural model of TRPM3, based on the cryo-EM structure (pdb: 8DDQ), seen from the side (A) and the top (B), indicating residues that are altered in the disease-associated variants. In one of the four subunits (blue), the red circled area indicates the location of the non-resolved loop where D694 is located, close to the interaction site of Gβγ. Other affected residues are indicated in magenta and green. (C) A cluster of disease-associated residues (magenta) is localized at the interface between transmembrane domain and cytosol, whereas P1092 is located at the extracellular part of transmembrane helix S6.
Figure 1—figure supplement 3.
Figure 1—figure supplement 3.. Sequence alignment of TRPM3 with different species and different members of the transient receptor potential (TRP) melastatin (M) family.
CLUSTAL Omega (1.2.4) multiple sequence alignment was used to perform the alignment and to obtain the Phylogenetic Tree as shown on the left top. Sequence alignment at positions D614, L769, V1002, G1007, P1102, N1126, and S1133 is conserved across multiple species (A) and conserved across related members of the TRPM family (B).
Figure 2.
Figure 2.. Successive MRI of several patients carrying different TRPM3 variants.
*Normal MRI: the fissures of the vermis and cerebellar hemispheres are nearly virtual. (a–i) MRI of the patients showing variable widening of the cerebellar fissures (arrows) reflecting cerebellar (vermis and/or hemispheres) atrophy. (a–d) Patient 1, MRI at 3 years 8 months showing slight atrophy of the vermis (a-sagittal T1) and cerebellar hemispheres (B-coronal T1); and majoration of the atrophy at 10 years (c-sagittal T1 and d-coronal T2), (e–f) Patient 3; MRI at 8 years 6 months: severe atrophy of the vermis (arrow) and brainstem (star), and atrophy of the cerebellar hemispheres (sagittal and coronal T1). (g–j) successive MRIs in patient showing progressive atrophy (g: 2 years 2 months; h: 6 months; i–j: 4 years 2 months). (k and l) Patient 4; MRI at 1 years 4 months: small vermis, thin brainstem (star) and atrophy of the cerebellar hemispheres (sagittal and coronal T1).
Figure 2—figure supplement 1.
Figure 2—figure supplement 1.. MRI of patient 7 and patient 8.
(a–b) Patient 7, very mild and localized atrophy of the cerebellar hemispheres (arrows), stable (2 years 10 months (a); 12 years 1 month (b)). (c) Patient 8, normal posterior fossa at age of 3 years; non-specific bilateral symmetric periventricular white matter hyperintensities on FLAIR axial MRI (arrows).
Figure 3.
Figure 3.. Homozygous mutant expression in HEK293T cells.
(A) Time course of intracellular calcium concentrations ([Ca2+]i) (± SEM) upon application of the TRPM3 inhibitor primidone (100 µM) for wild-type (WT; black; n=449), and homozygous V1002M (green; n=271), V1002G (blue; n=257), and G1007S (red; n=409) transfected HEK293T cells, and non-transfected (NT; gray; n=982; N=3 independent measurements). (B) Mean basal intracellular calcium concentrations, [Ca2+]I, in the absence (full bars) and presence of primidone (100 µM; striped bars). Data are represented as mean ± SEM, using a two-way ANOVA with Sidak’s posthoc test. p-Values of baseline vs WT: NT (p=0.8376), D614V (p<0.0001), L794V (p>0.9999), V1002M (p<0.0001), V1002G (p<0.0001), V1002L (p<0.0001), G1007S (p<0.0001), P1102Q (p=0.0018), N1126D (p<0.0001), S1133P (p<0.0001); p-values baseline vs primidone: NT (p>0.9999), WT (p=0.9994), D614V (p<0.0001), L794V (p>0.9999), V1002M (p<0.0001), V1002G (p<0.0001), V1002L (p<0.0001), G1007S (p=0.5663), P1102Q (p=0.0138), N1126D (p<0.0001), S1133P (p<0.0001). (C) Time course of [Ca2+]I (± SEM) for WT (black) (n=243), D614V (green) (n=220), L794V (blue) (n=420) and V1002L (red) (n=264) transfected HEK293T cells, and non-transfected (NT; gray) (n=452) upon application of pregnenolone sulfate (PS; 40 µM) (N=3 independent measurements). (D) Corresponding calcium amplitudes of the PS response, represented as mean ± SEM, using a Kruskal-Wallis ANOVA with Dunnett’s posthoc test (p-values vs WT: D614V (p<0.0001), L794V (p<0.0001), V1002M (p<0.0001), V1002G (p<0.0001), V1002L (p<0.0001), G1007S (p=0.0006), P1102Q (p=0.0102), N1126D (p=0.0098), S1133P (p<0.0001)). For these experiments, the isoform corresponding to GenBank AJ505026.1 was used.
Figure 3—figure supplement 1.
Figure 3—figure supplement 1.. Elevated basal activity in HEK293T cells expressing TRPM3 variants.
Time course of intracellular calcium concentrations, [Ca2+]I ± SEM upon application of the TRPM3 inhibitor primidone (100 µM) in homozygous (orange) and heterozygous (blue) transfected HEK293T cells. Cells were transfected with (A) TRPM3 wild-type (WT) and non-transfected cells (NT), and the TRPM3 variant D614V (B), L769V (C), V1002M (D), V1002G (E), V1002L (F), G1007S (G), P1102Q (H), N1126D (I) and S1133P (J) (N=3 independent experiments). For these experiments, the isoform corresponding to GenBank AJ505026.1 was used.
Figure 3—figure supplement 2.
Figure 3—figure supplement 2.. PS-induced calcium influxes in TRPM3-developmental and epileptic encephalopathy (DEE) mutants.
Time course of intracellular calcium concentrations, [Ca2+]i ± SEM upon application of the pregnenolone sulfate (PS; 40 µM) in homozygous (orange) and heterozygous (blue) transfected HEK293T cells. Cells were transfected with (A) TRPM3 wild-type (WT, black) and non-transfected cells (NT, gray), the TRPM3 variant D614V (B), L769V (C), V1002M (D), V1002G (E), V1002L (F), G1007S (G), P1102Q (H), N1126D (I) and S1133P (J) (N=3 independent experiments). For these experiments, the isoform corresponding to GenBank AJ505026.1 was used.
Figure 3—figure supplement 3.
Figure 3—figure supplement 3.. Pregnenolone Sulfate dose dependency of the TRPM3 variant G1007S.
HEK293T cells were transfected with TRPM3 or its mutant G1007S, or a 1:1 ratio of mutant and wild-type TRPM3 plus the calcium sensor GCaMP6. Fluorescence was measured in a 96-well plate reader (Flexstation-3). (A–C) Representative fluorescence traces of wild-type TRPM3 (A), the G1007S mutant (B), co-transfection of TRPM3 and G1007S (1:1 ratio) (C). The applications of various concentrations of PS and ionomycin (Iono; 2 µM) are indicated by the arrows. Basal fluorescence was subtracted and PS-induced Ca2+ signals were normalized to the signal after applying ionomycin. Each single trace shows the average of four replicates from the same transfection. (D) Hill 1 fits of the PS dose dependency of the TRPM3 mutant G1007S. Symbols represent Mean ± SEM from 3 independent experiments. For these experiments, the isoform corresponding to NCBI reference sequence NM_001366141.2 cloned in the pcDNA3.1(+)-N-eGFP vector, was used.
Figure 3—figure supplement 4.
Figure 3—figure supplement 4.. Fluorescence Intensity of channel-linked yellow fluorescence protein (YFP) in cells expressing WT TRPM3 and TRPM3 variants.
(A) YFP fluorescence in HEK293T cells expressing the indicated variants, with (1:1) or without co-expression of the WT subunit. Fluorescence values were normalized to the mean YFP fluorescence of cells expressing WT TRPM3 transfected on the same experimental day. A one-way ANOVA with Dunnett’s posthoc test was used and significant p-values are reported on the graph. (B) Scatter plot (small crosses) of basal [Ca2+]i levels vs normalized YFP fluorescence for cells expressing WT TRPM3, D614V, and WT + D614V. The large filled symbols show the mean basal [Ca2+]i levels for pooled cells with similar YFP fluorescence. Cells were binned according to YFP fluorescence with a bin width of 50%. All cells with YFP levels higher than the highest bin for WT were pooled in the rightmost bin. (C) Same as (B), but for the V1002G variant. Note that the total amount of DNA used for transfection was identical for all conditions. Symbols represent Mean ± SEM.
Figure 4.
Figure 4.. Heterozygous mutant + wild-type (WT) expression in HEK293T cells.
(A) Time course of [Ca2+]I ± SEM upon application of the TRPM3 inhibitor primidone (100 µM) for WT (black; n=449), and heterozygous WT + V1002 M (green; n=373), WT + V1002 G (blue; n=482), and WT + G1007 S (red) (n=561) transfected HEK293T cells, and non-transfected (NT; gray; n=982; N=3 independent measurements). (B) Mean basal [Ca2+]I ± SEM in the absence (full bars) and presence of primidone (striped bars). A two-way ANOVA with Sidak’s posthoc test was used. p-Values of baseline vs WT: NT (p=0.6733), D614V (p<0.0001), L794V (p<0.0001), V1002M (p<0.0001), V1002G (p<0.0001), V1002L (p<0.0001), G1007S (p<0.0001), P1102Q (p=0.9249), N1126D (p=0.5539), and S1133P (p<0.0001); p-Values baseline vs primidone: NT (p>0.9999), WT (p=0.9994), D614V (p<0.0001), L794V (p<0.0001), V1002M (p<0.0001), V1002G (p<0.0001), V1002L (p<0.0001), G1007S (p<0.0001), P1102Q (p=0.8205), N1126D (p=0.5132), and S1133P (p<0.0001). (C) Time course of [Ca2+]I (± SEM) for WT (black; n=243), WT + D614V (green; n=281), WT + L794V (blue; n=497) and WT + V1002L (red; n=276) transfected HEK293T cells, and non-transfected (NT; gray; n=452) upon application of pregnenolone sulfate (PS; 40 µM; N=3 independent measurements). (D) Corresponding calcium amplitudes of the PS response, represented as mean ± SEM, using a Kruskal-Wallis ANOVA with Dunnett’s posthoc test (p-values vs WT: D614V [p<0.0001], L794V [p<0.0001], V1002M [p<0.0001], V1002G [p=0.0155], V1002L [p<0.0001], G1007S [p<0.0001], P1102Q [p=0.0564], N1126D [p=0.0277], and S1133P [p<0.0001]). For these experiments, the isoform corresponding to GenBank AJ505026.1 was used.
Figure 4—figure supplement 1.
Figure 4—figure supplement 1.. Individual data points of intracellular calcium concentrations at baseline and upon application of the TRPM3 inhibitor primidone.
Time course of intracellular calcium concentrations, [Ca2+]I ± SEM upon application of the pregnenolone sulfate (PS; 40 µM) in homozygous (orange) and heterozygous (blue) transfected HEK293T intracellular calcium concentrations ([Ca2+]I), in the absence (Base) and presence of primidone (Prim; 100 µM). Each individual cells is represented as a single dot, and the same cell is connected with a line before and after the application of primidone. (A) Non-transfected (NT) cells and wild-type (WT) transfected HEK293T cells are represented in gray and black, respectively. (B–J) Homozygous and heterozygous (WT + mutant construct) transfected HEK293T cells are represented in orange and blue, respectively. Including the TRPM3 variant D614V (B), L769V (C), V1002M (D), V1002G (E), V1002L (F), G1007S (G), P1102Q (H), N1126D, (I) and S1133P (J). For these experiments, the isoform corresponding to GenBank AJ505026.1 was used.
Figure 4—figure supplement 2.
Figure 4—figure supplement 2.. Individual data points of intracellular calcium amplitudes upon application of the TRPM3 agonist pregnenolone sulfate (PS).
Corresponding calcium amplitudes (Δ[Ca2+]I) of the PS responses. Non-transfected (NT) cells and wild-type (WT) transfected HEK293T cells are represented in gray and black, respectively. (A) Homozygous and (B) heterozygous (WT + mutant construct) transfected HEK293T cells are represented in orange and blue, respectively. Each individual cells is represented as a single dot and the line represents mean ± SEM. For these experiments, the isoform corresponding to GenBank AJ505026.1 was used.
Figure 4—figure supplement 3.
Figure 4—figure supplement 3.. Baseline and pregnenolone sulfate (PS)-induced current densities of the L769V and G1007S substitution.
(A) Representative whole-cell TRPM3 current densities (pA/pF) recorded at baseline without an agonist (left) and during the application of the agonist PS (right) during voltage steps ranging from –160 mV to +160 mV, separated by steps of + 40 mV for non-transfected HEK293T cells (NT), wild-type (WT), L769V (LV), WT + LV, G1007S (GS), and WT + GS transfected HEK293T cells. (B–E) Scatter plot of current densities (pA/pF) for NT, WT, LV, WT + LV, GS, and WT + GS transfected HEK293T cells (N=7 for WT and N=8 for other conditions) without the application of an agonist at + 160 mV (B) and –160 mV (C) and during the application of PS at +160 mV (D) and –160 mV (E). (F) Fraction of current densities (pA/pF) at baseline compared to current densities when the agonist PS was applied (IBaseline/IPS). Data are represented as mean ± SEM, and individual cells are represented as a dot (B–F). A Kruskal-Wallis ANOVA with Dunn’s posthoc test was used. For all plots, relevant p-values are reported on the graphs, and other p-values are reported below. Panel (B) vs NT: WT (p>0.9999), LV (p>0.9999), WT + LV (p=0.0171), GS (p=0.0002), WT + GS (p=0.0056) vs WT: LV (p>0.9999), WT + LV (p=0.5596), and WT + GS (p=0.2871); panel (C) vs NT: WT (p>0.9999), LV (p>0.9999), WT + LV (p>0.9999), GS (p>0.9999), WT + GS (p=0.2326) vs WT: LV (p>0.9999), WT + LV (p>0.9999), GS (p>0.9999), and WT + GS (p>0.9999); panel (D) vs NT: WT (p=0.0025), LV (p>0.9999), WT + LV (p=0.0095), GS (p=0.0016), WT + GS (p=0.0007) vs WT: WT + LV (p>0.9999), GS (p>0.9999), and WT + GS (p>0.9999); panel (E) vs NT: WT (p>0.9999), LV (p>0.9999), WT + LV (p=0.0016), GS (p>0.9999), WT + GS (p>0.9999) vs WT: LV (p=0.8377), WT + LV (p=0.0993), GS (p>0.9999), and WT + GS (p>0.9999); panel (F) vs NT: WT (p<0.0001), LV (p>0.9999), WT + LV (p=0.0010), GS (p=0.2394), WT + GS (p=0.0014) vs WT: WT + LV (p=0.9001), and WT + GS (p=0.7680). For these experiments, the isoform corresponding to GenBank AJ505026.1 was used.
Figure 5.
Figure 5.. TRPM3 expression in the human cerebellum.
(A and B) Uniform Manifold Approximation and Projection (UMAP) visualization of human cerebellar nuclei annotated on the basis of marker genes for the developing (A) and adult cerebellum (B). (C and D) The same UMAP visualization of human cerebellar nuclei as panel (A) and (B), now representing the expression of TRPM3 for the developing (C) and adult cerebellum (D), respectively. (E and F) Dot plot showing the expression of one selected marker gene per cell type for the developing (E) and adult cerebellum (F). The size of the dot represents the percentage of nuclei within a cell type in which that marker was detected, and its color represents the average expression level. (G) Dot plot showing the expression of one selected marker gene per region of the rhombic lip (RL). Data set of TRPM3 in developing cerebellum adapted from Aldinger et al., 2021. Data set of TRPM3 in adult cerebellum adapted from Lake et al., 2018.
Figure 5—figure supplement 1.
Figure 5—figure supplement 1.. RNA expression of TRPM3 in humans.
(A) RNA-seq tissue data generated by the Genotype-Tissue Expression (GTEx) project, reported as nTPM (normalized protein-coding transcripts per million), corresponding to mean values of the different individual samples from each tissue. (B) Illustration of human brain RNA expression levels, where darker color represents higher expression patterns. (C) Illustration of the human brain, where each color represents a different brain region. (D) GTEx human brain RNA-seq dataset reported as nTPM. Colors correspond to panel (C). Figures were adapted from the human protein atlas (https://www.proteinatlas.org/).
Figure 5—figure supplement 2.
Figure 5—figure supplement 2.. TRPM3 expression in adult cortex and developing cerebellum.
(A) UMAP visualization of human cortical nuclei annotated on the basis of marker genes. (B) UMAP visualization of human developing cerebellar nuclei annotated on the basis of post conception weeks (PCW). (C and D) The same UMAP visualization of human nuclei as panel (A) and (B), now representing the expression of TRPM3 for the adult cortex (C) and developing cerebellum (D), respectively. (E) Dot plot showing the expression of one selected marker gene per cell type for the adult cortex. The size of the dot represents the percentage of nuclei within a cell type in which that marker was detected, and its color represents the average expression level. Data set of TRPM3 in adult cortex adapted from Velmeshev et al., 2019. Data set of TRPM3 in developing cerebellum adapted from Aldinger et al., 2021.

References

    1. Aldinger KA, Thomson Z, Phelps IG, Haldipur P, Deng M, Timms AE, Hirano M, Santpere G, Roco C, Rosenberg AB, Lorente-Galdos B, Gulden FO, O’Day D, Overman LM, Lisgo SN, Alexandre P, Sestan N, Doherty D, Dobyns WB, Seelig G, Glass IA, Millen KJ. Spatial and cell type transcriptional landscape of human cerebellar development. Nature Neuroscience. 2021;24:1163–1175. doi: 10.1038/s41593-021-00872-y. - DOI - PMC - PubMed
    1. Badheka D, Yudin Y, Borbiro I, Hartle CM, Yazici A, Mirshahi T, Rohacs T. Inhibition of transient receptor potential melastatin 3 ion channels by G-protein βγ subunits. eLife. 2017;6:e26147. doi: 10.7554/eLife.26147. - DOI - PMC - PubMed
    1. Behrendt M, Gruss F, Enzeroth R, Dembla S, Zhao S, Crassous PA, Mohr F, Nys M, Louros N, Gallardo R, Zorzini V, Wagner D, Economou A, Rousseau F, Schymkowitz J, Philipp SE, Rohacs T, Ulens C, Oberwinkler J. The structural basis for an on-off switch controlling Gβγ-mediated inhibition of TRPM3 channels. PNAS. 2020;117:29090–29100. doi: 10.1073/pnas.2001177117. - DOI - PMC - PubMed
    1. Dembla S, Behrendt M, Mohr F, Goecke C, Sondermann J, Schneider FM, Schmidt M, Stab J, Enzeroth R, Leitner MG, Nuñez-Badinez P, Schwenk J, Nürnberg B, Cohen A, Philipp SE, Greffrath W, Bünemann M, Oliver D, Zakharian E, Schmidt M, Oberwinkler J. Anti-Nociceptive action of peripheral mu-opioid receptors by G-beta-gamma protein-mediated inhibition of TRPM3 channels. eLife. 2017;6:e26280. doi: 10.7554/eLife.26280. - DOI - PMC - PubMed
    1. de Sainte Agathe JM, Van-Gils J, Lasseaux E, Arveiler B, Lacombe D, Pfirrmann C, Raclet V, Gaston L, Plaisant C, Aupy J, Trimouille A. Confirmation and expansion of the phenotype associated with the recurrent p.val837met variant in TRPM3. European Journal of Medical Genetics. 2020;63:103942. doi: 10.1016/j.ejmg.2020.103942. - DOI - PubMed

Publication types