

Overtriage, Undertriage, and Value of Care after Major Surgery: An Automated, Explainable Deep Learning-Enabled Classification System
- PMID: 36648256
- PMCID: PMC9993068
- DOI: 10.1097/XCS.0000000000000471
Overtriage, Undertriage, and Value of Care after Major Surgery: An Automated, Explainable Deep Learning-Enabled Classification System
Abstract
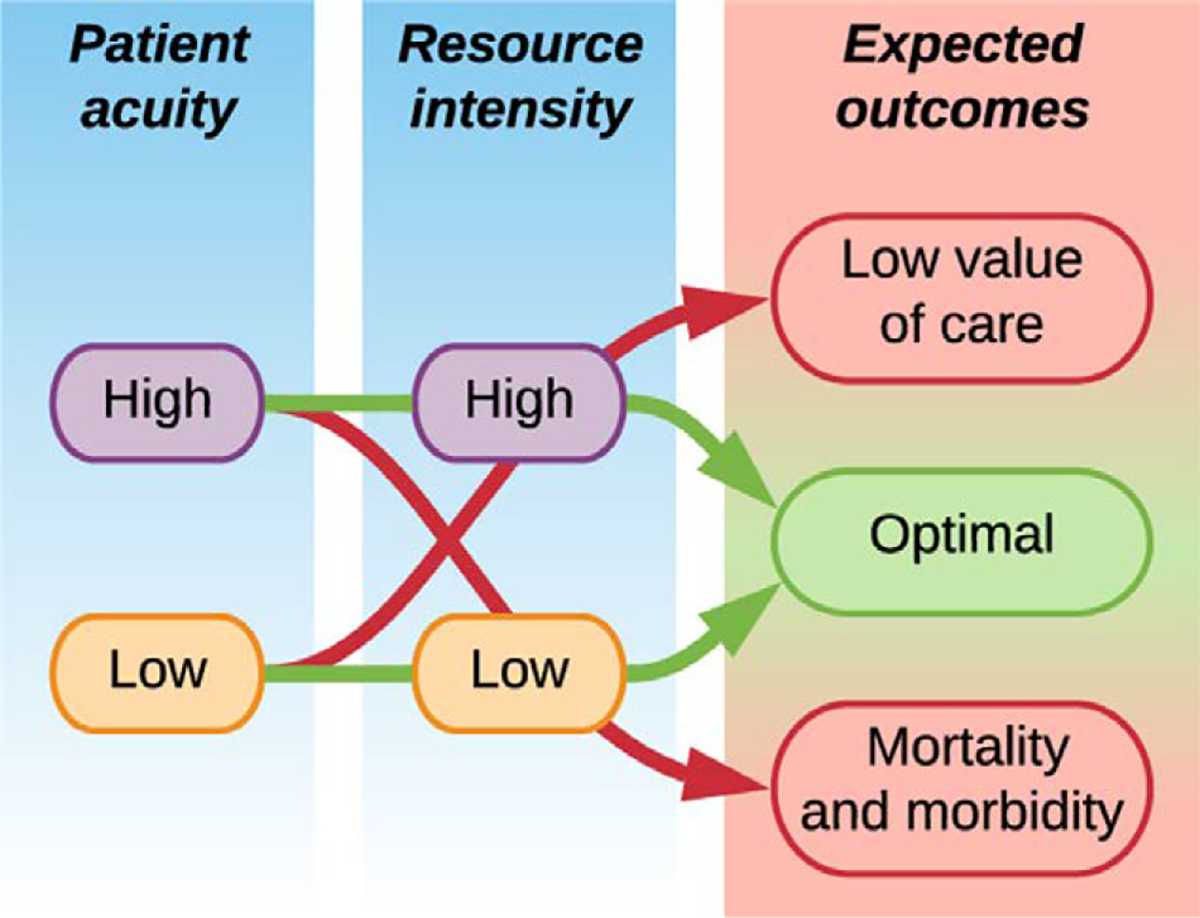
Background: In single-institution studies, overtriaging low-risk postoperative patients to ICUs has been associated with a low value of care; undertriaging high-risk postoperative patients to general wards has been associated with increased mortality and morbidity. This study tested the reproducibility of an automated postoperative triage classification system to generating an actionable, explainable decision support system.
Study design: This longitudinal cohort study included adults undergoing inpatient surgery at two university hospitals. Triage classifications were generated by an explainable deep learning model using preoperative and intraoperative electronic health record features. Nearest neighbor algorithms identified risk-matched controls. Primary outcomes were mortality, morbidity, and value of care (inverted risk-adjusted mortality/total direct costs).
Results: Among 4,669 ICU admissions, 237 (5.1%) were overtriaged. Compared with 1,021 control ward admissions, overtriaged admissions had similar outcomes but higher costs ($15.9K [interquartile range $9.8K to $22.3K] vs $10.7K [$7.0K to $17.6K], p < 0.001) and lower value of care (0.2 [0.1 to 0.3] vs 1.5 [0.9 to 2.2], p < 0.001). Among 8,594 ward admissions, 1,029 (12.0%) were undertriaged. Compared with 2,498 control ICU admissions, undertriaged admissions had longer hospital length-of-stays (6.4 [3.4 to 12.4] vs 5.4 [2.6 to 10.4] days, p < 0.001); greater incidence of hospital mortality (1.7% vs 0.7%, p = 0.03), cardiac arrest (1.4% vs 0.5%, p = 0.04), and persistent acute kidney injury without renal recovery (5.2% vs 2.8%, p = 0.002); similar costs ($21.8K [$13.3K to $34.9K] vs $21.9K [$13.1K to $36.3K]); and lower value of care (0.8 [0.5 to 1.3] vs 1.2 [0.7 to 2.0], p < 0.001).
Conclusions: Overtriage was associated with low value of care; undertriage was associated with both low value of care and increased mortality and morbidity. The proposed framework for generating automated postoperative triage classifications is reproducible.
Copyright © 2022 by the American College of Surgeons. Published by Wolters Kluwer Health, Inc. All rights reserved.
Conflict of interest statement
Disclosure Information: Nothing to disclose.
Figures


Comment in
-
Invited Commentary: Postoperative Artificial Intelligence Model for ICU Triage.J Am Coll Surg. 2023 Feb 1;236(2):292-293. doi: 10.1097/XCS.0000000000000487. Epub 2022 Nov 17. J Am Coll Surg. 2023. PMID: 36395417 No abstract available.
-
Hybrid Model for Postoperative Triage Decisions.J Am Coll Surg. 2023 Jun 1;236(6):1266-1267. doi: 10.1097/XCS.0000000000000663. Epub 2023 Feb 17. J Am Coll Surg. 2023. PMID: 36799497 No abstract available.
References
MeSH terms
Grants and funding
LinkOut - more resources
Full Text Sources
