. 2023 Jan 17:12:e81525.
doi: 10.7554/eLife.81525.

Spatially resolved transcriptomics reveals pro-inflammatory fibroblast involved in lymphocyte recruitment through CXCL8 and CXCL10

Affiliations

Spatially resolved transcriptomics reveals pro-inflammatory fibroblast involved in lymphocyte recruitment through CXCL8 and CXCL10

Ana J Caetano et al. Elife. .

Abstract

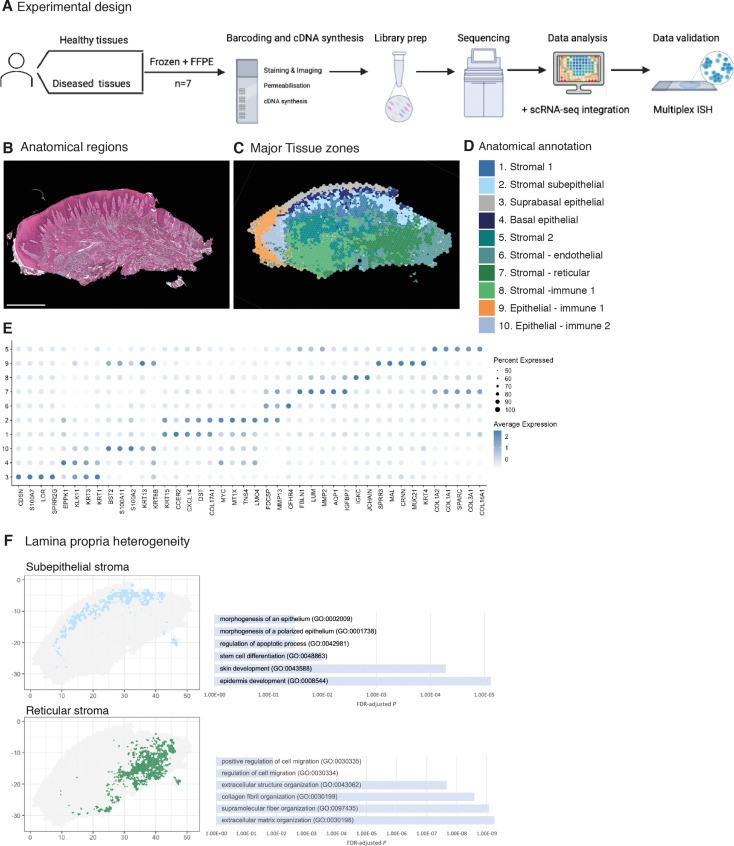
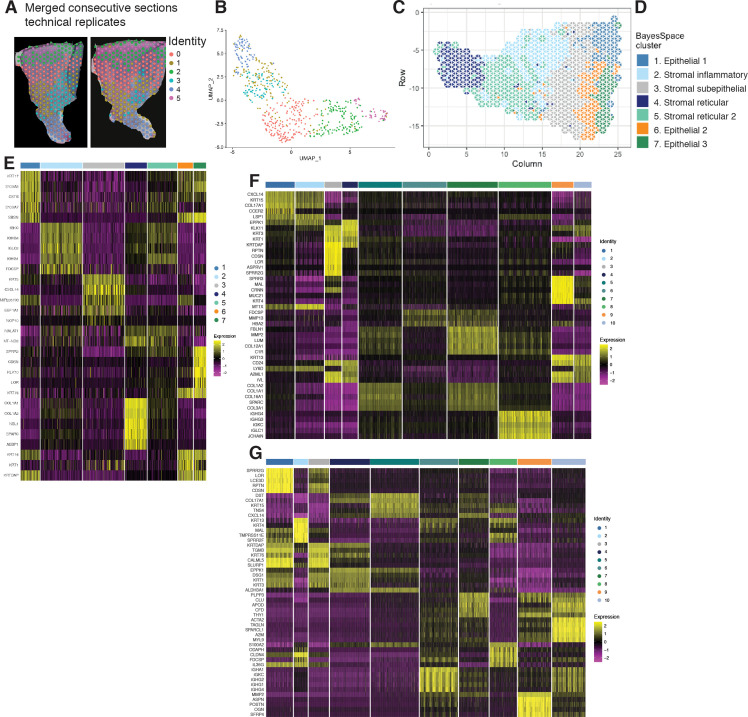
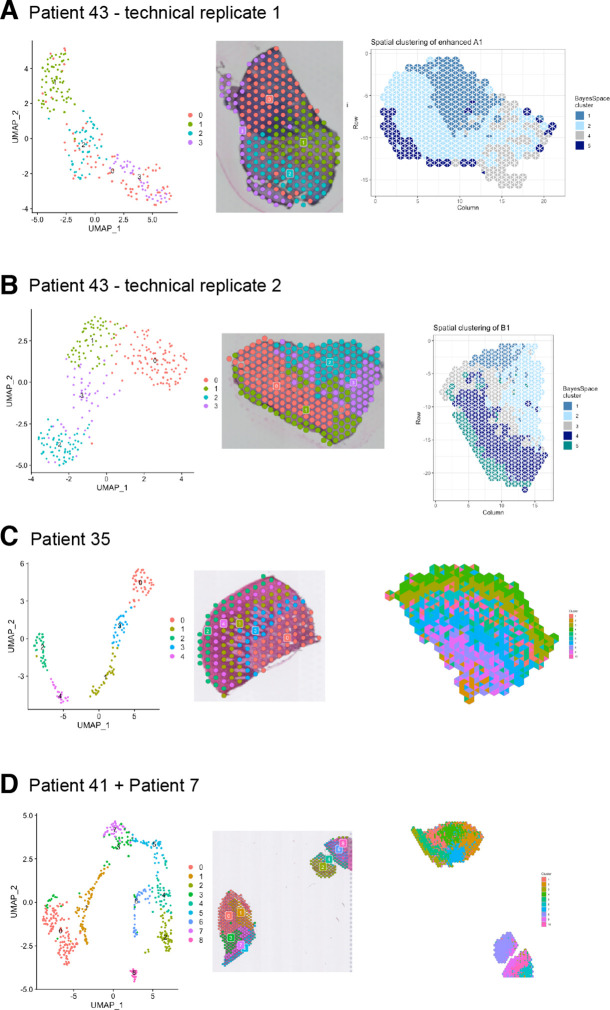
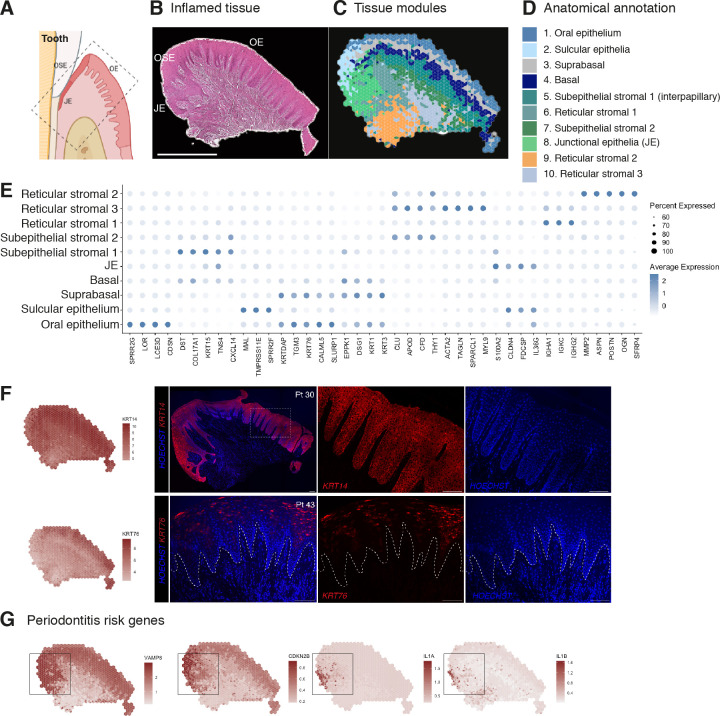
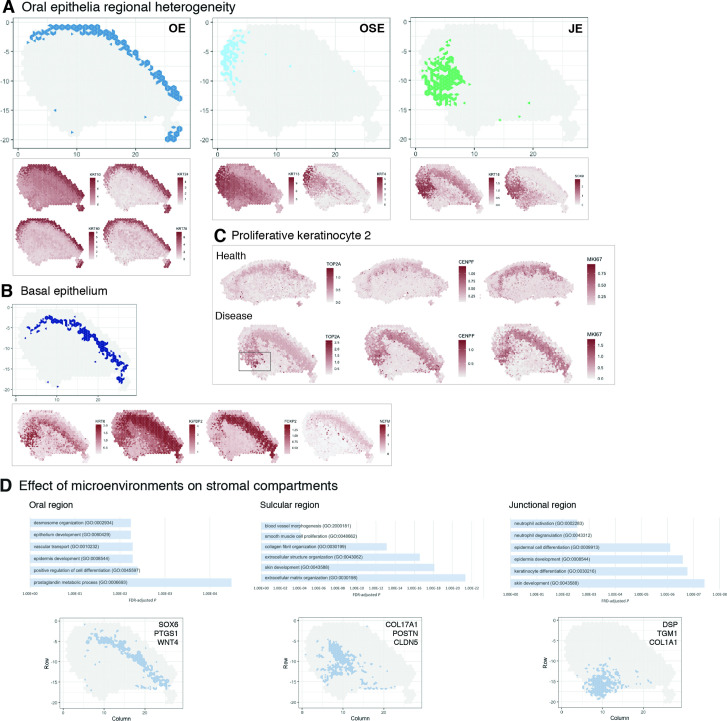
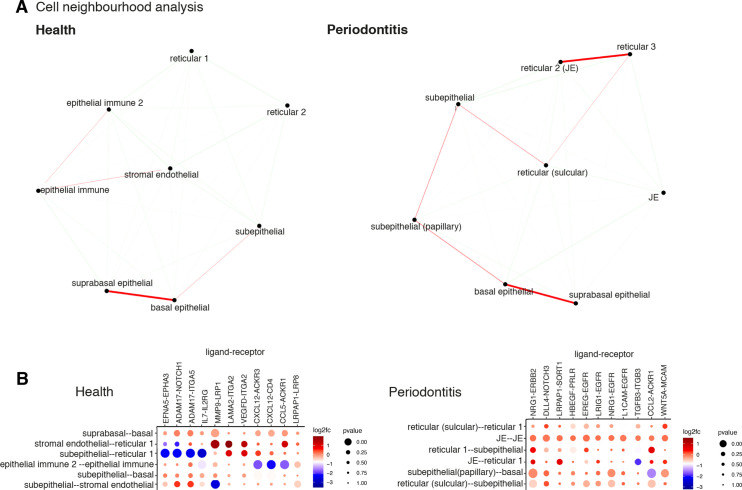
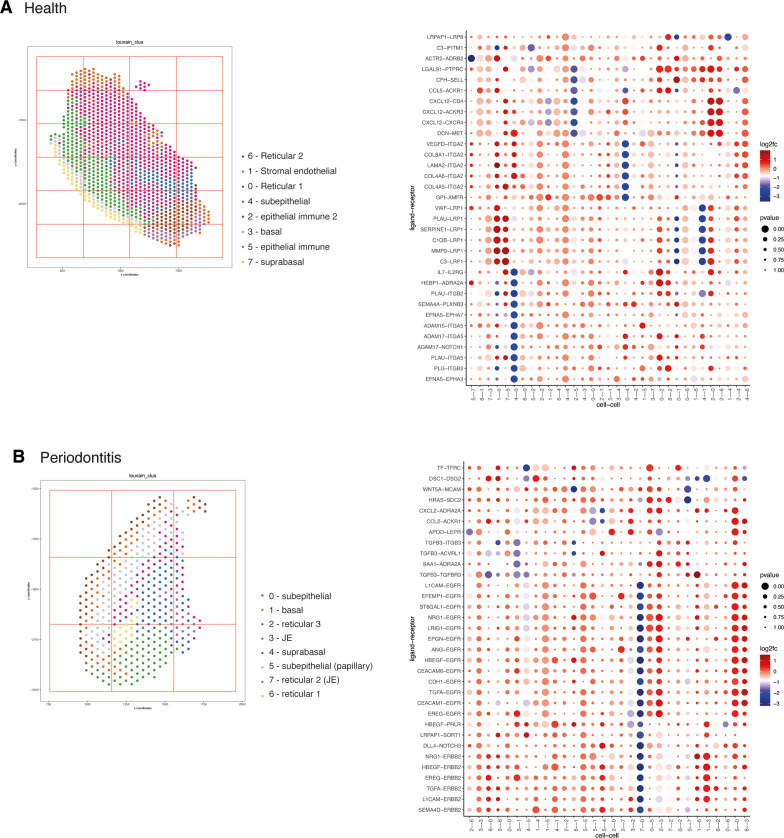
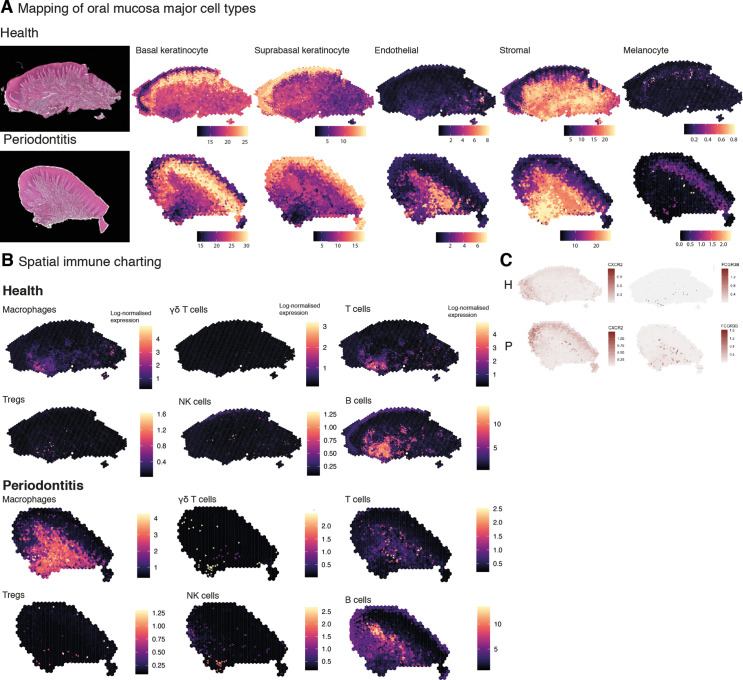
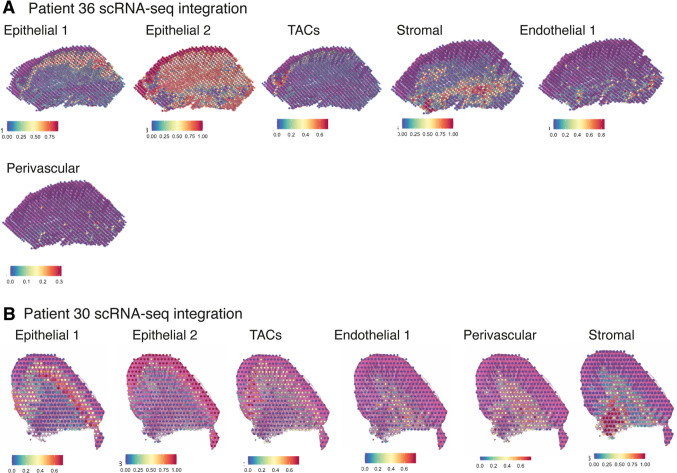
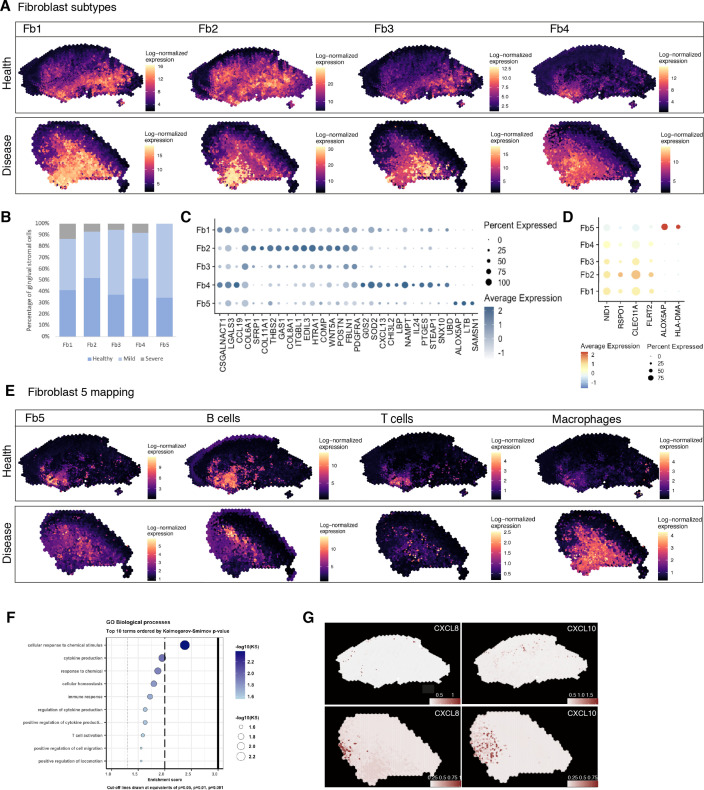
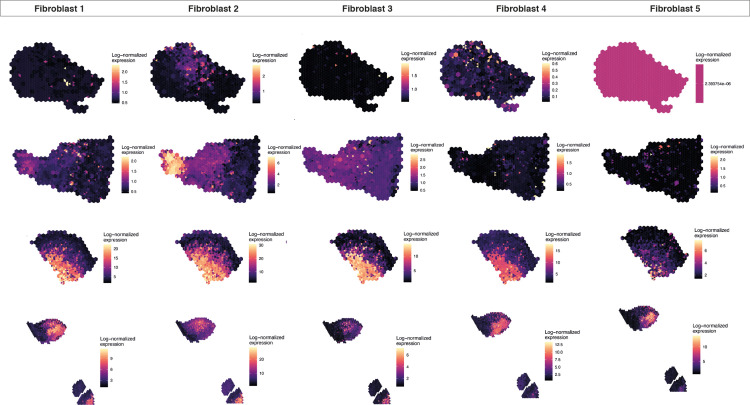
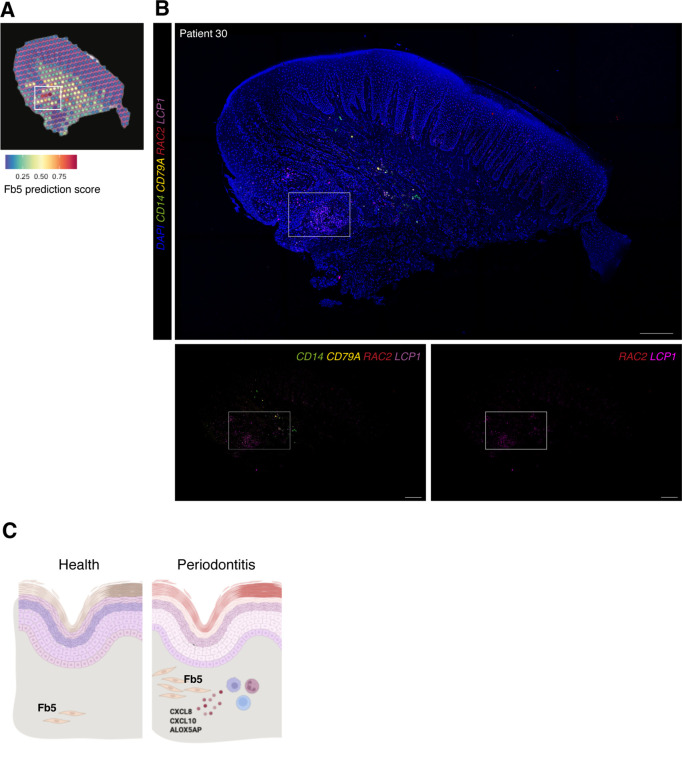
The interplay among different cells in a tissue is essential for maintaining homeostasis. Although disease states have been traditionally attributed to individual cell types, increasing evidence and new therapeutic options have demonstrated the primary role of multicellular functions to understand health and disease, opening new avenues to understand pathogenesis and develop new treatment strategies. We recently described the cellular composition and dynamics of the human oral mucosa; however, the spatial arrangement of cells is needed to better understand a morphologically complex tissue. Here, we link single-cell RNA sequencing, spatial transcriptomics, and high-resolution multiplex fluorescence in situ hybridisation to characterise human oral mucosa in health and oral chronic inflammatory disease. We deconvolved expression for resolution enhancement of spatial transcriptomic data and defined highly specialised epithelial and stromal compartments describing location-specific immune programs. Furthermore, we spatially mapped a rare pathogenic fibroblast population localised in a highly immunogenic region, responsible for lymphocyte recruitment through CXCL8 and CXCL10 and with a possible role in pathological angiogenesis through ALOX5AP. Collectively, our study provides a comprehensive reference for the study of oral chronic disease pathogenesis.

Keywords: cell biology; fibroblast; gingiva; human; immunology; inflammation; oral mucosa; periodontal disease; spatial genomics.


Conflict of interest statement

AC, YR, FK, PD, SK, RN, AV, LN, VB, PS No competing interests declared, ED is an employee of Unilever Plc. The authors state no conflict of interest

Figures

Figure 1.
Figure 1.. Spatial map of the human oral mucosa.
(A) Overview of study design for human oral mucosa. A total of nine tissue sections from seven distinct patients were sequenced and analysed. (B) Haematoxylin and eosin (H&E) image of a representative healthy oral mucosa section demonstrating general tissue morphology and demarcation between the two major tissue compartments, epithelium and connective tissue. Scale bar: 1 mm. (C) Human oral mucosa regions present in the assayed section. (D) Anatomical annotation of unbiased transcriptional tissue regions. (E) Markers of tissue compartment-specific genes used for tissue annotation showing percent of expressing cells (circle size) and average expression (colour) of gene markers (rows) across compartments (columns). (F) Connective tissue (lamina propria) heterogeneity Gene Ontology (GO) analyses showing subepithelial region enrichment for epithelium development and deep reticular region enriched for extracellular matrix (ECM) terms.
Figure 1—figure supplement 1.
Figure 1—figure supplement 1.. Mapping of palatal human oral mucosa and top differentially expressed genes.
(A) Consecutive sections used as technical replicates for ST analyses. (B) UMAP plot of spot transcriptome clusters from the two merged sections. (C) High-resolution clustering of the same assayed patient sample (palatal). (D) Anatomical annotation. (E) Heatmap of the mean expression of the most differentially expressed marker genes for each cluster identified in (A). (F) Heatmap of the mean expression of the most differentially expressed marker genes for each cluster identified related to Figure 1B–E. (G) Heatmap of the mean expression of the most differentially expressed marker genes for each cluster identified related to Figure 2B–E.
Figure 1—figure supplement 2.
Figure 1—figure supplement 2.. Biological and technical replicates used for ST analyses.
(A) UMAP plot of spot transcriptome clusters from patient 43 (health) on the left; clusters are visualised on tissue covered slide areas (centre). High-resolution clustering at subspot level on the right. (B) UMAP plot of spot transcriptome clusters from patient 43 technical replicate (health) on the left; clusters are visualised on tissue covered slide areas (centre). High-resolution clustering at subspot level on the right. (C) UMAP plot of spot transcriptome clusters from patient 35 (disease) on the left; clusters are visualised on tissue-covered slide areas (centre). High-resolution clustering at subspot level on the right. (D) UMAP plot of spot transcriptome clusters from patients 41 and 7 (disease) on the left; clusters are visualised on tissue-covered slide areas (centre). High-resolution clustering at subspot level on the right.
Figure 2.
Figure 2.. Human oral mucosa structure in oral chronic inflammatory disease.
(A) Schematic illustration of the human oral mucosa showing the different epithelial regions, oral epithelium (OE), oral sulcular epithelium (OSE), and junctional epithelium (JE). Created with Biorender. (B) H&E image of the representative inflamed oral mucosa section demonstrating demarcation between the distinct epithelia, and connective tissue region. (C) Human oral mucosa regions present in the assayed section using BayesSpace. (D) Anatomical annotation of unbiased transcriptional tissue regions. (E) Markers of tissue compartment differentially expressed genes used for tissue annotation showing percent of expressing cells (circle size) and average expression (colour) of gene markers (rows) across compartments (columns). (F) Immunofluorescence image validation stained for KRT14 and KRT76 (representative image, n = 3 samples). Scale bars: 100 µm. (G) Mapping of periodontitis risk genes showing VAMP8, CDKN2B, IL1A, and IL1B restricted expression in the junctional epithelium region.
Figure 3.
Figure 3.. Characterisation of the human oral mucosa epithelium.
(A) Spatial feature plots showing expression of distinct keratins that define each oral epithelia region. (B) Characterisation of the proliferative basal epithelial layer showing top differentially expressed genes, KRT8, IGFBP2, FOXP2, NEFM. (C) Mapping of a rare proliferative epithelial population increased in oral chronic inflammatory disease defined by expression of TOP2A and CENPF. MIKI67 expression showing increased expression in disease (representative images, n = 7). (D) The top GO terms associated with the differentially expressed genes in three distinct stromal regions associated with the three distinct oral epithelia; FDR, false discovery rate.
Figure 4.
Figure 4.. Cell neighbourhood analyses in health and disease.
(A) Network representation of the pairwise interacting regions identified by Giotto Analyzer (Dries et al., 2021), whereby it evaluates the enrichment of the frequency that each pair of regions is proximal to each other. Enriched interactions are depicted in red. We observed strongest interactions within epithelial layers in health, whereas in disease stromal regions interactions emerge. (B) Dotplot for ligand–receptor pairs that exhibit differential cell–cell communication scores due to spatial cell–cell interactions. The size of the dot is correlated with the adjusted p value, and the colour indicates increased (red) or decreased (blue) activity.
Figure 4—figure supplement 1.
Figure 4—figure supplement 1.. Cell neighbourhood communication analyses.
(A) Spatial plot with annotated tissue regions (left) and dotplot for ligand–receptor pairs that exhibit differential cell–cell communication scores due to spatial cell–cell interactions (left) for patient 36. (B) Spatial plot with annotated tissue regions (left) and dotplot for ligand–receptor pairs that exhibit differential cell–cell communication scores due to spatial cell–cell interactions (left) for patient 30.
Figure 5.
Figure 5.. Mapping of oral mucosa major cell types across conditions.
(A) Spatial expression of genes encoding for main human oral mucosa cell types. We selected the top differentially expressed genes for each cell type and predicted their expression at subspot resolution xgboost in BayesSpace. H&E staining shown here for clarity. (B) Spatial mapping of immune cell types showing overall increase in disease. (C) Neutrophils mapping using expression of CXCR2 and FCGR3B.
Figure 5—figure supplement 1.
Figure 5—figure supplement 1.. Validation of ST method by comparison of human oral mucosa tissue spots with histological landmarks and integration analyses with single-cell RNA sequencing cell type annotations.
(A) Probabilistic classification for epithelial, stromal, endothelial, and perivascular scRNA-sequencing derived classes for patient 36 (health). (B) Probabilistic classification for epithelial, stromal, endothelial, and perivascular scRNA-sequencing derived classes for patient 30 (disease).
Figure 5—figure supplement 2.
Figure 5—figure supplement 2.. Cell type mapping for all biological/technical replicates used in ST analyses.
Spatial expression of genes encoding for main human oral mucosa cell types. We selected the top differentially expressed genes for each cell type and predicted their expression at subspot resolution xgboost in BayesSpace.
Figure 6.
Figure 6.. Spatial identification of regional fibroblast subtypes.
(A) Human oral mucosa fibroblast spatial mapping in health and disease. We used the top differentially expressed genes for each cell type and predicted their expression with BayesSpace. (B) Percentage of selected fibroblast abundance changes across conditions shown as a bar plot from single-cell RNA sequencing data. (C) Dotplot showing markers of fibroblast differentially expressed genes showing percent of expressing cells (circle size) and average expression (colour) of gene markers (rows) across cells (columns). (D) Dotplot showing top predicted ligands expressed by fibroblast types predicted to modulate the epithelial basal layer. (E) Fibroblast 5 spatial mapping and co-localisation with immune cell types, B cells, T cells, and macrophages. (F) Gene Ontology biological process term enrichment plot for fibroblast 5. Cluster markers were obtained using the non-parametric two-sided Wilcoxon rank-sum test in Seurat. Gene enrichment analysis was performed with the topGO package in R using the Kolmogorov–Smirnov statistical test. (G) Representative spatial mapping of CXCL8 and CXCL10 in health and disease showing co-localisation in fibroblast 5 region and increase in disease.
Figure 6—figure supplement 1.
Figure 6—figure supplement 1.. Fibroblast mapping for all biological/technical replicates used in ST analyses.
Human oral mucosa fibroblast spatial mapping. We used the top differentially expressed genes for each cell type and predicted their expression with BayesSpace.
Figure 7.
Figure 7.. In vivo validation of fibroblast 5 co-localisation with immune cells.
(A) Single-cell RNA sequencing integration with spatial data using ‘anchor’-based integration workflow in Seurat to enable a prediction score for each spot for fibroblast 5. Based on this prediction score, fibroblast 5 is confirmed spatially restricted. (B) Multiplex mRNA in situ hybridisation of a representative section of human oral mucosa using specific probes against RAC2 and LCP1 (fibroblast 5 markers), CD14 (macrophages), and CD79A (B cells) to validate in vivo localisation of fibroblast 5 and immune cell populations. Scale bars: 250 µm. (C) Schematic illustration of our proposed model summarising pathogenic fibroblast population role in human oral chronic disease. Created with Biorender.

References

    1. Alexa A, Rahnenfuhrer J. TopGO: enrichment analysis for gene ontology. 2.50.0R Package. 2022 https://bioconductor.org/packages/release/bioc/html/topGO.html
    1. Bahar Halpern K, Massalha H, Zwick RK, Moor AE, Castillo-Azofeifa D, Rozenberg M, Farack L, Egozi A, Miller DR, Averbukh I, Harnik Y, Weinberg-Corem N, de Sauvage FJ, Amit I, Klein OD, Shoshkes-Carmel M, Itzkovitz S. Lgr5+ telocytes are a signaling source at the intestinal villus tip. Nature Communications. 2020;11:1936. doi: 10.1038/s41467-020-15714-x. - DOI - PMC - PubMed
    1. Bonnans C, Chou J, Werb Z. Remodelling the extracellular matrix in development and disease. Nature Reviews. Molecular Cell Biology. 2014;15:786–801. doi: 10.1038/nrm3904. - DOI - PMC - PubMed
    1. Browaeys R, Saelens W, Saeys Y. NicheNet: modeling intercellular communication by linking ligands to target genes. Nature Methods. 2020;17:159–162. doi: 10.1038/s41592-019-0667-5. - DOI - PubMed
    1. Butler A, Hoffman P, Smibert P, Papalexi E, Satija R. Integrating single-cell transcriptomic data across different conditions, technologies, and species. Nature Biotechnology. 2018;36:411–420. doi: 10.1038/nbt.4096. - DOI - PMC - PubMed

Publication types

Associated data