Randomized Controlled Trial
. 2023 Jan 3;6(1):e2250681.
doi: 10.1001/jamanetworkopen.2022.50681.

Association of Body Weight With Response to Vitamin D Supplementation and Metabolism

Affiliations
Randomized Controlled Trial

Association of Body Weight With Response to Vitamin D Supplementation and Metabolism

Deirdre K Tobias et al. JAMA Netw Open. .

Abstract

Importance: In the Vitamin D and Omega-3 Trial (VITAL), the effects of randomized vitamin D supplementation (cholecalciferol), 2000 IU/d, reduced the risk of several health outcomes among participants with normal, but not elevated, body weights. It was unclear whether weight had any association with the outcomes of the supplementation.

Objective: To investigate whether baseline body mass index (BMI) modifies vitamin D metabolism and response to supplementation.

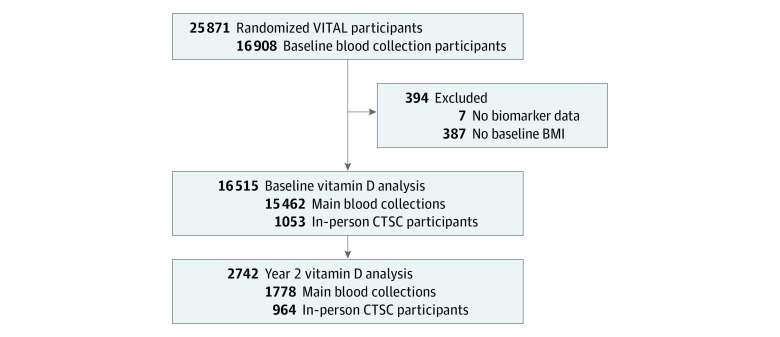
Design, setting, and participants: VITAL is a completed randomized, double-blind, placebo-controlled trial for the primary prevention of cancer and cardiovascular disease. In the present cohort study, an analysis was conducted in a subset of VITAL participants who provided a blood sample at baseline and a subset with a repeated sample at 2 years' follow-up. VITAL was conducted from July 1, 2010, to November 10, 2018; data analysis for the present study was conducted from August 1, 2021, to November 9, 2021.

Interventions: Treatment outcomes of vitamin D, 2000 IU/d, supplementation vs placebo associated with clinical and novel vitamin D-related biomarkers by BMI category adjusted for other factors associated with vitamin D status.

Main outcomes and measures: Multivariable-adjusted means (SE) or 95% CIs of vitamin D-related serum biomarkers at baseline and follow-up: total 25-hydroxyvitamin D (25-OHD), 25-OHD3, free vitamin D (FVD), bioavailable vitamin D (BioD), vitamin D-binding protein (VDBP), albumin, parathyroid hormone (PTH), and calcium, and log-transformed as needed.

Results: A total of 16 515 participants (mean [SD] age, 67.7 [7.0] years; 8371 women [50.7%]; 12420 non-Hispanic White [76.9%]) were analyzed at baseline, including 2742 with a follow-up blood sample. Before randomization, serum total 25-OHD levels were incrementally lower at higher BMI categories (adjusted mean [SE]: underweight, 32.3 [0.7] ng/mL; normal weight, 32.3 [0.1] ng/mL; overweight, 30.5 [0.1] ng/mL; obesity class I, 29.0 [0.2] ng/mL; and obesity class II, 28.0 [0.2] ng/mL; P < .001 for linear trend). Similarly, baseline 25-OHD3, FVD, BioD, VDBP, albumin, and calcium levels were lower with higher BMI, while PTH level was higher (all P < .001 for linear trend). Compared with placebo, randomization to vitamin D supplementation was associated with an increase in total 25-OHD, 25-OHD3, FVD, and BioD levels compared with placebo at 2 years' follow-up, but increases were significantly lower at higher BMI categories (all treatment effect interactions P < .001). Supplementation did not substantially change VDBP, albumin, PTH, or calcium levels.

Conclusions and relevance: In this randomized cohort study, vitamin D supplementation increased serum vitamin D-related biomarkers, with a blunted response observed for participants with overweight or obesity at baseline. These longitudinal findings suggest that BMI may be associated with modified response to vitamin D supplementation and may in part explain the observed diminished outcomes of supplementation for various health outcomes among individuals with higher BMI.


Conflict of interest statement

Conflict of Interest Disclosures: Dr Mora reported receiving grant R01HL134811 from the National Institutes of Health (NIH) National Heart, Blood, and Lung Institute and nonfinancial support in the form of laboratory measurements from Quest Diagnostics Study during the conduct of the study; personal fees from Pfizer outside the submitted work. Dr Danik reported receiving grants from the American Heart Association during the conduct of the study. Dr Cook reported receiving grants from the NIH to the institution during the conduct of the study. Dr Lee reported receiving grants the NIH during the conduct of the study. Dr Buring reported receiving grants from the NIH during the conduct of the study, and her spouse was on the scientific advisory board of Pharmavite, which provided vitamin D and placebo. Dr Manson reported receiving grants from the NIH during the conduct of the study and grants from the NIH and Mars Edge outside the submitted work. No other disclosures were reported.

Figures

Figure 1.
Figure 1.. Flowchart Diagram of Eligible Vitamin D and Omega-3 Trial (VITAL) Participants Included in Analyses
BMI indicates body mass index; CTSC, Clinical and Translational Science Center.
Figure 2.
Figure 2.. Multivariable-Adjusted Mean Vitamin D–Related Biomarker Concentrations at Baseline and 2 Years’ Follow-up, by Randomized Treatment Assignment and Baseline Body Mass Index (BMI)
Concentrations shown for total 25-hydroxyvitamin D (25-OHD) (A), 25-OHD3 (B), free vitamin D (C), bioavailable vitamin D (D), vitamin D–binding protein (E), albumin (F), parathyroid hormone (PTH) (G), and calcium (H). Circles and bars are least square mean (standard error of the mean) or geometric mean (95% CI) adjusted for baseline factors: age (continuous), sex (male, female), prevalence of type 2 diabetes, preintervention vitamin D supplement use, smoking status (never, past, current, not reported), total physical activity (above, below median = 16.6 metabolic equivalents of task hours per week), race and ethnicity (Asian or Pacific Islander, Black, Native American or Alaska Native, non-Black Hispanic, non-Hispanic White, other/unknown, not reported), geographic region (West, South, Midwest, Northeast), season of blood draw (winter, spring, summer, fall), and in-person Clinical and Translational Science Center subgroup participation. BMI indicates body mass index. To convert albumin to grams per liter, multiply by 10; calcium to millimoles per liter, multiply by 0.25; 25-OHD to nanomoles per liter, multiply by 2.496; PTHe to nanograms per liter, multiply by 1.

Comment in

References

    1. Yin L, Ordóñez-Mena JM, Chen T, Schöttker B, Arndt V, Brenner H. Circulating 25-hydroxyvitamin D serum concentration and total cancer incidence and mortality: a systematic review and meta-analysis. Prev Med. 2013;57(6):753-764. doi:10.1016/j.ypmed.2013.08.026 - DOI - PubMed
    1. Zhang R, Li B, Gao X, et al. . Serum 25-hydroxyvitamin D and the risk of cardiovascular disease: dose-response meta-analysis of prospective studies. Am J Clin Nutr. 2017;105(4):810-819. doi:10.3945/ajcn.116.140392 - DOI - PubMed
    1. Manson JE, Cook NR, Lee IM, et al. ; VITAL Research Group . Vitamin D supplements and prevention of cancer and cardiovascular disease. N Engl J Med. 2019;380(1):33-44. doi:10.1056/NEJMoa1809944 - DOI - PMC - PubMed
    1. Keum N, Lee DH, Greenwood DC, Manson JE, Giovannucci E. Vitamin D supplementation and total cancer incidence and mortality: a meta-analysis of randomized controlled trials. Ann Oncol. 2019;30(5):733-743. doi:10.1093/annonc/mdz059 - DOI - PMC - PubMed
    1. Barbarawi M, Kheiri B, Zayed Y, et al. . Vitamin D supplementation and cardiovascular disease risks in more than 83 000 individuals in 21 randomized clinical trials: a meta-analysis. JAMA Cardiol. 2019;4(8):765-776. doi:10.1001/jamacardio.2019.1870 - DOI - PMC - PubMed

Publication types