. 2023 Feb 22;8(4):e162498.
doi: 10.1172/jci.insight.162498.

TFEB-mediated lysosomal exocytosis alleviates high-fat diet-induced lipotoxicity in the kidney

Affiliations

TFEB-mediated lysosomal exocytosis alleviates high-fat diet-induced lipotoxicity in the kidney

Jun Nakamura et al. JCI Insight. .

Abstract

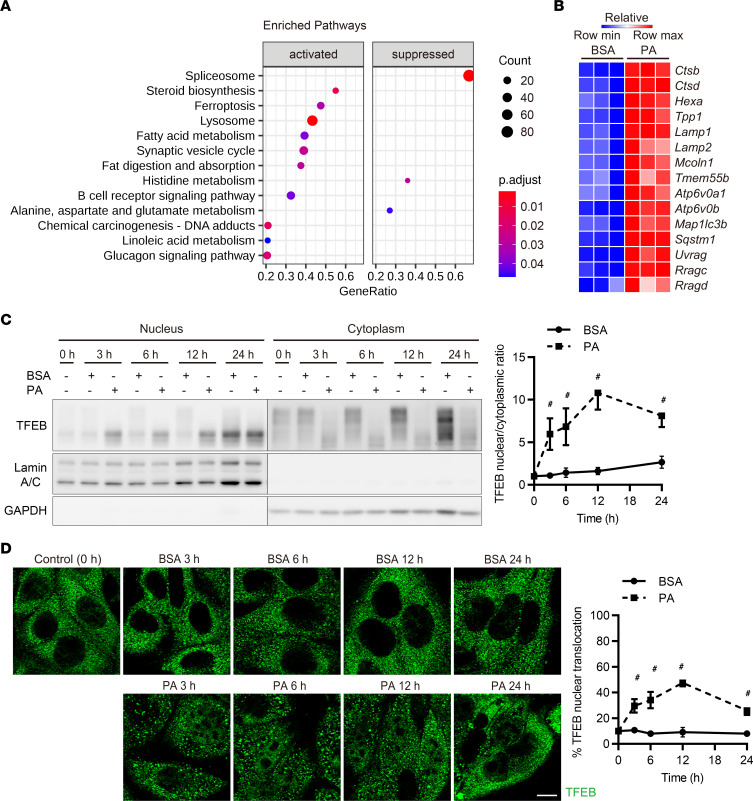
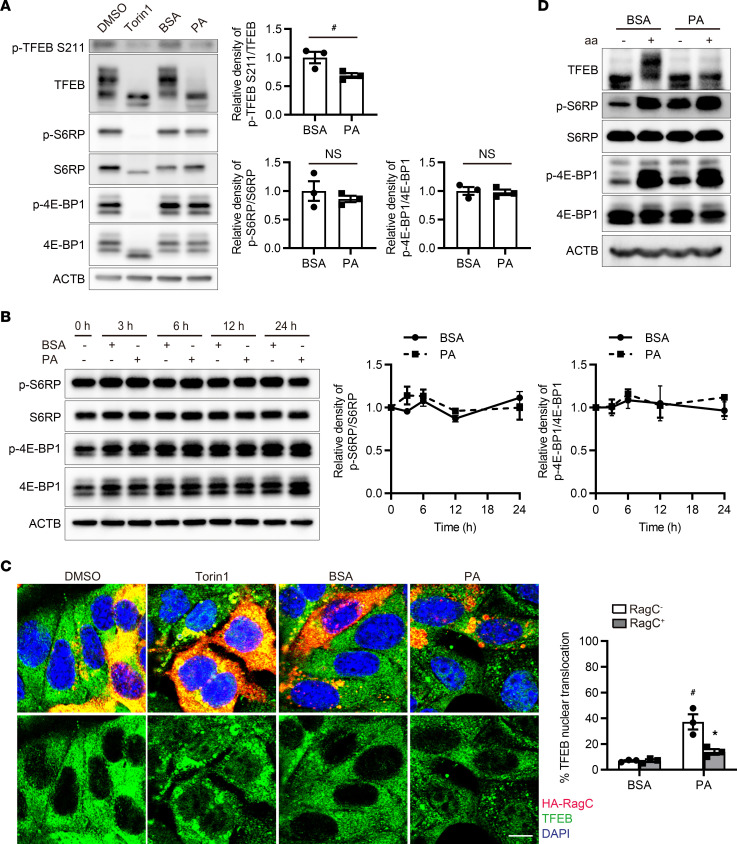
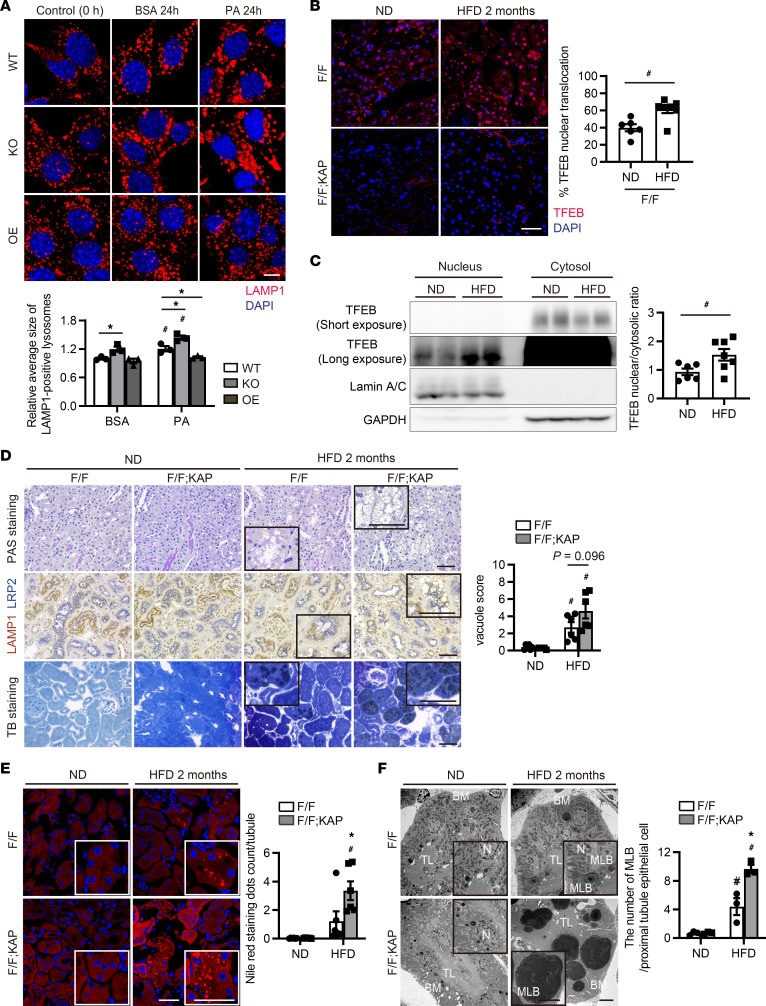
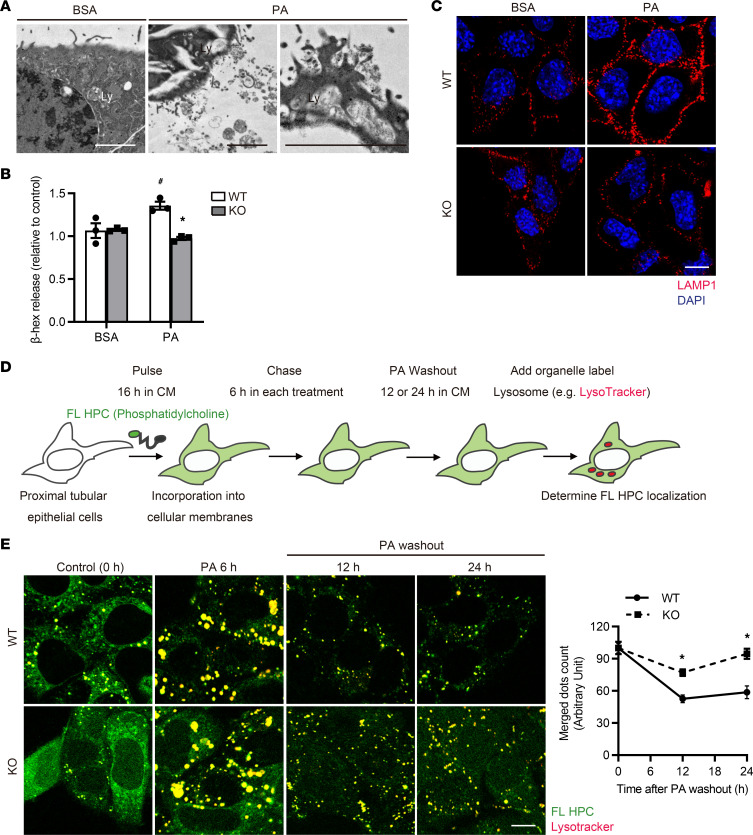
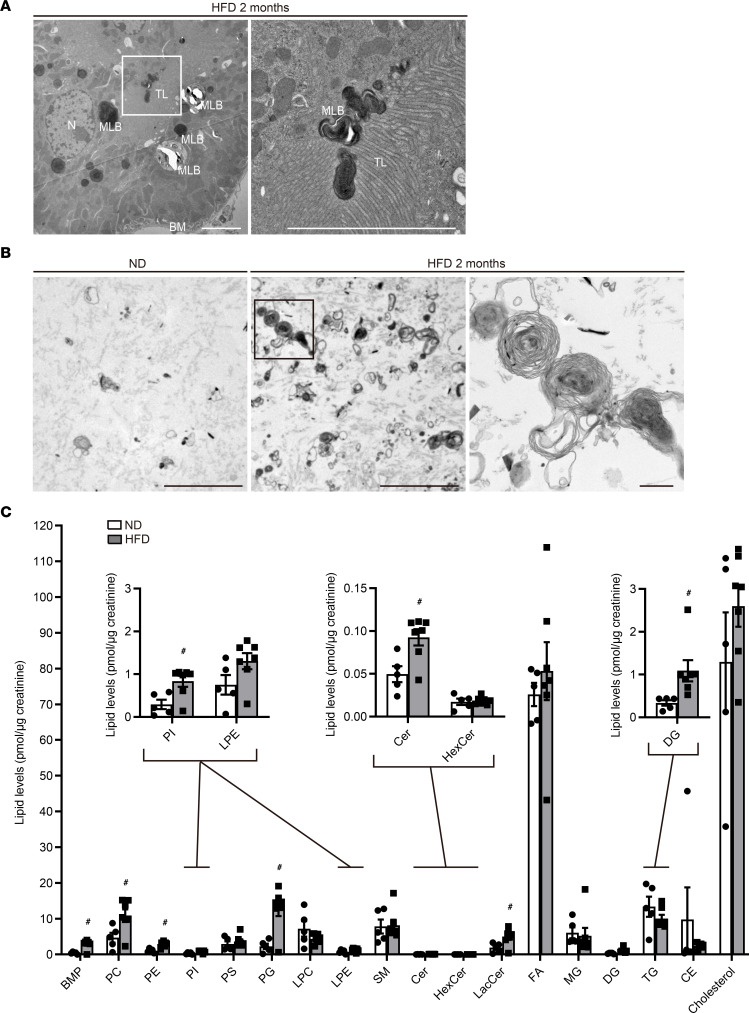
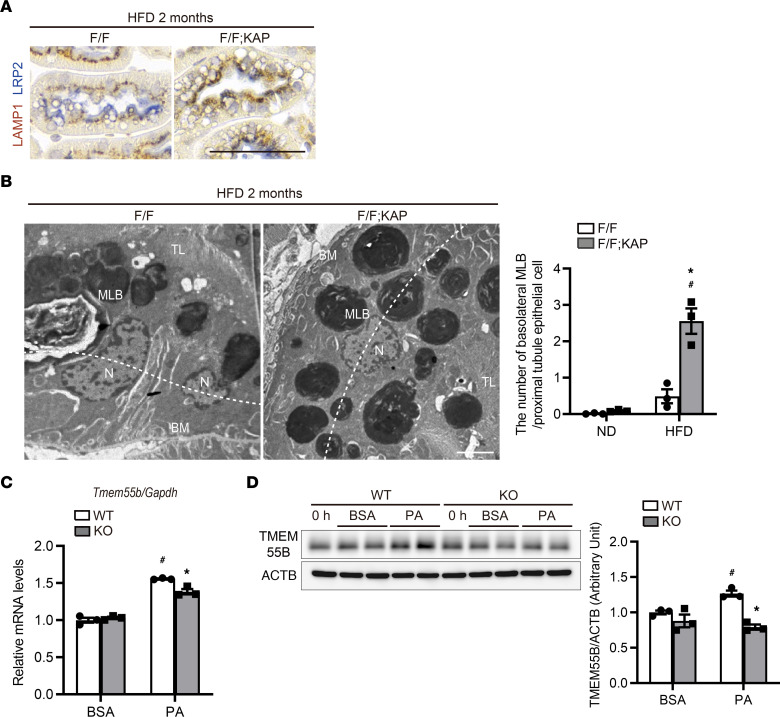
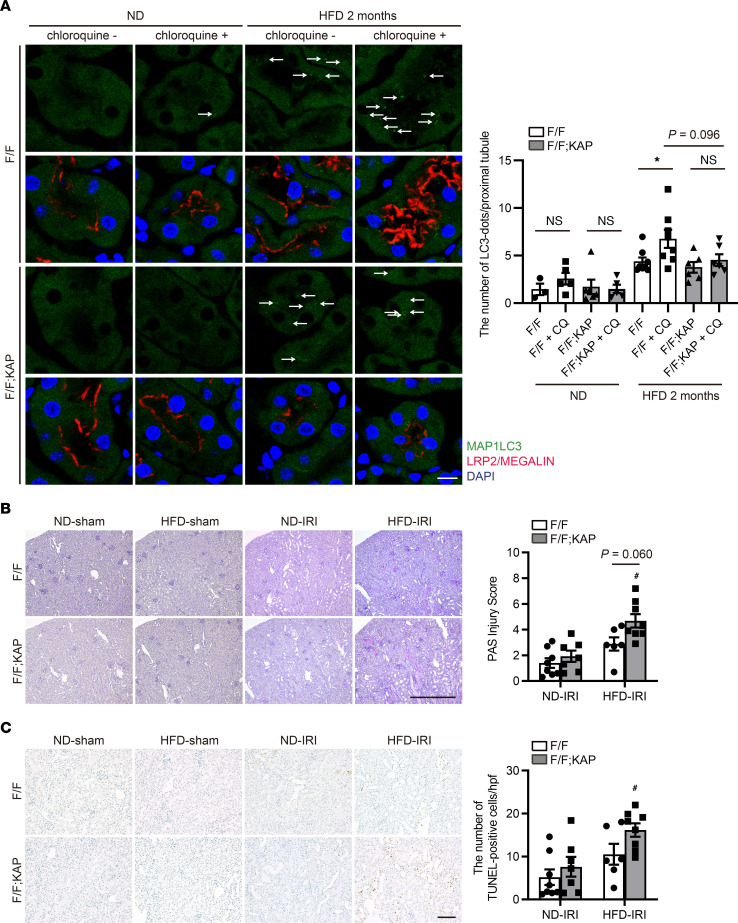
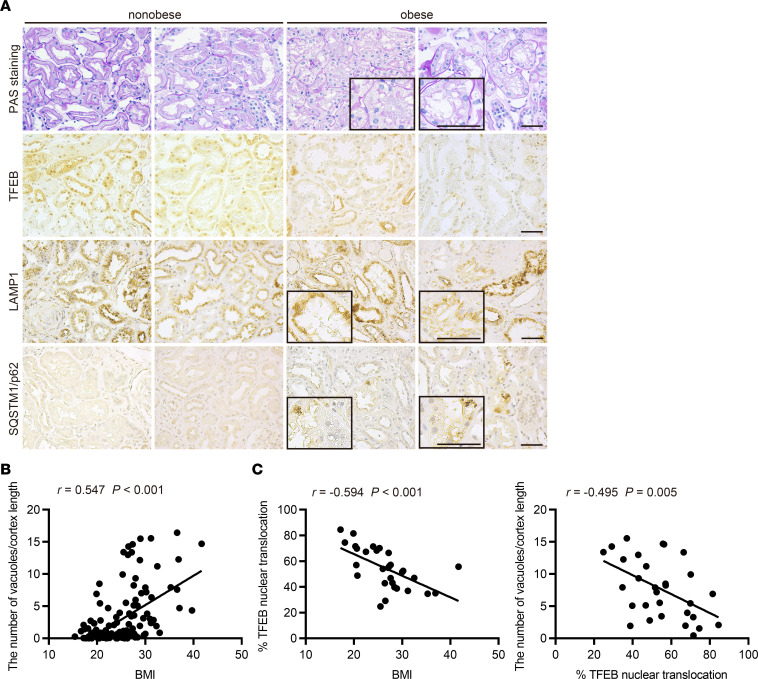
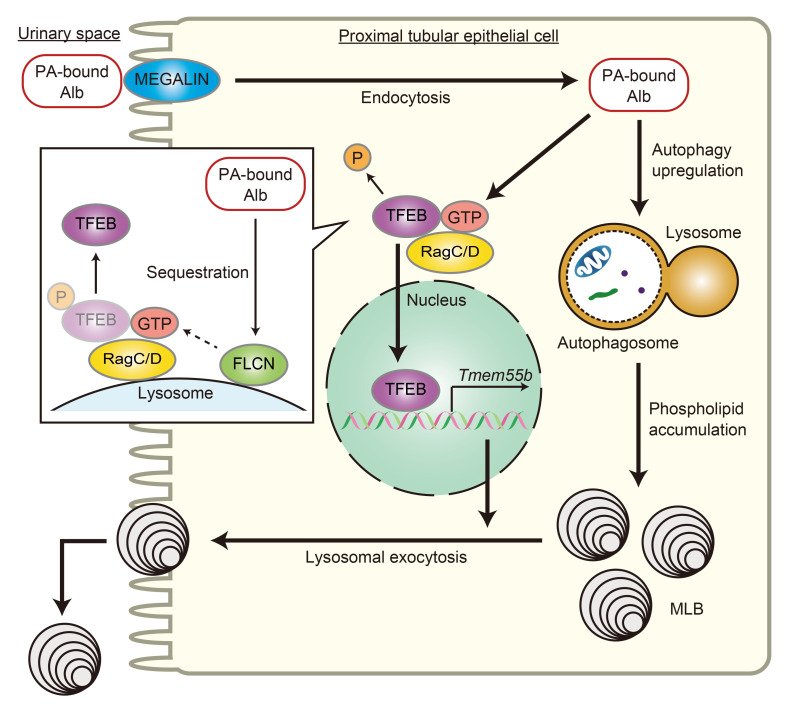
Obesity is a major risk factor for end-stage kidney disease. We previously found that lysosomal dysfunction and impaired autophagic flux contribute to lipotoxicity in obesity-related kidney disease, in both humans and experimental animal models. However, the regulatory factors involved in countering renal lipotoxicity are largely unknown. Here, we found that palmitic acid strongly promoted dephosphorylation and nuclear translocation of transcription factor EB (TFEB) by inhibiting the mechanistic target of rapamycin kinase complex 1 pathway in a Rag GTPase-dependent manner, though these effects gradually diminished after extended treatment. We then investigated the role of TFEB in the pathogenesis of obesity-related kidney disease. Proximal tubular epithelial cell-specific (PTEC-specific) Tfeb-deficient mice fed a high-fat diet (HFD) exhibited greater phospholipid accumulation in enlarged lysosomes, which manifested as multilamellar bodies (MLBs). Activated TFEB mediated lysosomal exocytosis of phospholipids, which helped reduce MLB accumulation in PTECs. Furthermore, HFD-fed, PTEC-specific Tfeb-deficient mice showed autophagic stagnation and exacerbated injury upon renal ischemia/reperfusion. Finally, higher body mass index was associated with increased vacuolation and decreased nuclear TFEB in the proximal tubules of patients with chronic kidney disease. These results indicate a critical role of TFEB-mediated lysosomal exocytosis in counteracting renal lipotoxicity.

Keywords: Chronic kidney disease; Lysosomes; Metabolism; Nephrology; Obesity.


Figures

Figure 1
Figure 1. PA activates TFEB in PTECs.
(A and B) We performed RNA-Seq transcriptomic analysis using cultured PTECs treated with either BSA- or PA-bound BSA for 6 hours to identify any significantly enriched pathways (n = 3). (A) Results of GSEA. Dot sizes represent the numbers of genes, while dot colors correspond to the adjusted P value. (B) A heatmap showing the relative expression of target genes. (C) Representative Western blot images of TFEB in nuclear and cytoplasmic fractions of cultured PTECs subjected to BSA or PA treatment for the indicated periods (n = 3). TFEB nuclear/cytoplasmic ratios at the indicated time points are quantified. TFEB nuclear and cytoplasmic levels were normalized for Lamin A/C and GAPDH levels, respectively. The values are normalized by the value at time 0. (D) Representative immunofluorescence images of TFEB in cultured PTECs subjected to BSA or PA treatment for the indicated periods (n = 3). The percentages of PTECs exhibiting TFEB nuclear translocation at the indicated time points are presented. Bars: 10 μm (D). Data are provided as means ± SEM. Statistically significant differences: #P < 0.05 versus BSA-treated PTECs (C and D, 2-tailed Student’s t test).
Figure 2
Figure 2. PA activates TFEB via a Rag GTPase–dependent mechanism.
(A) Representative Western blot images of phosphorylated (p-) TFEB S211, total TFEB, p-S6RP (Ser235/236), S6RP, p–4E-BP1 (Thr37/46), and 4E-BP1 in cultured PTECs after Torin 1, BSA, or PA treatment for 6 hours (n = 3). (B) Representative Western blot images of p-S6RP (Ser235/236), S6RP, p-4E-BP1 (Thr37/46), and 4E-BP1 in cultured PTECs subjected to BSA or PA treatment for the indicated periods (n = 3). The values are normalized by the value at time 0. (C) Representative immunofluorescence images of TFEB (green) in cultured PTECs transfected with a constitutively active form of HA-tagged RagC for 48 hours, including treatment with Torin 1, BSA, or PA for the last 6 hours (n = 3). Cells were immunostained for HA (red) and counterstained with DAPI (blue). The percentage of PTECs exhibiting TFEB nuclear translocation was determined in wild-type PTECs (RagC) and PTECs transfected with HA-tagged RagC (RagC+). (D) Representative Western blot images of TFEB, p-S6RP (Ser235/236), S6RP, p-4E-BP1 (Thr37/46), and 4E-BP1 in cultured PTECs either starved of amino acids for 60 minutes or starved for 60 minutes and then restimulated with amino acids for 30 minutes after BSA or PA treatment for 6 hours (n = 3). Bars: 10 μm (C). Data are provided as means ± SEM. Statistically significant differences: *P < 0.05 versus RagC PTECs with the same treatment; #P < 0.05 versus BSA-treated PTECs (A and B, 2-tailed Student’s t test; C, 1-way ANOVA followed by the Tukey-Kramer test). S6RP, S6 ribosomal protein.
Figure 3
Figure 3. TFEB alleviates phospholipid accumulation in enlarged lysosomes during lipid overload in PTECs.
(A) Immunofluorescence images of LAMP1 after BSA or PA treatment for 24 hours (n = 3). (BF) To investigate the role of TFEB in the kidneys under lipid overload, 8-week-old Tfebfl/fl KAP and Tfebfl/fl control mice were fed an ND or HFD for 2 months. (B) Immunostaining images showing TFEB in the kidney cortical regions (n = 6–7). The percentage of PTECs exhibiting TFEB nuclear translocation was determined. (C) Western blot images of TFEB in nuclear and cytosolic fractions of kidneys (n = 6–7). TFEB nuclear/cytosolic ratios are shown. Nuclear and cytosolic TFEB levels were normalized for Lamin A/C and GAPDH levels, respectively. (D and E) Images of PAS staining, LAMP1 immunostaining, toluidine blue staining (D), and Nile red staining (E) in the kidney cortical regions (n = 5–6). Sections were immunostained for LRP2, a marker of proximal tubules (blue) (D) and counterstained with hematoxylin (bluish purple) (D) and DAPI (E). (D) Vacuole scores are shown. (E) The number (per proximal tubule) of Nile red–positive dots was counted. (E) Images of electron micrographs of the kidneys. The number of MLBs was counted (n = 3). Bars: 10 μm (A), 40 μm (B and E), 50 μm (D), and 5 μm (F). Values represent means ± SEM. Statistically significant differences: *P < 0.05 versus treatment-matched Tfebfl/fl control littermates or wild-type PTECs; #P < 0.05 versus nonobese mice or BSA-treated PTECs (A, 1-way ANOVA followed by Dunnett’s test; DF, 1-way ANOVA followed by Tukey-Kramer test; B and C, 2-tailed Student’s t test). All images are representative of multiple experiments. WT, wild-type PTECs; KO, Tfeb-deficient PTECs; OE, Tfeb-overexpressing PTECs; BM, basement membrane; MLB, multilamellar body; TL, tubular lumen; N, nucleus; F/F, Tfebfl/fl mice; F/F;KAP, Tfebfl/fl KAP mice; PAS, periodic acid–Schiff; TB, toluidine blue.
Figure 4
Figure 4. PA-induced TFEB activation promotes lysosomal exocytosis of phospholipids to prevent MLB accumulation in PTECs.
(AC) To investigate the role of TFEB on lysosomal exocytosis, wild-type and Tfeb-deficient PTECs were treated with BSA (0.25%, A, or 0.125%, B and C) or PA (0.25 mM, A, or 0.125 mM, B and C) for 6 hours. (A) Electron micrographs of wild-type PTECs (n = 2). (B) β-Hexosaminidase activity in the culture supernatant of PTECs relative to the total activity (n = 3). (C) Immunofluorescence images of nonpermeabilized PTECs show only LAMP1 that is exposed on the plasma membrane (n = 3). (D and E) To investigate the trafficking of phospholipids, a fluorescent fatty acid pulse-chase assay was performed. (D) Schematic illustration of pulse-chase assay. FL HPC–loaded wild-type and Tfeb-deficient PTECs were chased after treatment with either 0.125% BSA or 0.125 mM PA for 6 hours, and the subcellular localization of FL HPC was determined by staining with LysoTracker Red for 0, 12, or 24 hours after PA washout. (E) To measure phospholipid accumulation in lysosomes, the number of dots indicating staining for both phospholipids and lysosomes was counted (n = 3). Bars: 5 μm (A) and 10 μm (C and E). Data are provided as means ± SEM. Statistically significant differences: *P < 0.05 versus wild-type PTECs with the same treatment; #P < 0.05 versus BSA-treated PTECs (B, 1-way ANOVA followed by the Tukey-Kramer test; E, 2-tailed Student’s t test). All images are representative of multiple experiments. Ly, lysosome; WT, wild-type PTECs; KO, Tfeb-deficient PTECs; DIC, differential interference contrast.
Figure 5
Figure 5. MLBs are released from the apical membrane of PTECs into the tubular lumen in obese mice.
(A and B) Representative electron micrographs of the kidneys (A) and the urine pellets (B) of nonobese and obese Tfebfl/fl mice (n = 2–3). (C) Urinary lipidomics of nonobese and obese mice (n = 5 or 7). Data are presented as the total amount of each lipid species normalized to urine creatinine concentration. Bars: 5 μm (A and B) and 500 nm (B, magnified image). Values represent means ± SEM. Statistically significant differences: #P < 0.05 versus nonobese mice (C, 2-tailed Student’s t test). BM, basement membrane; MLB, multilamellar body; TL, tubular lumen; N, nucleus; BMP, bis(monoacylglycerol) phosphate; PC, phosphatidylcholine; PE, phosphatidylethanolamine; PI, phosphatidylinositol; PS, phosphatidylserine; PG, phosphatidylglycerol; LPC, lysophosphatidylcholine; LPE, lysophosphatidylethanolamine; SM, sphingomyelin; Cer, ceramide; HexCer, hexose ceramide; LacCer, lactosylceramide; FA, fatty acid; MG, monoacylglycerol; DG, diacylglycerol; TG, triacylglycerol; CE, cholesterylester.
Figure 6
Figure 6. TFEB promotes apical transport of lysosomes in PTECs of obese mice.
(A and B) Representative images showing immunostaining for LAMP1 (A) and electron microscopy (B) of the kidney cortical regions of obese Tfebfl/fl and Tfebfl/fl KAP mice. (A) Sections were immunostained for LRP2, a marker of proximal tubules (blue) and counterstained with hematoxylin (bluish purple) (n = 5–6). (B) Basolateral MLBs were defined if they were located outside the white dotted line connecting the nuclei. The number of basolateral MLBs under each condition was counted in at least 20 PTECs (n = 3). (C and D) mRNA (C) and protein (D) levels of Tmem55b relative to Gapdh (C) and ACTB (D), respectively, in wild-type and Tfeb-deficient PTECs 6 hours after BSA or PA treatment (n = 3). The values are normalized by the mean value of BSA-treated, wild-type PTECs. Bars: 50 μm (A) and 5 μm (B). Values represent means ± SEM. Statistically significant differences: *P < 0.05 versus treatment-matched Tfebfl/fl control littermates or wild-type PTECs; #P < 0.05 versus nonobese mice or BSA-treated PTECs (BD, 1-way ANOVA followed by the Tukey-Kramer test). BM, basement membrane; MLB, multilamellar body; TL, tubular lumen; N, nucleus. F/F, Tfebfl/fl mice; F/F;KAP, Tfebfl/fl KAP mice; WT, wild-type PTECs; KO, Tfeb-deficient PTECs.
Figure 7
Figure 7. TFEB deficiency stagnates autophagic flux and enhances vulnerability to ischemia/reperfusion injury during HFD treatment.
(A) Autophagic flux was assessed by counting the number of GFP-positive dots in the proximal tubules of nonobese or obese GFP-MAP1LC3 transgenic Tfebfl/fl or Tfebfl/fl KAP mice with or without chloroquine administration (n = 3–6 in the nonobese group and 6–8 in the obese group). The number of GFP-positive dots per proximal tubule under each condition was counted in at least 10 high-power fields (original magnification, ×600) (each high-power field contained 10–15 proximal tubules). Representative images are presented. (B and C) Representative images of PAS (B) and TUNEL (C) staining of the kidney cortical regions of nonobese and obese Tfebfl/fl or Tfebfl/fl KAP mice 2 days after unilateral IR or sham operation (n = 6–8 in each group). Sections were immunostained for LRP2, a marker of proximal tubules (blue) (A) and counterstained with DAPI (A) and methyl green (blue/green) (C). (B) The tubular injury score is shown. (C) The number of TUNEL-positive PTECs was calculated in at least 10 high-power fields. Bars: 10 μm (A), 500 μm (B), and 100 μm (C). Data are provided as means ± SEM. Statistically significant differences: *P < 0.05 versus mice with no chloroquine treatment; #P < 0.05 versus nonobese mice (A, 2-tailed Student’s t test; B and C, 1-way ANOVA followed by the Tukey-Kramer test). Arrows indicate GFP-MAP1LC3 dots. CQ, chloroquine; F/F, Tfebfl/fl mice; F/F;KAP, Tfebfl/fl KAP mice.
Figure 8
Figure 8. Higher BMI is associated with increased vacuolation and decreased nuclear TFEB in PTECs of patients with CKD.
(A) Representative images of PAS staining and immunohistochemical staining for TFEB, LAMP1, and SQSTM1/p62 on kidney specimens obtained from obese and nonobese patients. Specimens were counterstained with hematoxylin. Magnified images are shown in the insets (original magnification, ×400). Bars: 50 μm. (B and C) Correlation between BMI and the severity of vacuolar formation (B) (n = 146) and between the percentage of PTECs exhibiting TFEB nuclear translocation and either BMI or the number of vacuoles (C) (n = 30). Relationships were examined using Pearson’s correlation and the corresponding P values. SQSTM1, sequestosome 1.
Figure 9
Figure 9. TFEB-mediated lysosomal exocytosis of MLBs is involved in ORT.
Schematic illustration of this study. PTECs retrieve albumin-bound PA from the glomerular filtrate via megalin-mediated albumin endocytosis, which is delivered to lysosomes for degradation. PA strongly induces autophagy, which mobilizes phospholipids from cellular membranes to lysosomes, resulting in MLB accumulation. On the other hand, PA promotes TFEB nuclear translocation via Rag GTPase inactivation by sequestration of FLCN to the lysosomal membrane; this mediates lysosomal exocytosis of phospholipids into the apical tubular space to prevent MLB accumulation and counteract lipotoxicity.

References

    1. NCD Risk Factor Collaboration (NCD-RisC) Worldwide trends in body-mass index, underweight, overweight, and obesity from 1975 to 2016: a pooled analysis of 2416 population-based measurement studies in 128·9 million children, adolescents, and adults. Lancet. 2017;390(10113):2627–2642. doi: 10.1016/S0140-6736(17)32129-3. - DOI - PMC - PubMed
    1. Chang AR, et al. Adiposity and risk of decline in glomerular filtration rate: meta-analysis of individual participant data in a global consortium. BMJ. 2019;364:k5301. doi: 10.1136/bmj.k5301. - DOI - PMC - PubMed
    1. D’Agati VD, et al. Obesity-related glomerulopathy: clinical and pathologic characteristics and pathogenesis. Nat Rev Nephrol. 2016;12(8):453–471. doi: 10.1038/nrneph.2016.75. - DOI - PubMed
    1. Saito A, et al. Molecular mechanisms of receptor-mediated endocytosis in the renal proximal tubular epithelium. J Biomed Biotechnol. 2010;2010:403272. doi: 10.1155/2010/403272. - DOI - PMC - PubMed
    1. Kuwahara S, et al. Megalin-mediated tubuloglomerular alterations in high-fat diet-induced kidney disease. J Am Soc Nephrol. 2016;27(7):1996–2008. doi: 10.1681/ASN.2015020190. - DOI - PMC - PubMed

Publication types

Substances