. 2023 Jan 24;120(4):e2213264120.
doi: 10.1073/pnas.2213264120. Epub 2023 Jan 17.

Measures of epitope binding degeneracy from T cell receptor repertoires

Affiliations

Measures of epitope binding degeneracy from T cell receptor repertoires

Andreas Mayer et al. Proc Natl Acad Sci U S A. .

Abstract

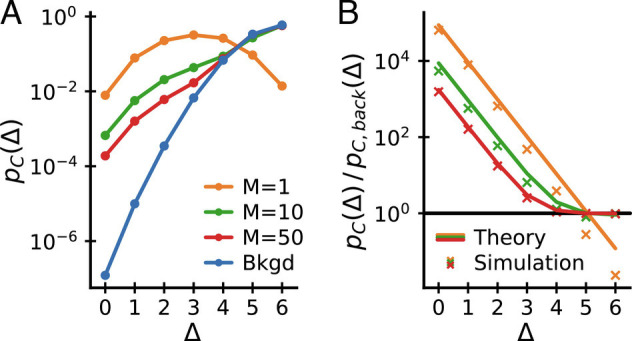
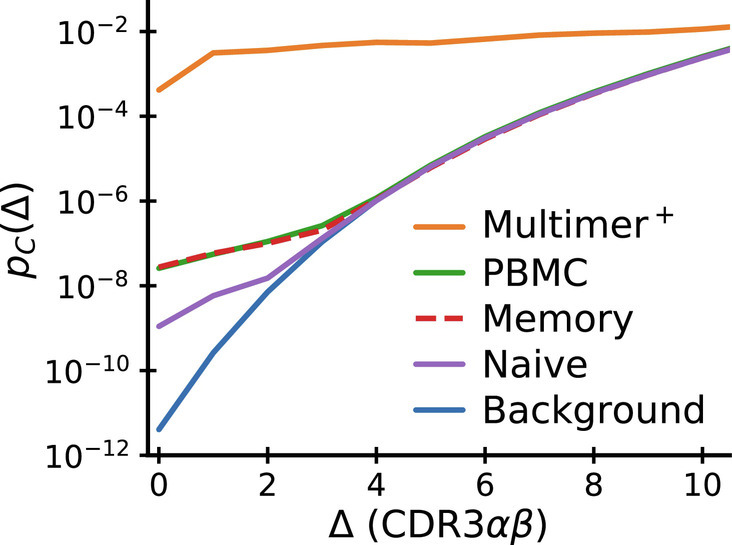
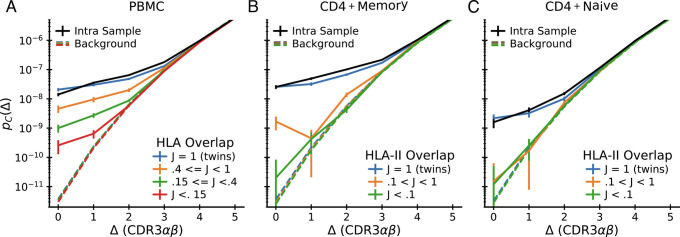
Adaptive immunity is driven by specific binding of hypervariable receptors to diverse molecular targets. The sequence diversity of receptors and targets are both individually known but because multiple receptors can recognize the same target, a measure of the effective "functional" diversity of the human immune system has remained elusive. Here, we show that sequence near-coincidences within T cell receptors that bind specific epitopes provide a new window into this problem and allow the quantification of how binding probability covaries with sequence. We find that near-coincidence statistics within epitope-specific repertoires imply a measure of binding degeneracy to amino acid changes in receptor sequence that is consistent across disparate experiments. Paired data on both chains of the heterodimeric receptor are particularly revealing since simultaneous near-coincidences are rare and we show how they can be exploited to estimate the number of epitope responses that created the memory compartment. In addition, we find that paired-chain coincidences are strongly suppressed across donors with different human leukocyte antigens, evidence for a central role of antigen-driven selection in making paired chain receptors public. These results demonstrate the power of coincidence analysis to reveal the sequence determinants of epitope binding in receptor repertoires.

Keywords: T cells; receptor-ligand binding; repertoire sequencing; specificity.


Conflict of interest statement

The authors declare no competing interest.

Figures

Fig. 1.
Fig. 1.
Patterns of sequence similarity within an epitope-specific repertoire. (A) Sequence-similarity clustermap of TCRs binding to an Epstein-Barr Virus epitope as obtained by single-cell TCR sequencing following tetramer sorting (Data: Dash et al. (14), antigen BMLF). Lower (Upper) triangle shows pairwise distances of CDR3α (CDR3β) sequences. Sequences are ordered by average linkage hierarchical clustering based on summed αβ distance. Columns on the left show the subject of origin and cluster assignment; sequences not belonging to a cluster based on a cutoff distance of 6 are shown in black. (B) Sequence logos for two clusters of specific sequences. Amino acids are colored by their chemical properties, and V and J gene usage within the cluster is displayed alongside the logo. (CE) Normalized histograms of pairwise distances between (C) CDR3β, (D) CDR3α, and (E) CDR3αβ sequences specific to the epitope show vastly increased sequence similarity relative to background expectations.
Fig. 2.
Fig. 2.
How selection increases coincidences. (A) How different selection procedures change the graph of sequence neighbors. Cells (nodes) in a background graph (Left) are connected by edges if they share an identical TCR. Random sampling of nodes (Middle) does not change the coincidence probability. Random sampling of clusters (Right) increases the coincidence probability. Selected nodes and links in orange; unselected background nodes in light blue. (BD) Coincidence probabilities for synthetic data generated by selecting 1% of cells (B), 1% of amino acid clonotypes (C), and 1% of meta-clonotypes (generated by including 10% of neighbors of each selected sequence). (D) at random. These random selection protocols act on a background CDR3β repertoire (data from ref. (16)). The gray lines show estimates for 20 repetitions of the sampling procedure, and the orange line shows their average.
Fig. 3.
Fig. 3.
Excess coincidences follow a common functional form across experiments. Sequence similarity of specific T cells for paired αβ-chain repertoires (Top), α-chain repertoires (Middle) and β-chain repertoires (Lower) compared with background expectations. In each panel, the assay type used to enrich for epitope-specific T cells and the antigen source are noted in the upper right. Panel C is special as analyzed TCRs are from unsorted blood and have not been explicitly selected for binding to a specific epitope. A common reference curve is plotted for visual guidance. Its parameter K is set equal to the empirical value at Δ = 0. Z is determined by normalization. Datasets: A, D, and F–(14); E and G–(16); H–(15); B–(17); C–(30).
Fig. 4.
Fig. 4.
Epitope binding restricts diversity of both chains individually and also restricts their pairing. Bar chart shows the decomposition of paired chain exact coincidence probability ratios (Fig. 3A) for individual epitopes in the dataset from Dash et al. (14) into contributions from selection of α chains (Fig. 3D) and β (Fig. 3F) individually (blue, orange), plus a smaller contribution from restricting the pairing of the two chains (green).
Fig. 5.
Fig. 5.
Coincidences in a mixture of motifs model. (A) Coincidence probabilities and (B) coincidence probability ratios to background for simulated data generated from a mixture of motifs model with different numbers of motifs M and c = 3. (B) also shows analytical expectations from Eq. 8 (lines), which agree well with the numerical results (crosses). The model reproduces key features of the empirical data: pC/pC, back decays exponentially for small Δ and asymptotes to a constant for large Δ at sufficiently large M.
Fig. 6.
Fig. 6.
Comparison of near-coincidence probabilities across paired-chain datasets. The highest values come from TCR repertoires specific to individual epitopes (solid orange curve: average over epitopes studied in Dash et al. (14) and Minervina et al. (17)). Paired-chain sequencing of whole blood (green), sorted CD4+ memory (dashed red) and CD4+ naive (purple) repertoires, data averaged over subjects from Tanno et al. (30) give much smaller values. Background coincidence probabilities (calculated assuming independent chain pairing) are shown in blue. See text for a discussion of the large difference in coincidence probabilities between repertoires.
Fig. 7.
Fig. 7.
Intersubject coincidences depend on HLA overlap. Pairwise interdataset coincidence frequency analysis for the 15 paired-seq datasets from Tanno et al. (30) grouped by pairwise HLA overlap. A: pairs of unsorted PBMC repertoires; B: pairs of CD4+ memory repertoires; C: pairs of CD4+ naive repertoires. Each plot shows means over pairs whose HLA overlap lies within the indicated ranges together with estimated standard errors assuming Poisson sampling. For comparison, the mean intradataset coincidence distribution is shown in black. Background distributions constructed by scrambling the α and β chain associations within individuals are shown as dashed curves (colored according to the same HLA overlap code). These curves show no near-coincidence enhancement signal and very weak dependence on HLA overlap class.

References

    1. Davis M. M., Bjorkman P. J., The T cell receptor genes and T cell recognition. Nature 334, 395 (1988). - PubMed
    1. Robins H. S., et al. , Comprehensive assessment of T-cell receptor β-chain diversity in αβ T cells. Blood 114, 4099–4107 (2009). - PMC - PubMed
    1. Emerson R. O., et al. , Immunosequencing identifies signatures of cytomegalovirus exposure history and HLA-mediated effects on the T cell repertoire. Nat. Genet. 49, 659–665 (2017). - PubMed
    1. Heather J. M., Ismail M., Oakes T., Chain B., High-throughput sequencing of the T-cell receptor repertoire: Pitfalls and opportunities. Briefings Bioinf. 19, 554–565 (2017). - PMC - PubMed
    1. Bradley P., Thomas P. G., Using T cell receptor repertoires to understand the principles of adaptive immune recognition. Ann. Rev. Immunol. 37, 547–70 (2019). - PubMed

Publication types

Substances

LinkOut - more resources