. 2022 Dec 19;62(1):610-626.
doi: 10.1021/acs.iecr.2c03068. eCollection 2023 Jan 11.

Chemical Stability and Characterization of Degradation Products of Blends of 1-(2-Hydroxyethyl)pyrrolidine and 3-Amino-1-propanol

Affiliations

Chemical Stability and Characterization of Degradation Products of Blends of 1-(2-Hydroxyethyl)pyrrolidine and 3-Amino-1-propanol

Solrun Johanne Vevelstad et al. Ind Eng Chem Res. .

Abstract

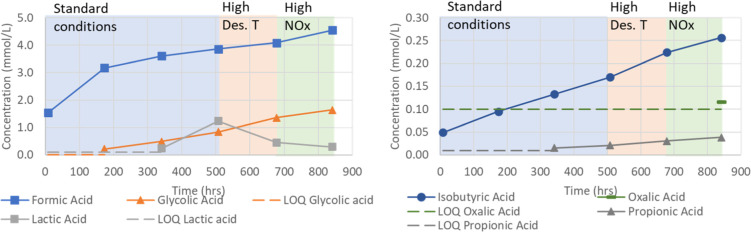
Aqueous amine solvents are used to capture CO2 from various flue gas sources. In this work, the chemical stability of a blend of 3-amino-1-propanol (3A1P) and 1-(2-hydroxyethyl)pyrrolidine [1-(2HE)PRLD] was studied. The chemical stability tests were conducted both in batch and cycled systems using various oxygen and NOx concentrations, additives (iron), and temperatures. In the thermal degradation experiments with CO2 present, the blend was more stable than the primary amines [(3A1P or monoethanolamine (MEA)] but less stable than the tertiary amine 1-(2HE)PRLD alone. Similar stability was observed between MEA, 3A1P, and the blend in the batch experiments at medium oxygen concentration (21% O2) and no iron present. 1-(2HE)PRLD was more stable. However, the presence of high oxygen concentration (96% O2) and iron reduced the stability of 1-(2HE)PRLD significantly. Furthermore, in the case of the blend, the chemical stability increased with increasing promoter concentration in batch experiments. During the cyclic experiment, the amine loss for the blend was similar to what was previously observed for MEA (30 wt %) under the same conditions. A thorough mapping of degradation compounds in the solvent and condensate samples resulted in the identification and quantification of 30 degradation compounds. The major components in batch and cycled experiments varied somewhat, as expected. In the cyclic experiments, the major components were ammonia, 3-(methylamino)-1-propanol (methyl-AP), N,N'-bis(3-hydroxypropyl)-urea (AP-urea), pyrrolidine, formic acid (formate), and N-(3-hydroxypropyl)-glycine (HPGly). Finally, in this paper, formation pathways for the eight degradation compounds (1,3-oxazinan-2-one, AP-urea, 3-[(3-aminopropyl)amino]-1-propanol, tetrahydro-1-(3-hydroxypropyl)-2(1H)-pyrimidinone, methyl-AP, N-(3-hydroxypropyl)-formamide, N-(3-hydroxypropyl)-β-alanine, and HPGly) are suggested.


Conflict of interest statement

The authors declare no competing financial interest.

Figures

Figure 1
Figure 1
Amine loss (mole based %) for thermal degradation (with CO2) for single amines as well as the blend (this work: CA,0 = 5.48 α = 0.4 mol CO2/mol amine, Eide-Haugmo 2011:CA,0 = 4.00 α = 0.5 and Hartono et al. 2017:CA,0 = 2.29 α = 0.4).
Figure 2
Figure 2
Amine loss (mole based %) for single amine solutions and the blend in setups 1 and 2 with different temperatures, oxygen, and iron concentrations. 30 wt % MEA—Vevelstad et al. 2013, 30 wt % 3A1P—Vevelstad et al. 2014, 30 wt % 1(2HE)PRLD—Hartono et al. 2017, and 30 wt % MEA and 30 wt % 3A1P—Buvik et al. 2021.
Figure 3
Figure 3
Amine loss (mole based %) for the blend with a constant concentration of 40 wt %, while the concentration of 3A1P varies from 0 to 20 wt %.
Figure 4
Figure 4
Concentration (mmol/L) of pyrrolidine and methyl-AP as a function of time (h) for the oxidative degradation experiments at 96% O2, 0.5 mMFe, 60 °C.
Figure 5
Figure 5
Concentration (mmol/L) of formic and glycolic acid as a function of time (h).
Figure 6
Figure 6
Concentration (mmol/L) of acetic and propionic acid as a function of time (h). Acetic and propionic acid were below the LOQ for 40 wt % 1-(2HE)PRLD + 15 wt % 3A1P and 40 wt % 1-(2HE)PRLD + 20 wt % 3A1P.
Figure 7
Figure 7
Concentration (mmol/L) of HPF and OZN as a function of time (h) for the blend with 40 wt % 1-(2HE)PRLD and either 5, 15, or 20 wt % 3A1P.
Figure 8
Figure 8
Concentration (mmol/L) of AP-urea and HPAla as a function of time (h) for the blend with 40 wt % 1-(2HE)PRLD and either 5, 15, or 20 wt % 3A1P.
Figure 9
Figure 9
Concentration (mmol/L) of HPGly and APAP as a function of time (h) for the blend with 40 wt % 1-(2HE)PRLD and either 5, 15, or 20 wt % 3A1P. APAP was below the LOQ for 40 wt % 1-(2HE)PRLD + 5 wt % 3A1P.
Figure 10
Figure 10
Concentration (mol/kg) of 1-(2HE)PRLD, 3A1P, alkalinity, and total nitrogen in the lean samples as a function of time (week)—the data has been corrected for water and CO2.
Figure 11
Figure 11
Total nitrogen balance for the solvent samples showing the solvent ’components’ contribution to the nitrogen balance.
Figure 12
Figure 12
Degradation ’compounds’ contribution to the nitrogen balance.
Figure 13
Figure 13
Acidic components (%) identified in the solvent samples that contribute to HSSs.
Figure 14
Figure 14
Concentration (μmol/L) of identified nitrosamines in lean week 5 on the left-hand side and condensate week 5 on the right-hand side.
Figure 15
Figure 15
Concentration (mmol/L) of pyrrolidine, AP-urea, HPGly, Methyl-AP, HPF, APAP, OZN, HPAla, and tHHPP as a function of time (h) in the SDR campaign using three different conditions: (1) standard conditions [O2 (12%), stripper T (120 °C), and NOx (5 ppm)] shaded area in blue, (2) high stripper T [O2 (12%), stripper T (140 °C), and NOx (5 ppm)] shaded area in orange, and (3) higher NOx [O2 (12%), stripper T (120 °C), and NOx (50 ppm)] shaded area in green. LOQs for APAP and tHHPP are also given.
Figure 16
Figure 16
Concentration (mmol/L) of formic, glycolic, lactic, isobutyric, oxalic, and propionic acids as a function of time (h) in the SDR campaign using three different conditions: (1) standard conditions [O2 (12%), stripper T (120 °C), and NOx (5 ppm)] shaded area in blue, (2) high stripper T [O2 (12%), stripper T (140 °C), and NOx (5 ppm)] shaded area in orange, and (3) higher NOx [O2 (12%), stripper T (120 °C), and NOx (50 ppm)] shaded area in green. LOQs for APAP and tHHPP are also given.
Figure 17
Figure 17
Concentration (mmol/L) of ammonia, MA, EA, formaldehyde, acetaldehyde, NPYR, DMA, propylamine, ethylmethylamine, and nitroso-N-methyl-AP as a function of time (h) in the SDR campaign using three different conditions: (1) standard conditions [O2 (12%), stripper T (120 °C), and NOx (5 ppm)] shaded area in blue, (2) high stripper T [O2 (12%), stripper T (140 °C), and NOx (5 ppm)] shaded area in orange, and (3) higher NOx [O2 (12%), stripper T (120 °C), and NOx (50 ppm)] shaded area in green. LOQs for DMA and ethylmethylamine are also given.
Scheme 1
Scheme 1. Suggested Pathway for the Formation of OZN, AP-Urea, APAP, and tHHPP Adapted from Literature,,
Scheme 2
Scheme 2. Suggested Pathways for the Formation of APAP Adapted from Literature,,
Scheme 3
Scheme 3. Suggested Pathways for the Formation of Methyl-AP Adapted from Literature,−
Scheme 4
Scheme 4. Suggested Pathway for the Formation of HPF Adapted from Lepaumier et al.
Scheme 5
Scheme 5. Suggested Pathway for the Formation of HPAla from 3-Oxo-propanoic Acid Adapted from Vevelstad et al.
Scheme 6
Scheme 6. One of the Suggested Pathways for the Formation of HPGly Adapted from Gouedard

References

    1. Hartono A.; Rennemo R.; Awais M.; Vevelstad S. J.; Brakstad O. G.; Kim I.; Knuutila H. K. Characterization of 2-piperidineethanol and 1-(2-hydroxyethyl)pyrrolidine as strong bicarbonate forming solvents for CO2 capture. Int. J. Greenhouse Gas Control 2017, 63, 260–271. 10.1016/j.ijggc.2017.05.021. - DOI
    1. Hartono A.; Vevelstad S. J.; Ciftja A.; Knuutila H. K. Screening of strong bicarbonate forming solvents for CO2 capture. Int. J. Greenhouse Gas Control 2017, 58, 201–211. 10.1016/j.ijggc.2016.12.018. - DOI
    1. Hartono A.; Vevelstad S. J.; Kim I.; Rennemo R.; Knuutila H. K. Promoted Strong Bicarbonate Forming Solvents for CO2 Capture. Energy Procedia 2017, 114, 1794–1802. 10.1016/j.egypro.2017.03.1307. - DOI
    1. Kvamsdal H. M.; Kim I.; Van Os P.; Pevida C.; Hägg M.-B.; Brown J.; Robinson L.; Feron P. HiPerCap: A New FP7 Project for Development and Assessment of Novel and Emerging Post-combustion CO2 Capture Technologies. Energy Procedia 2014, 63, 6166–6172. 12th International Conference on Greenhouse Gas Control Technologies, GHGT-1210.1016/j.egypro.2014.11.648. - DOI
    1. Hartono A.; Vevelstad S. J.; Ciftja A.; Knuutila H. K. Screening of strong bicarbonate forming solvents for CO2 capture. Int. J. Greenhouse Gas Control 2017, 58, 201–211. 10.1016/j.ijggc.2016.12.018. - DOI