Review
. 2023 Jan;16(1):e014068.
doi: 10.1161/CIRCIMAGING.122.014068. Epub 2023 Jan 17.

Imaging Methods: Magnetic Resonance Imaging

Affiliations
Review

Imaging Methods: Magnetic Resonance Imaging

Katharine E Thomas et al. Circ Cardiovasc Imaging. 2023 Jan.

Abstract

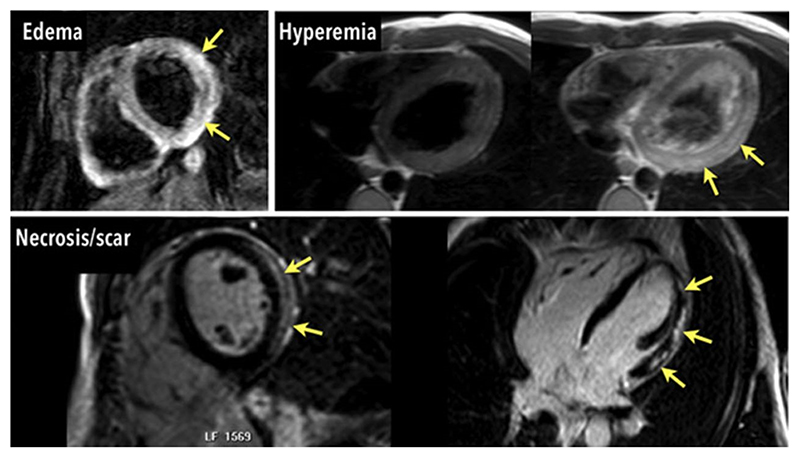
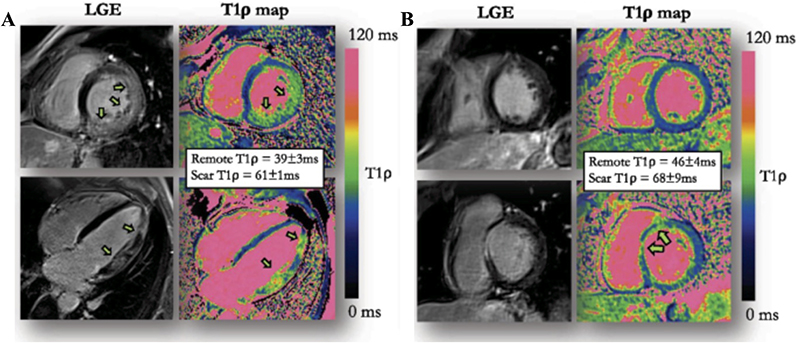
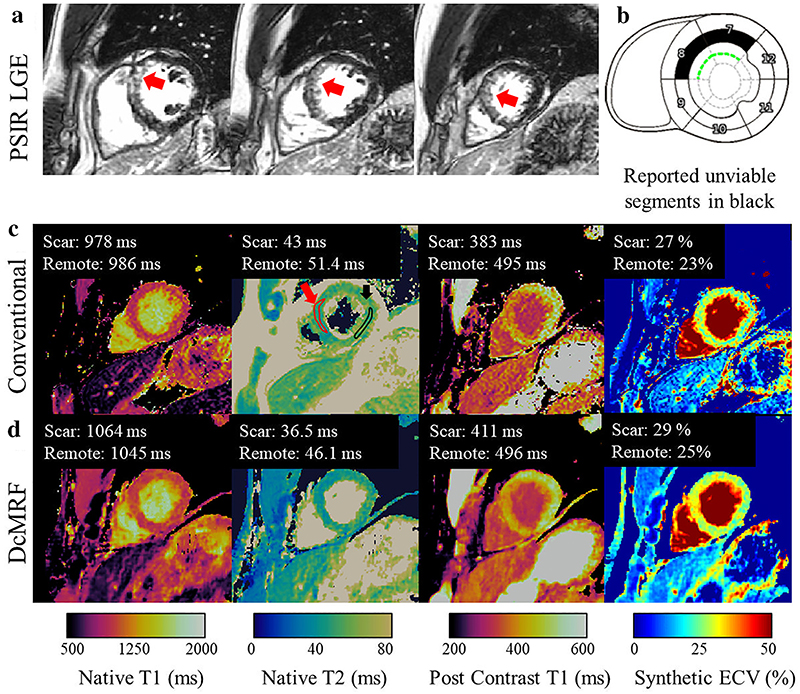
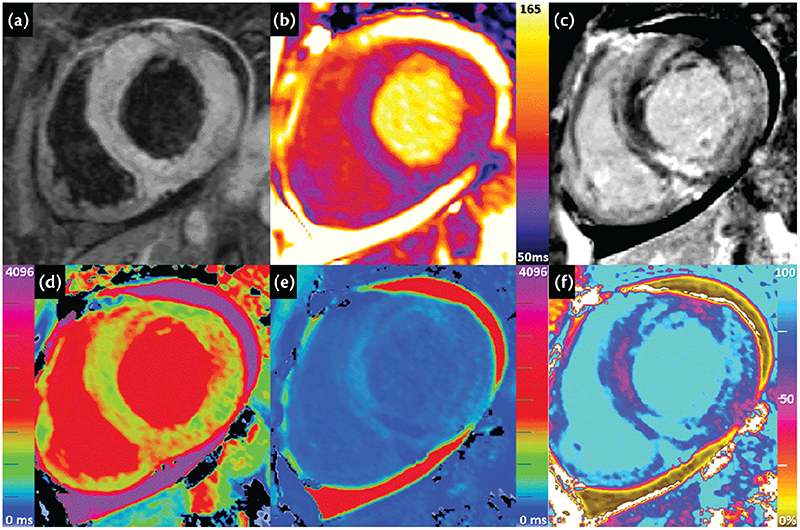
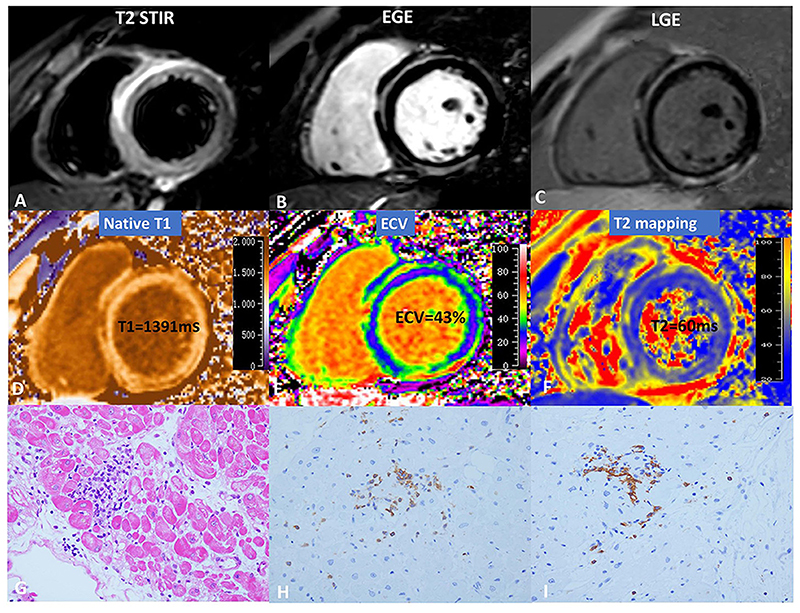
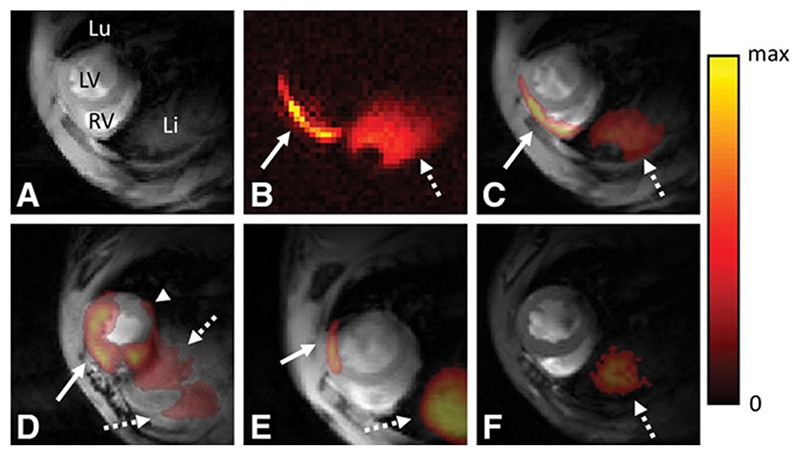
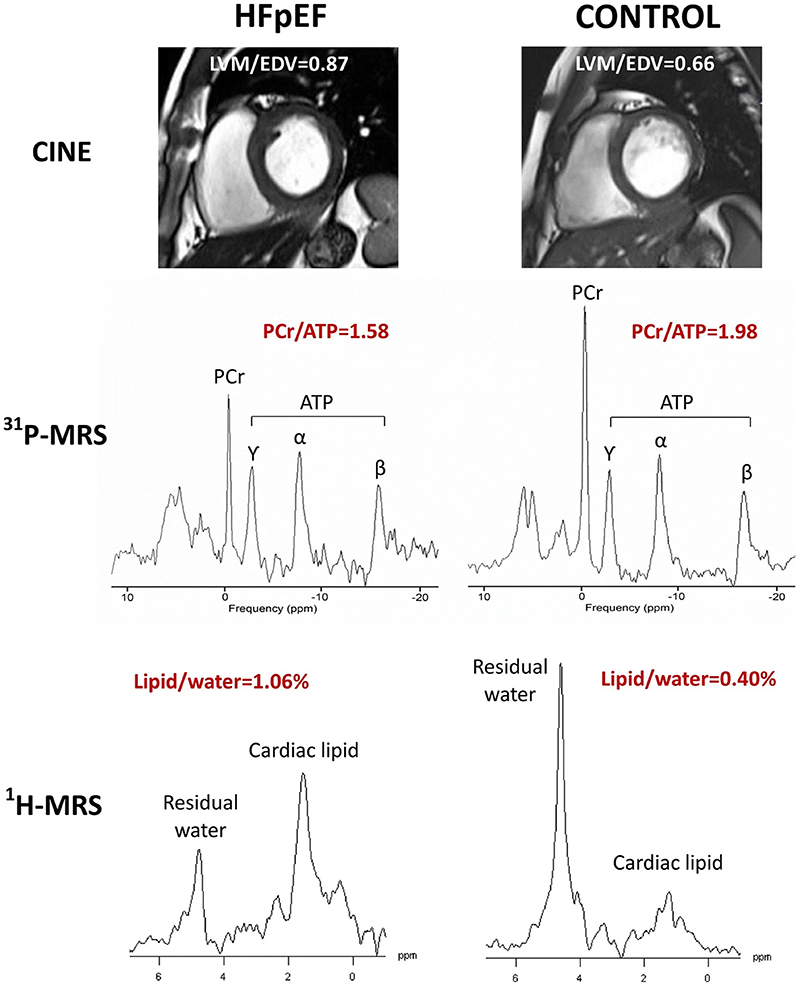
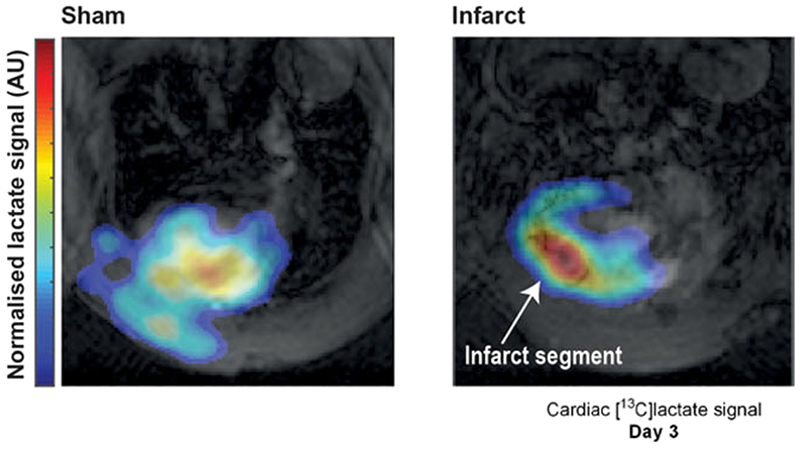
Myocardial inflammation occurs following activation of the cardiac immune system, producing characteristic changes in the myocardial tissue. Cardiovascular magnetic resonance is the non-invasive imaging gold standard for myocardial tissue characterization, and is able to detect image signal changes that may occur resulting from inflammation, including edema, hyperemia, capillary leak, necrosis, and fibrosis. Conventional cardiovascular magnetic resonance for the detection of myocardial inflammation and its sequela include T2-weighted imaging, parametric T1- and T2-mapping, and gadolinium-based contrast-enhanced imaging. Emerging techniques seek to image several parameters simultaneously for myocardial tissue characterization, and to depict subtle immune-mediated changes, such as immune cell activity in the myocardium and cardiac cell metabolism. This review article outlines the underlying principles of current and emerging cardiovascular magnetic resonance methods for imaging myocardial inflammation.

Keywords: cardiac imaging techniques; immune system; inflammation; magnetic resonance imaging.


Figures

Figure 1
Figure 1
Cardiovascular magnetic resonance criteria for myocarditis (Lake Louise Criteria) in the same patients: regional myocardial edema (top left), hyperemia in images acquired early after contrast injection (top right), and inflammatory necrosis in images acquired late (>10 minutes) after contrast injection (bottom). All 3 criteria are positive. As originally published by Wolters Kluwer Health, Inc in Friedrich and Marcotte, Circulation: Cardiovascular Imaging. 2013;6:834
Figure 2
Figure 2
A. 51-year-old male patient with acute myocarditis. Extensive patchy intramural and subepicardial late gadolinium enhancement (LGE) in the left ventricular free wall and the corresponding changes in T1rho-mapping. B. 35-year-old male patient with myocarditis. Intramural LGE in the basal antero-septal segment and the corresponding changes in T1rho-mapping. Modified image originally published by BMC in Bustin et al, J Cardiovasc Magn Reson. 2021;23(1):119.
Figure 3
Figure 3. Patient with subendocardial chronic infarct.
(a) Phase-sensitive inversion recovery late gadolinium enhanced (PSIR LGE) images showing infarct (red arrow). (b) Diagram of reported unviable segments (c) conventional maps (d) cardiac MRF maps. Example ROIs drawn in the scar (red) and remote (black) areas are shown on the conventional T2 map (c). Water T1 (pre- and post-contrast), water T2, and synthetic ECV cardiac MRF values are in good agreement with conventional measurements. MRF = Magnetic Resonance Fingerprinting. ROI = Region of Interest. ECV = extracellular volume. As originally published by Wiley in Jaubert et al. Journal of Magnetic Resonance Imaging. 2021;53(4):1262
Figure 4
Figure 4. Cardiovascular magnetic resonance (CMR) images of a patient who presented with severe acute viral myocarditis.
(A) Dark-blood T2-weighted imaging showed global and focal increased myocardial T2 signal intensity, with a T2 signal intensity (SI) ratio compared to skeletal muscle (not shown) of > 3.0, consistent with severe acute edema. (B) T2-mapping showed global increase in myocardial T2 values of 89 ms (1.5 Tesla), consistent with edema. (C) Late gadolinium enhancement (LGE) imaging showed multiple areas of midwall, subepicardial and patchy enhancement in a non-coronary distribution. (D) Native T1-mapping using the ShMOLLI method showed significantly increased global myocardial T1 values (1048 ms; normal 962 ± 25 ms), and up to 1240 ms in focal areas of injury. (E) Post-gadolinium contrast T1-mapping (at 15 min) showed areas of very low T1 in areas of LGE. (F) Extracellular volume (ECV) mapping showed significantly expanded ECV of 43% (normal 27 ± 3 %). ShMOLLI = shortened modified Look-Locker inversion recovery. From: Ferreira VM et al. Myocarditis. In: The EACVI Textbook of Cardiovascular Magnetic Resonance M. Lombardi, V. Ferrari, C. Bucciarelli-Ducci, S. Petersen, and S. Plein, Eds. Oxford, UK: Oxford University Press 2018.
Figure 5
Figure 5. Cardiovascular magnetic resonance (CMR) and pathology results for a representative case of myocarditis.
(A) T2-STIR, (B) EGE, (C) LGE, (D) native T1, (E) ECV, and (F) T2-mapping. (G) indicates focal myocyte damage with lymphocytic infiltration. Immunohistochemistry revealed (H) LCA + (x40) and (I) CD20 + (x40). As originally published by Open Access Frontiers in Li et al. Frontiers in Cardiovascular Medicine. 2021;8:739892. T2 STIR = T2 short-tau inversion recovery, EGE = early gadolinium enhancement, LGE = late gadolinium enhancement, ECV = extracellular volume, LCA = leukocyte common antigen, CD = cluster of differentiation
Figure 6
Figure 6. In vivo fluorine-19 (19F)-cardiovascular magnetic resonance (CMR) of myocarditis.
A, 1H CMR slice in the short-axis orientation at the base of the heart of a mouse with disease score 3; 1H CMR depicts the right and left ventricles (RV and LV) as well as the lung (Lu) and liver (Li). B, 19F-CMR of the same anatomic location. Two regions with a 19F signal can be observed: a thin line at the level of the myocardium (solid arrow) and a larger region at the level of the liver (dotted arrow). The color coding for 19F signal intensity is given to the right (in arbitrary units). C, Fusion of the 1H (A) and 19F images (B): the 19F signal colocalizes with the subepicardial layer of the LV anterior wall, the RV free wall (arrow) and the liver (dotted arrow). D, A similar fused basal slice in an animal with disease score 4. Here, the 19F signal is spread over the majority of the ventricles with a subepicardial 19F signal in the inferior wall of the LV (arrow head). E, Animal with disease score 2 with a relatively small patch of 19F signal (arrow). F, Healthy control, in which a 19F signal can only be observed in the liver (dotted arrow). As originally published by Wolters Kluwer Health, Inc in van Heeswijk et al. Circ Cardiovasc Imaging. 2013;6(2):280
Figure 7
Figure 7
Representative results of LVM/EDV, PCr/ATP and Lipid/water for heart failure with preserved ejection fraction (HFpEF) (left) and control (right). Cine imaging (top panel), 31P-CMRS (middle panel) and 1H-CMRS (bottom panel). 1H-CMRS spectra are scaled based on unsuppressed water (not shown) and noise level. LVM = left ventricular mass; EDV = end-diastolic volume; PCr = phosphocreatine; ATP = adenosine triphosphate; CMRS = cardiovascular magnetic resonance spectroscopy. As originally published by Springer Nature in Mahmod et al. Journal of Cardiovascular Magnetic Resonance. 2018;20(1):88
Figure 8
Figure 8
Hyperpolarized [13C]lactate generation in a rodent model of cryoinfarction at 3 days post-experimental myocardial infarction compared to sham. Modified image originally published by Wiley in Anderson et al. NMR in Biomedicine. 2021;34(3):e4460

References

    1. Litviňuková M, Talavera-López C, Maatz H, Reichart D, Worth CL, Lindberg EL, Kanda M, Polanski K, Heinig M, Lee M, et al. Cells of the adult human heart. Nature. 2020;588:466–472. doi: 10.1038/s41586-020-2797-4. - DOI - PMC - PubMed
    1. Swirski FK, Nahrendorf M. Cardioimmunology: the immune system in cardiac homeostasis and disease. Nature Reviews Immunology. 2018;18:733–744. doi: 10.1038/s41577-018-0065-8. - DOI - PubMed
    1. Tschöpe C, Ammirati E, Bozkurt B, Caforio ALP, Cooper LT, Felix SB, Hare JM, Heidecker B, Heymans S, Hübner N, et al. Myocarditis and inflammatory cardiomyopathy: current evidence and future directions. Nature Reviews Cardiology. 2021;18:169–193. doi: 10.1038/s41569-020-00435-x. - DOI - PMC - PubMed
    1. Caforio AL, Pankuweit S, Arbustini E, Basso C, Gimeno-Blanes J, Felix SB, Fu M, Heliö T, Heymans S, Jahns R, et al. Current state of knowledge on aetiology, diagnosis, management, and therapy of myocarditis: a position statement of the European Society of Cardiology Working Group on Myocardial and Pericardial Diseases. Eur Heart J. 2013;34:2636–2648.:2648a-2648d. doi: 10.1093/eurheartj/eht210. - DOI - PubMed
    1. Cooper LT, Baughman KL, Feldman AM, Frustaci A, Jessup M, Kuhl U, Levine GN, Narula J, Starling RC, Towbin J, et al. The Role of Endomyocardial Biopsy in the Management of Cardiovascular Disease. Circulation. 2007;116:2216–2233. doi: 10.1161/CIRCULATIONAHA.107.186093. - DOI - PubMed

Publication types