. 2023 Apr 3;13(4):974-1001.
doi: 10.1158/2159-8290.CD-22-0455.

Targeting Microglial Metabolic Rewiring Synergizes with Immune-Checkpoint Blockade Therapy for Glioblastoma

Affiliations

Targeting Microglial Metabolic Rewiring Synergizes with Immune-Checkpoint Blockade Therapy for Glioblastoma

Zengpanpan Ye et al. Cancer Discov. .

Abstract

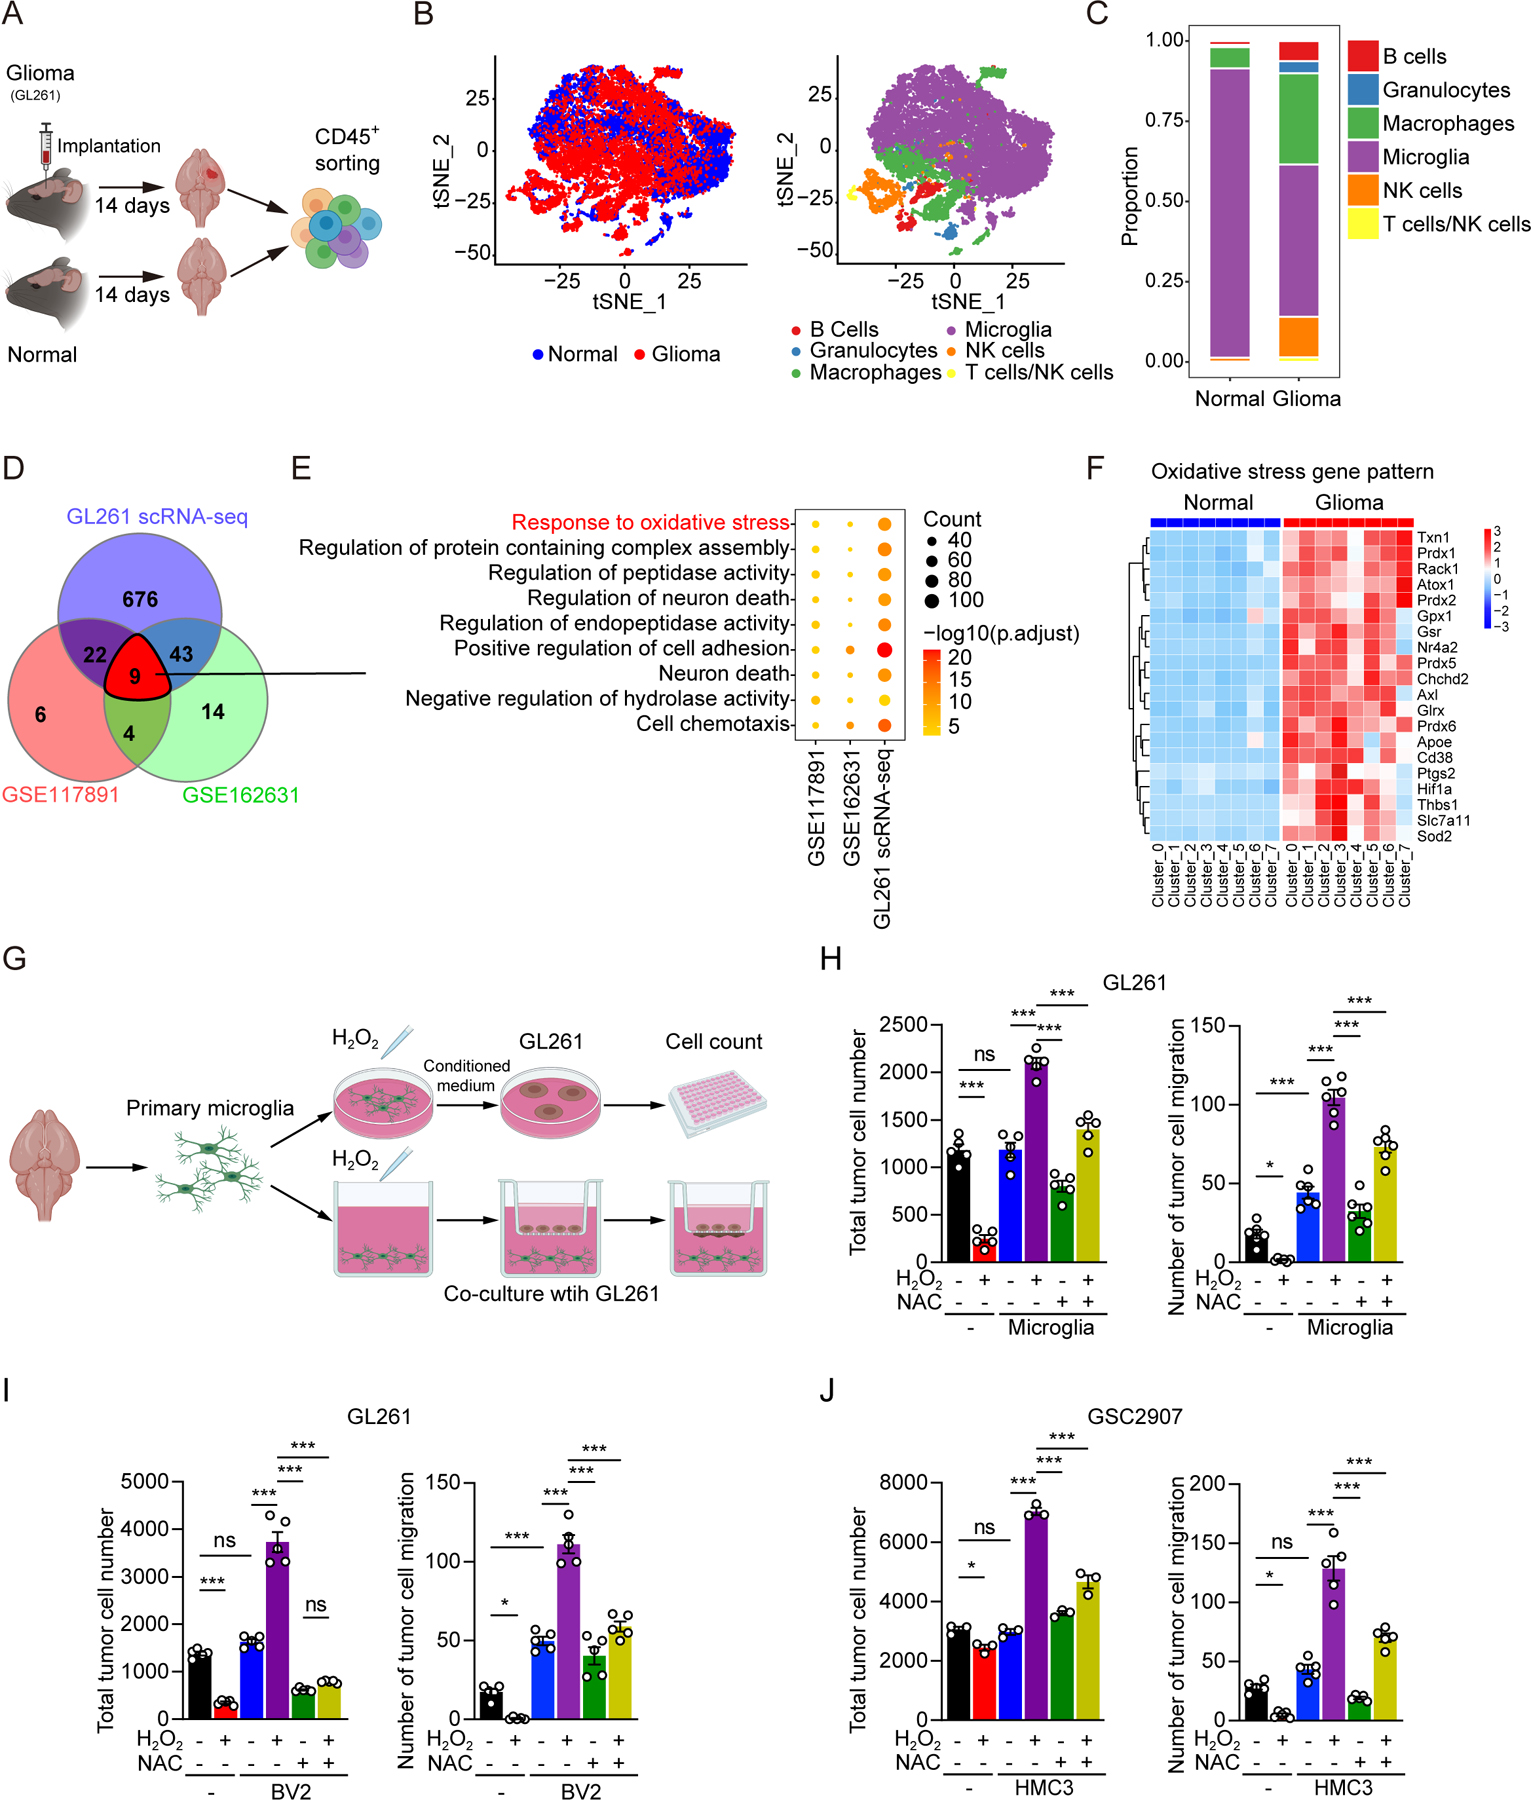
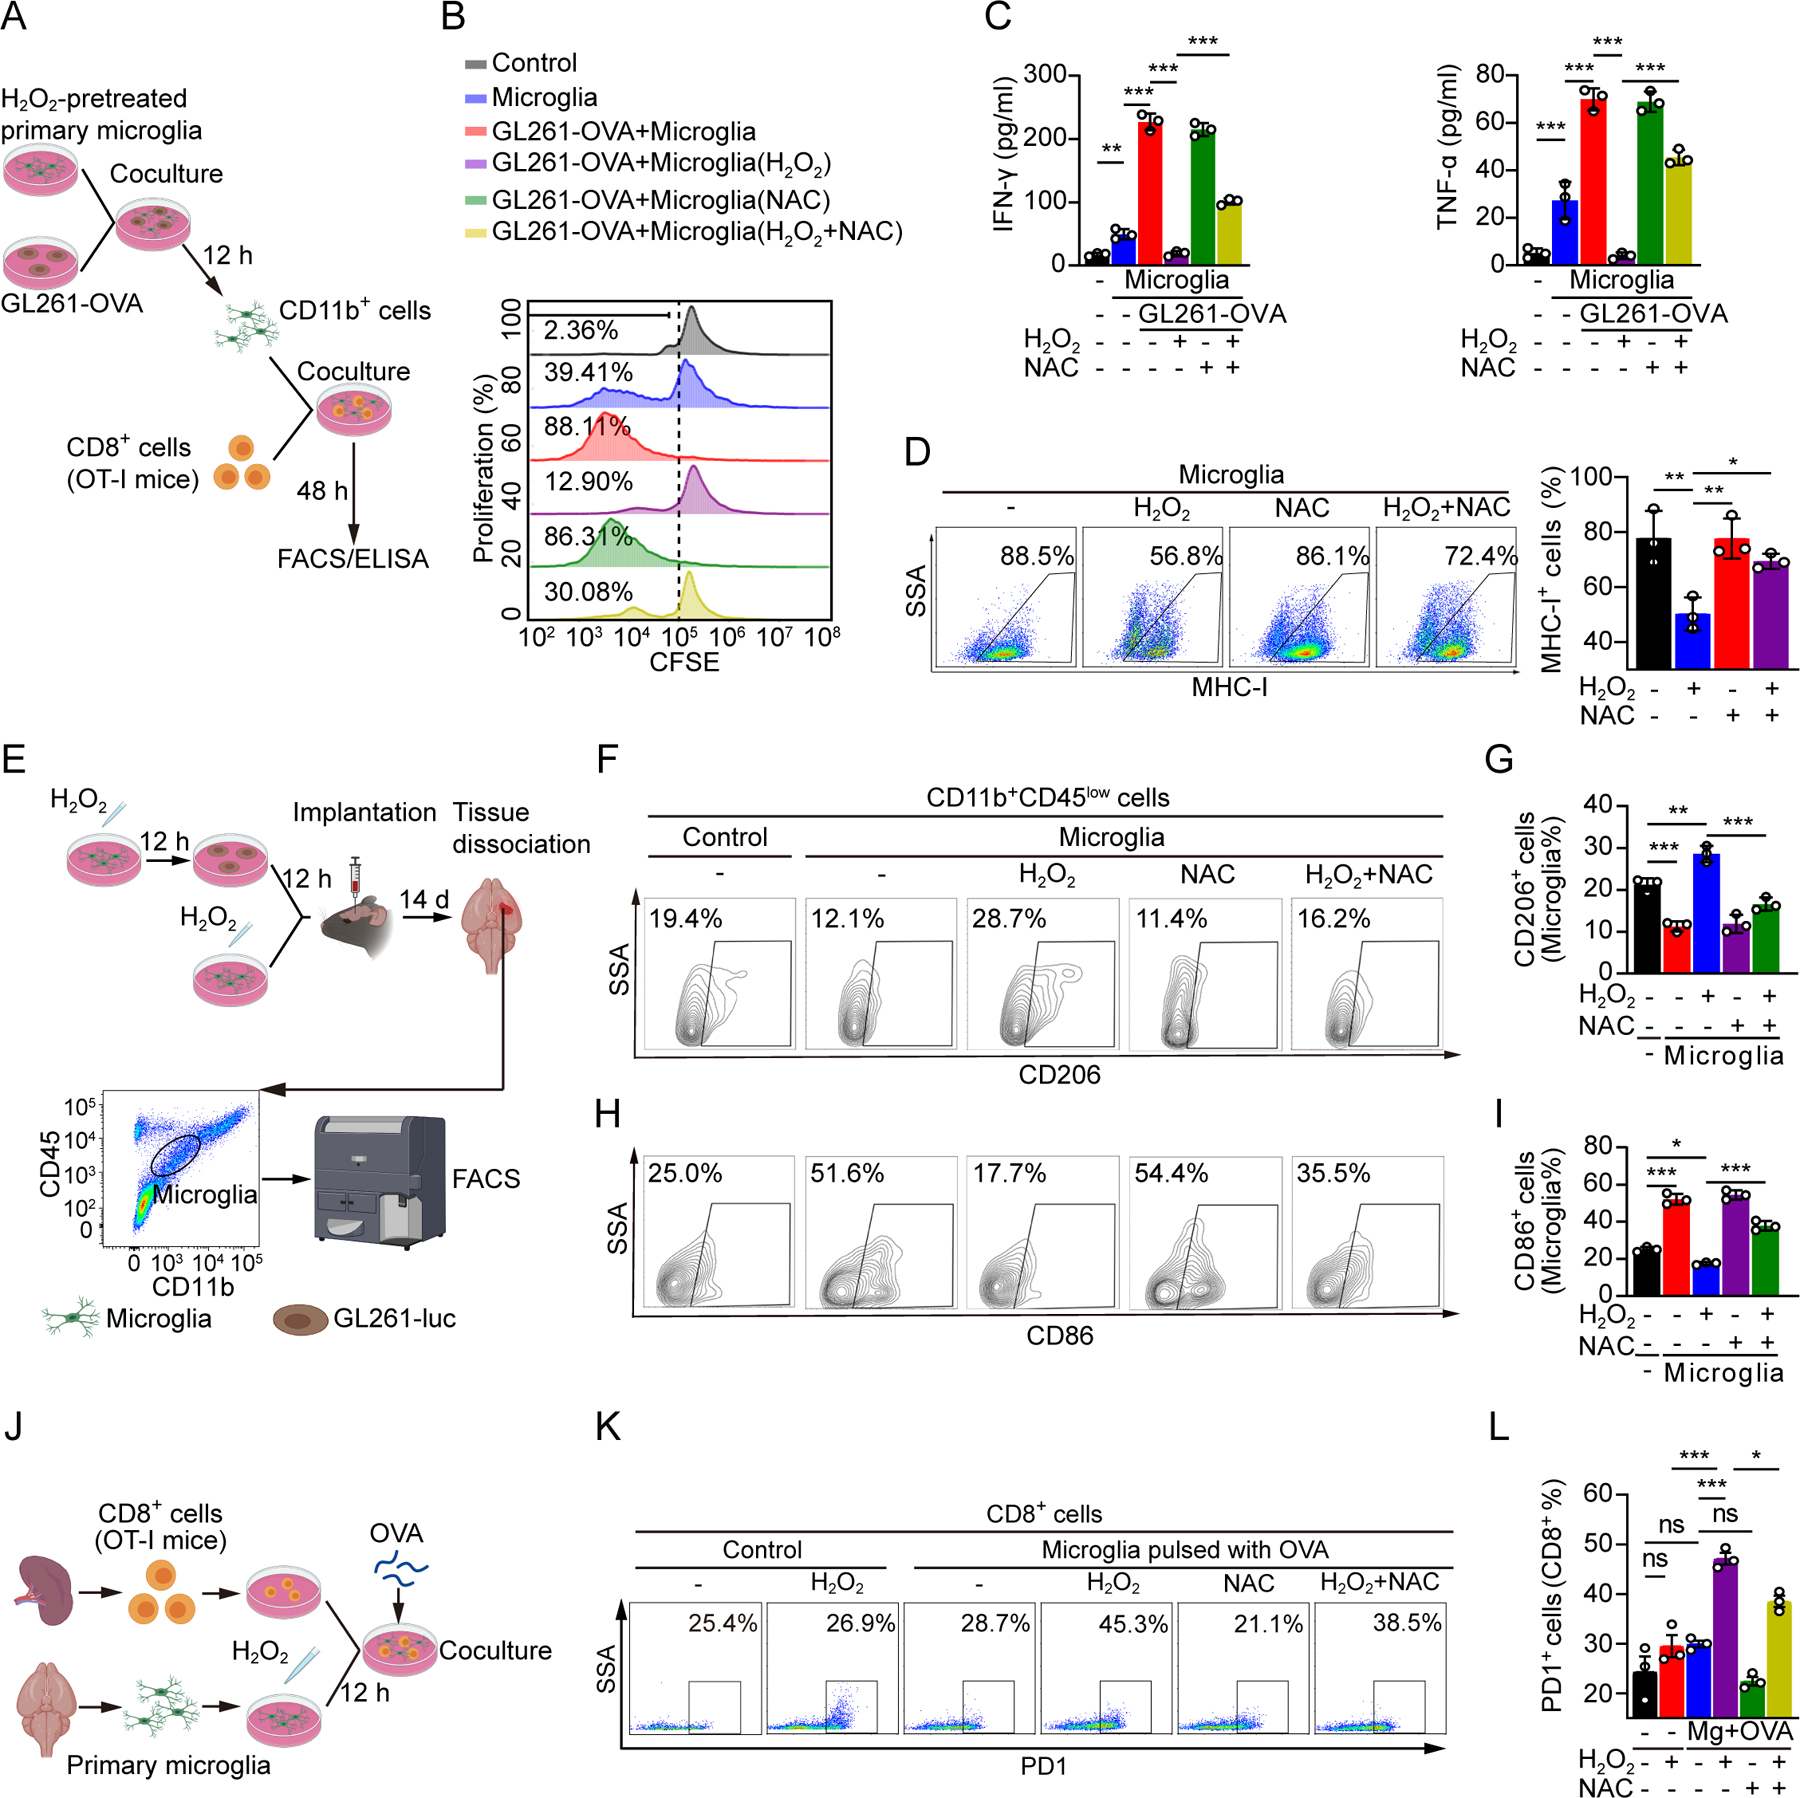
Glioblastoma (GBM) constitutes the most lethal primary brain tumor for which immunotherapy has provided limited benefit. The unique brain immune landscape is reflected in a complex tumor immune microenvironment (TIME) in GBM. Here, single-cell sequencing of the GBM TIME revealed that microglia were under severe oxidative stress, which induced nuclear receptor subfamily 4 group A member 2 (NR4A2)-dependent transcriptional activity in microglia. Heterozygous Nr4a2 (Nr4a2+/-) or CX3CR1+ myeloid cell-specific Nr4a2 (Nr4a2fl/flCx3cr1Cre) genetic targeting reshaped microglia plasticity in vivo by reducing alternatively activated microglia and enhancing antigen presentation capacity for CD8+ T cells in GBM. In microglia, NR4A2 activated squalene monooxygenase (SQLE) to dysregulate cholesterol homeostasis. Pharmacologic NR4A2 inhibition attenuated the protumorigenic TIME, and targeting the NR4A2 or SQLE enhanced the therapeutic efficacy of immune-checkpoint blockade in vivo. Collectively, oxidative stress promotes tumor growth through NR4A2-SQLE activity in microglia, informing novel immune therapy paradigms in brain cancer.

Significance: Metabolic reprogramming of microglia in GBM informs synergistic vulnerabilities for immune-checkpoint blockade therapy in this immunologically cold brain tumor. This article is highlighted in the In This Issue feature, p. 799.


Conflict of interest statement

Conflict of interest: No conflict of interest is declared.

Figures

Figure 1.
Figure 1.. The microglia population is under oxidative stress challenge and has oncogenic properties
(A) A schematic model to describe the single cell RNA sequencing analysis of CD45+ cells isolated from tumor tissues of GL261 glioma-bearing mice and the cortex of control mice. (B) t-SNE plots display and graph-based clustering of CD45+ cells from tumor tissue and normal brain (left). Clusters are further grouped by cell type (right). (C) Relative cellular composition of CD45+ cells in tumor tissue and normal brain. (D, E) Venn diagram showing the overlapping enriched GO terms of DEGs in microglia based on three glioma single cell RNA-seq datasets (GSE117891, GSE162631 and our GL261 scRNA-seq) (D). Nine enriched GO terms were shared in the three datasets (E). (F) Heat map of DEGs from GO term ‘Response to oxidative stress’ per single cell cluster of microglia. Eight clusters from microglia in glioma tissue and normal brain respectively for visualization. (G) A schematic model to evaluate the impact of microglia under different conditions on glioma cells. Effects of oxidative stress in microglia on cell proliferation and migration of glioma cells were examined in vitro. Primary microglia isolated from neonatal mice brain were treated with H2O2 (500 µM) in the absence or presence of NAC (5 mM) for 12 hours. Conditional medium from treated primary microglia was used to incubate with glioma cells (GL261) for 24 hours or GSC2907 for 48hours. Cell proliferation and migration of glioma cells were assessed by cell counts and transwell assays, respectively. CM, conditional medium. NAC, N-Acetyl-L-cysteine, antioxidant. (H-J) Quantification of cell proliferation and migration of glioma cells (GL261) treated by conditional medium from primary microglia (H) or BV2 cells (I) in respective group. (J) Quantification of cell proliferation and migration of patient-derived glioma stem cells (GSC2907) treated by conditional medium from human microglia cell line (HMC3). Data are shown as mean ± SEM. In (H), (I) and (J), P value was calculated using one-way ANOVA analysis. *p < 0.05, **p < 0.01, ***p < 0.001.
Figure 2.
Figure 2.. Microglia in the TIME of GBM is associated with an immunosuppressive milieu
(A) A schematic model to describe intracranial glioma xenograft establishment. Primary microglia were pretreated by H2O2 (500 µM) in the absence or presence of NAC (5 mM) for 12 hours. Glioma cells (GL261-luc, 2×10⁵ cells; CT2A-luc, 2×10⁴ cells) incubated with conditional medium of pretreated primary microglia cells for 12 hours. Treated glioma cells and treated primary microglia (1:1) were inoculated together into the frontal region of cerebral cortex. In vivo bioluminescence-based imaging was conducted on day 10–14 after orthotopic injection. (B) Representative in vivo bioluminescence-based images and Hematoxylin and Eosin (H&E) staining of GL261-luc glioma-bearing C57BL/6J mice in respective group. Scale bars, 2 mm. (C) Quantification of tumor volume based on bioluminescence in respective group (n=5 per group). (D) Survival curves of C57BL/6J mice implanted with GL261-luc in five groups (n=5 per group). (E, F) Representative in vivo bioluminescence-based images (E) of CT2A-luc glioma-bearing C57BL/6J mice and quantification (F) of tumor volume based on bioluminescence (n≥4 per group). (G) Survival curves of C57BL/6J mice implanted with CT2A-luc in five groups (n=6 per group). (H) A schematic model to describe establishment of intracranial tumor xenograft followed by flow cytometry analysis for tumor infiltrating T cells on day 14 after orthotopic injection. (I-K) Flow cytometry analysis to evaluate the abundance of infiltrated CD8+ T cells and CD4+ T cells of glioma in respective groups (I). Quantification of CD8+ T cells (J) and CD4+ T cells (K) in CD45+ T cells (n=3 per group). (L-N) Flow cytometry analysis to evaluate the expression of PD1 in CD8+ T cells with respective treatment (L). Quantification of PD1 (M) and IFN-γ (N) levels in CD8+ T cells (n=3 per group). (O-P) Flow cytometry analysis to evaluate the abundance of infiltrated CD8+ T cells and CD4+ T cells levels (O), PD1 and IFN-γ (P) levels in CD8+ T cells of CT2A-luc glioma in respective groups (n=3 per group). Data are shown as mean ± SEM. In (D) and (G), survival difference was calculated by log-rank test; in (C), (F), (J), (K), (M), (N), (O) and (P), P value was calculated using one-way ANOVA analysis. *p < 0.05, **p < 0.01, ***p < 0.001.
Figure 3.
Figure 3.. Microglia are alternatively activated and their antigen-presenting capacities for CD8+ T cells were decreased
(A) A schematic model to describe antigen presentation experiment. Primary microglia were treated by H2O2 (500 µM) in the absence or presence of NAC (5 mM) for 12 hours. Treated microglia was cultured with GL261-OVA cells (1:1) for 12 hours. Microglia purified by microbeads were co-cultured with CD8+ T cells (1:10) of OT-I mice for 48 hours. (B, C) Flow cytometry plot to evaluate T cell proliferation (B). IFN-γ and TNF-α were enumerated by ELISA. Statistical data are shown (C). (D) Flow cytometry analysis of MHC-I expression in primary microglia treated with H2O2 (500 µM) in the absence or presence of NAC (5 mM) for 12 hours. Statistical data are shown (n=3 per group). (E) A schematic model to describe flow cytometry analysis of microglia from glioma tissue. Treated glioma cells and treated primary microglia (2×10⁵ cells, 1:1) were inoculated together into the frontal region of cerebral cortex. Flow cytometry analysis was conducted on day 14 after orthotopic injection. CD11b+CD45low cells were identified as microglia. (F-I) Flow cytometry analysis of CD206 (F) and CD86 (H) in microglia (CD11b+CD45low) of tumor tissue from glioma-bearing mice. Proportions of CD206+ cells (G) and CD86+ cells (I) in microglia were shown. (J) A schematic model that assess the impact of microglial oxidative stress on PD1 expression in CD8+ T cells in vitro. Primary microglia were treated by H2O2 (500 µM) in the absence or presence of NAC (5 mM) for 12 hours. CD8+ T cells from OT-I mice were cocultured with pre-treated microglia (10:1) pulsed with OVA peptide for 24 hours. (K, L) Flow cytometry plot (K) and quantification (L) of PD1 expression in CD8+ T cells with respective treatment (n=3 per group). Data are shown as mean ± SEM. In (C), (D), (G), (I) and (L), P value was calculated using one-way ANOVA analysis. *p < 0.05, **p < 0.01, ***p < 0.001.
Figure 4.
Figure 4.. Systems biology analysis identifies NR4A2 as the master regulator for immunosuppressive functions of oxidative stress-challenged microglia
(A) The correlation with the up-regulated DEGs of BV2 cells after H2O2 treatment (500 µM, 12h) was established using ChIP-seq enrichment using the TRANSFAC and JASPAR databases in Enrichr, covering 15 transcription factors (TFs) and their possible targets. Among them two TFs were druggable (red). Predicted genes regulated by the TFs were shown according to their differential expression after H2O2 treatment. (B) Statistical significance of overrepresentation of a TF’s regulon for up-regulated genes vs. statistical significance of predicted DEG targets regulated by TF. The size and color of each dot represented fold change of TF and druggable/undruggable, respectively. (C) Expression levels of two druggable TFs, Nr4a2 and Hnf4α, in primary microglia treated with H2O2 (500 µM) (n=3 per group). (D-E) FPKM expression values for NR4A2 in BV2 after H2O2 treatment and control (D). FPKM expression values for NR4A2 in primary microglia from surrounding healthy parenchyma and tumor of glioma bearing C57BL/6J mice (E). (F-H) t-SNE plots showing distribution of Nr4a2 by single cell RNA sequencing in published GBM datasets (GSE84465 (F) and GSE 162631 (H)) and our GL261 scRNA seq in this study(G). (I-J) Immunofluorescence staining for NR4A2 on primary microglia cultured on glass coverslips. Scale bars, 20 μm (I). Quantification of marker-positive cell fractions (J). (K) Western blotting analysis of NR4A2 protein levels in the nucleus, the cytoplasm and total cell lysates of microglia treated with H2O2 (500 μM) in the absence or presence of NAC (5 mM) for 24 hours (n=3 per group). (L) Correlation between percentage of NR4A2+ IBA1+ microglia and 8-OHdG+ IBA1+ microglia (Left) or number of CD8+ T cells and NR4A2+ IBA1+ microglia in each vision field of glioma patient brain sections (n≥30 vision fields). (M) Primary microglia were transfected by siNr4a2 for 48 hours. Nr4a2-knockdown microglia treated with H2O2 (500 µM) in the absence or presence of NAC (5 mM) for 12 hours. Flow cytometry plot to evaluate the expression of PD1 in CD8+ T cells cocultured with treated Nr4a2-knockdown microglia pulsed with OVA peptide (above). Flow cytometry plot of MHC-I expression in treated Nr4a2-knockdown microglia (below). (N-P) Effects of Nr4a2 knockdown on the antigen presentation capacities of microglia for CD8+ T cells. Primary microglia transfected with siNr4a2 for 48 hours was treated with H2O2 (500 µM) in the absence or presence of NAC (5 mM) for 12 hours. Treated microglia was cultured with GL261-OVA cells (1:1) for 12 hours. Microglia purified by microbeads were co-cultured with CD8+ T cells (1:10) of OT-I mice for 48 hours. Flow cytometry plot to evaluate T cell proliferation (N). IFN-γ (O) and TNF-α (P) were measured by ELISA. (Q) mRNA levels of Nr4a2 in primary microglia treated with Bay-11-7082 compared with control cells with or without H2O2 challenge. (R) Representative in vivo bioluminescence-based images and H&E staining of GL261-luc-bearing C57BL/6J mice treated by Bay-11-7082 and control. Bay-11-7082 was given intraperitoneally at a dose of 25 mg/kg per mouse every 2 days on day 3 after tumor inoculation. Scale bars, 2 mm. (S) Survival curves of C57BL/6J mice implanted with GL261-luc (2×10⁴ cells) in each treatment group (n=6 per group). In (L), coefficient of determination (r) and statistical significance levels were determined by linear regression with linear model method. Data are shown as mean ± SEM. In (C-E), P value was calculated using the two-tailed Student’s t test. In (J), (O), (P) and (Q), P value was calculated using one-way ANOVA analysis. In (S), survival difference was calculated by log-rank test. *p < 0.05, **p < 0.01, ***p < 0.001.
Figure 5.
Figure 5.. NR4A2 transcriptionally regulates downstream cholesterol metabolic alterations in microglia of GBM
(A) Hockey stick plot showing potential target genes regulated by Nr4a2 in microglia ranked by “microglia specificity score,” which depended on number of gained Nr4a2 peaks in microglia compared to input and the fold change mRNA difference of down-regulated genes in Nr4a2 knockdown microglia. (B) Pathway enrichment bubble plot shows gene sets enriched among potential target genes regulated by Nr4a2. (C) Venn diagram showing the overlapping genes which were upregulated after oxidative stress challenge, downregulated after Nr4a2-knockdown and bound by Nr4a2 at the promoter regions in microglia. (D) mRNA levels of Nr4a2 and 3 potential Nr4a2 target genes, Sqle, Hmga1 and Tagap1, in primary microglia transfected with siNr4a2, compared with control. (E) A schematic model to illustrate the establishment of Nr4a2 genetic KO mice using CRISPR-CAS9 strategies. (F) Fluorescence-activated cell sorting strategy to purify microglia from the brain of Nr4a2+/− mice and control mice. (G) mRNA levels of Nr4a2 and Sqle in primary microglia in respective group. (H) ChIP-qPCR analysis of selected Nr4a2 binding sites on the promoter of Sqle gene. ChIP-qPCR was used to amplify chromatin derived from immunoprecipitations with anti-Nr4a2 antibody (n=5 per group). (I, J) Dual luciferase assay interaction between Nr4a2 and the respective promoter region of Sqle. (K) Western blotting analysis of SQLE protein levels in microglia treated with H2O2 (500 µM) in the absence or presence of NAC (5 mM) for 24 hours, or transfected with siNr4a2 for 48 hours. (L-M) Immunofluorescence co-staining for IBA1, NR4A2 and SQLE on glioma tissues and nonneoplastic tissues of glioma (L). Scale bars, 50 μm. Quantification of SQLE+NR4A2+ microglia levels in respective group (M). (N) Expression levels of Sqle, immune activation marker (IL-6 and Nos2) and immune suppression marker (Arg-1 and IL-10) in primary microglia treated with H2O2 (500 µM) in the absence or presence of NB-598, compared with control cells. Data are shown as mean ± SEM. In (D), (G), (H), (I), (J) and (M), P value was calculated using the two-tailed Student’s t test. In (N), P value was calculated using one-way ANOVA analysis. *p < 0.05, **p < 0.01, ***p < 0.001.
Figure 6.
Figure 6.. Microglia-specific knockout of Nr4a2 reverses alternative activation and improves antigen presentation capacities of microglia in GBM
(A, B) Microglia-specific deletion of Nr4a2 in mice (Nr4a2ΔMCs/ΔMCs or Nr4a2fl/flCx3cr1cre). Floxed Nr4a2 (Nr4a2LoxP/LoxP) mice were bred with mice expressing microglia-specific Cx3cr1-cre to generate Nr4a2fl/flCx3cr1cre mice (A). Tumor size, T cell functions and antigen presentation capacities of microglia were compared in respective group after inoculation of GL261-luc cells (B). (C, D) Immunofluorescence staining for IBA1 and NR4A2 on the brain sections of Nr4a2fl/flCx3cr1cre and Nr4a2fl/fl GL261-luc-bearing mice (C). Scale bars, 50 μm. Proportions of NR4A2+ IBA1+ cells in respective group were shown (D). (E, F) Representative in vivo bioluminescence-based images of GL261-luc (2×10⁴ cells) bearing Nr4a2fl/flCx3cr1cre and Nr4a2fl/fl mice (E). Quantification of tumor volume based on bioluminescence (F) (n≥3 per group). (G) Survival curve of Nr4a2fl/flCx3cr1cre and Nr4a2fl/fl mice inoculated with GL261-luc cells (n=6 per group). (H, I) Immunofluorescence staining for IBA1 and SQLE on the brain sections of Nr4a2fl/flCx3cr1cre and Nr4a2fl/fl GL261-luc-bearing mice (H). Scale bars, 50 μm. Proportions of SQLE+IBA1+ cells were shown (I). (J-L) Immunofluorescence staining for CD206 of microglia on glioma or peritumor tissues of Nr4a2fl/fl (J) and Nr4a2fl/flCx3cr1cre GL261-luc-bearing mice (K). Scale bars, 50 μm. Proportions of CD206+IBA1+ cells were shown (L). (M) Flow cytometry analysis to examine antigen presentation capacities of microglia as well as cytotoxic functions and immune checkpoint molecule expressions of CD8+ T cells in glioma tissues from Nr4a2fl/flCx3cr1cre and Nr4a2fl/fl GL261-bearing mice. (N) Survival curves of Nr4a2fl/fl and Nr4a2fl/flCx3cr1cre glioma-bearing mice (2×10⁴ cells) in the absence or presence of αCD8 treatment. Anti-CD8 mAbs were given intraperitoneally at a dose of 800 µg per mouse twice a week on day 0 after tumor inoculation (n=6 per group). (O-Q) Representative in vivo bioluminescence-based images of GL261-luc (2×10⁴ cells) bearing Nr4a2+/− and control mice (O). Quantification of tumor volume based on bioluminescence in each group (P). Survival curves of each group were shown (Q) (n=6 per group). Data are shown as mean ± SEM. In (D), (F), (I), (M) and (P), P value was calculated using the two-tailed Student’s t test. In (L), P value was calculated using one-way ANOVA analysis. In (G), (N) and (P), survival difference was calculated by log-rank test. *p < 0.05, **p < 0.01, ***p < 0.001.
Figure 7.
Figure 7.. Synergistic therapeutic efficacy of NR4A2/SQLE axis inhibition and immune checkpoint blockade therapy and oxidative stress-NR4A2-SQLE axis as a predictor of poor prognosis in glioma patients
(A) Flow cytometry analysis to examine CD8+ T cells, immune checkpoint molecules of CD8+ T cells in GL261-luc-bearing C57BL/6J mice with combination treatment of Bay-11-7082 and αPD1. (B, C) Flow cytometry analysis to examine immune checkpoint molecules of CD8+ T cells in GL261-luc-bearing C57BL/6J mice with combination treatment of terbinafine and αPD1 (B). Quantification of percentage of CD8+ T cells that express each immune checkpoint molecule was shown (C). (D-E) Representative in vivo bioluminescence-based images of GL261-luc-bearing C57BL/6J mice (2×10⁵ cells) with αPD1 in the absence or presence of Bay-11-7082. Bay-11-7082 was given intraperitoneally at a dose of 25 mg/kg per mouse every 2 days on day 3 after tumor inoculation. αPD1 was given intraperitoneally at a dose of 200 µg per mouse every 2 days on day 3 after tumor cell implantation (D). Survival curves of each group were shown (E). (n=4 to 6 per group). (F-G) Representative in vivo bioluminescence-based images of GL261-luc-bearing C57BL/6J mice (2×10⁵ cells) with αPD1 in the absence or presence of Terbinafine. Terbinafine was given by oral gavage at a dose of 560 mg/kg per mouse every 2 days on day 3 after tumor inoculation. αPD1 was given intraperitoneally at a dose of 200 µg per mouse every 2 days on day 3 after tumor cell implantation (F). Survival curves of each group were shown (G) (n=3 to 6 per group). (H) Kaplan-Meier analysis of glioma patients based on a tissue microarray of 125 individuals. According to immunofluorescence staining for oxidative stress marker (8-OHdG) and microglia maker (IBA1) on glioma tissues, glioma patients were stratified into two groups: 8-OHdG+ microgliahigh patients and 8-OHdG+ microglialow patients. Left, all glioma patients (n=125), middle, grade I/II glioma patients (n=77) and right, grade III/IV glioma patients (n=48), respectively. (I) Quantification of 8-OHdG+Iba1+ microglia in grade I/II and grade III/IV glioma patients, respectively. (J) Analysis of ROS in live primary microglia marked with CD45 and CD11b antibodies by flow cytometry in glioma tissues and brain tissues of peritumoral area. FITC signals represent ROS production. (K, L) Immunofluorescence staining for oxidative stress marker (8-OHdG) and microglia maker (IBA1) on glioma tissues and nonneoplastic tissues in glioma patients Scale bars, 50 μm. Quantification of 8-OHdG+ microglia levels in respective group. Data are shown as mean ± SEM. In (A) and (C), P value was calculated using one-way ANOVA analysis. In (I) and (L), P value was calculated using the two-tailed Student’s t test. In (E), (G) and (H), survival difference was calculated by log-rank test. *p < 0.05, **p < 0.01, ***p < 0.001.

References

    1. Ostrom QT, Gittleman H, Liao P, Vecchione-Koval T, Wolinsky Y, Kruchko C, et al. CBTRUS Statistical Report: Primary brain and other central nervous system tumors diagnosed in the United States in 2010–2014. Neuro Oncol 2017;19:v1–v88. - PMC - PubMed
    1. Weller M, Wick W, Aldape K, Brada M, Berger M, Pfister SM, et al. Glioma. Nat Rev Dis Primers 2015;1:15017. - PubMed
    1. Stupp R, Hegi ME, Mason WP, Van-Den-Bent MJ, Taphoorn MJ, Janzer RC, et al. Effects of radiotherapy with concomitant and adjuvant temozolomide versus radiotherapy alone on survival in glioblastoma in a randomised phase III study: 5-year analysis of the EORTC-NCIC trial. Lancet Oncol 2009;10:459–66. - PubMed
    1. Lee EQ, Kaley TJ, Duda DG, Schiff D, Lassman AB, Wong ET, et al. A multicenter, phase II, randomized, noncomparative clinical trial of radiation and temozolomide with or without vandetanib in newly diagnosed glioblastoma patients. Clin Cancer Res 2015;21:3610–8. - PMC - PubMed
    1. Lu-Emerson C, Duda DG, Emblem KE, Taylor JW, Gerstner ER, Loeffler JS, et al. Lessons from anti-vascular endothelial growth factor and anti-vascular endothelial growth factor receptor trials in patients with glioblastoma. J Clin Oncol 2015;33:1197–213. - PMC - PubMed

Publication types

Substances