. 2023 May 9;7(9):1739-1753.
doi: 10.1182/bloodadvances.2022008498.

Kindlin-3 deficiency leads to impaired erythropoiesis and erythrocyte cytoskeleton

Affiliations

Kindlin-3 deficiency leads to impaired erythropoiesis and erythrocyte cytoskeleton

Dorota Szpak et al. Blood Adv. .

Abstract

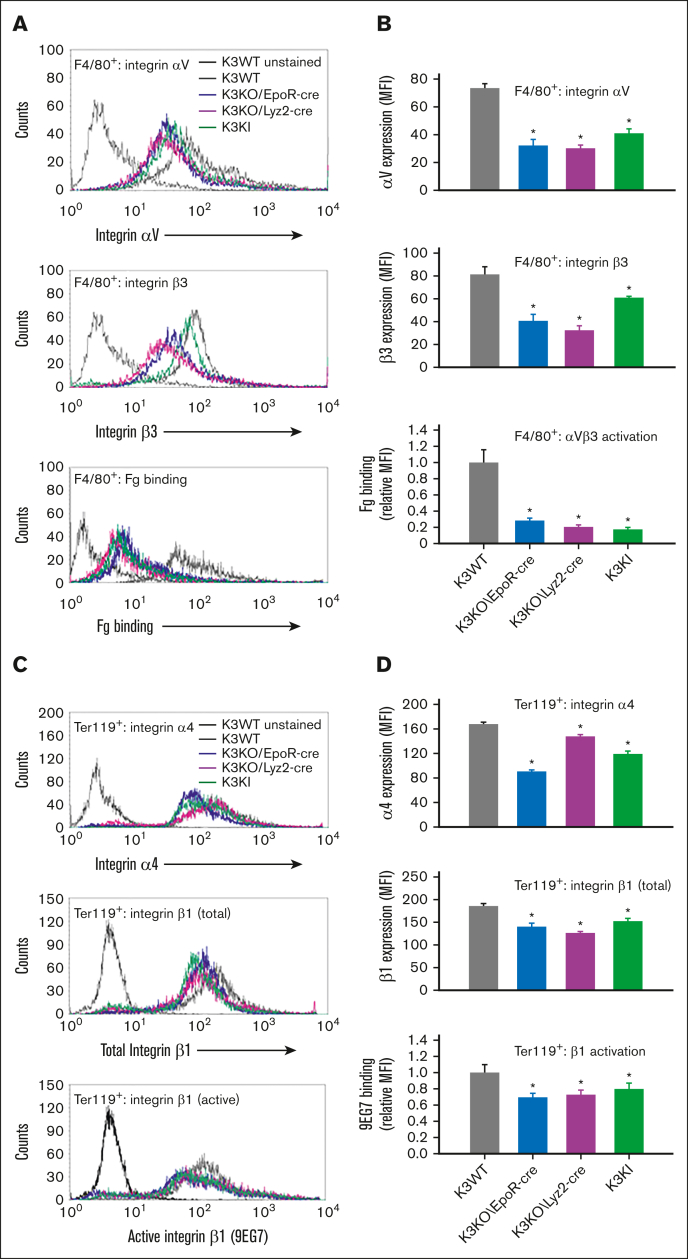
Kindlin-3 (K3) is critical for the activation of integrin adhesion receptors in hematopoietic cells. In humans and mice, K3 deficiency is associated with impaired immunity and bone development, bleeding, and aberrant erythrocyte shape. To delineate how K3 deficiency (K3KO) contributes to anemia and misshaped erythrocytes, mice deficient in erythroid (K3KO∖EpoR-cre) or myeloid cell K3 (K3KO∖Lyz2cre), knockin mice expressing mutant K3 (Q597W598 to AA) with reduced integrin-activation function (K3KI), and control wild-type (WT) K3 mice were studied. Both K3-deficient strains and K3KI mice showed anemia at baseline, reduced response to erythropoietin stimulation, and compromised recovery after phenylhydrazine (PHZ)-induced hemolytic anemia as compared with K3WT. Erythroid K3KO and K3 (Q597W598 to AA) showed arrested erythroid differentiation at proerythroblast stage, whereas macrophage K3KO showed decreased erythroblast numbers at all developmental stages of terminal erythroid differentiation because of reduced erythroblastic island (EBI) formation attributable to decreased expression and activation of erythroblast integrin α4β1 and macrophage αVβ3. Peripheral blood smears of K3KO∖EpoR-cre mice, but not of the other mouse strains, showed numerous aberrant tear drop-shaped erythrocytes. K3 deficiency in these erythrocytes led to disorganized actin cytoskeleton, reduced deformability, and increased osmotic fragility. Mechanistically, K3 directly interacted with F-actin through an actin-binding site K3-LK48. Taken together, these findings document that erythroid and macrophage K3 are critical contributors to erythropoiesis in an integrin-dependent manner, whereas F-actin binding to K3 maintains the membrane cytoskeletal integrity and erythrocyte biconcave shape. The dual function of K3 in erythrocytes and in EBIs establish an important functional role for K3 in normal erythroid function.


Conflict of interest statement

Conflict-of-interest disclosure: The authors declare no competing financial interests.

Figures

None
Graphical abstract
Figure 1.
Figure 1.
K3 deficiency results in anemia in mice. (A) Summary of experimental mouse strains. (B) Erythroid cells and macrophages were isolated from mouse BM using anti-Ter119 and anti-F4/80 beads, respectively, and K3 expression was determined on western blots probed with anti-K3 Ab, using anti-GAPDH as a loading control. Images are representative of 4 mice per strain. (C) Comparison of several hematologic parameters of mouse peripheral blood at baseline. (D) Comparison of RBC and Hb recovery in mice in response to PHZ-induced hemolytic anemia. (E) Comparison of RBC and Hb levels in mice during EPO-induced erythropoiesis. The data were acquired by Advia 120 Hematology System and are mean ± SD; mutant vs K3WT mice; ∗P < .05; n = 10 mice per group.
Figure 2.
Figure 2.
K3 is crucial for EBI formation and EB maturation in the BM. (A) Total BM cells per femur. ∗P < .05; K3 mutant vs K3WT strains; n = 5 mice per strain. (B) Flow cytometric analysis of BM EB populations. Representative histograms of Ter119+ erythroid cells (top), which were further divided to EB progenitor populations I to VI, based on their size (forward side scatter) and CD44 expression (bottom). (C) Statistical comparison of erythroid Ter119+ cell quantity in mouse BM expressed as a percentage of BM cells, as shown in panel A (top). ∗P < .05; K3 mutant vs K3WT strains; n = 5 mice per group. (D) Statistical comparison of cell quantities at each stage of erythroid differentiation expressed as a percentage of Ter119+ cells. ∗P <.05; ∗∗P < .01; K3 mutant vs K3WT strains, n = 5 mice per group. (E) Representative images of reconstituted EBIs from single-cell suspensions of mouse BM labeled for macrophage Alexa Fluor-488 F4/80 (green) and erythroid Alexa Fluor 568-Ter-119 (red). The images were acquired using a Leica DM2500 confocal microscope with an ACS APO 63×/1.30 oil objective lens and the LAS-X software. The images were processed with Adobe Photoshop CC; scale bar, 23 μm. (F) Numbers of EBIs per field formed from mouse BM single-cell suspensions as described in “Materials and Methods.” ∗P < .01; K3 mutant vs K3WT strains; n = 10 mice per strain. (G) Representative images of BM smears stained for erythroid Ter119 (red-Alexa Fluor 568) and macrophage F4/80 (green-Alexa Fluor 488) markers. The images were taken with a Leica DM2500 confocal microscope equipped with an ACS APO 10×/0.3 objective lens and the LAS-X software, and processed using the Adobe Photoshop CC software; scale bar, 146 μm. (H) Representative histograms of F4/80+ macrophages quantified in mouse BM via flow cytometry. (I) Statistical comparison of data shown in panel G. ∗P < .01; K3 mutant vs K3WT strains; n = 5 mice per strain.
Figure 3.
Figure 3.
K3 promotes integrin expression and activation on BM EBs and macrophages. (A) Overlays of representative histograms of fluorescence-activated cell sorter analysis of integrin αV (top) and β3 (middle) expression as well as soluble Fg binding (bottom) to the gated F4/80+ macrophage populations from mouse BM. (B) Statistical comparison of data shown in panel A. ∗P < .001; mutant vs K3WT strains; n = 5 mice per strain. (C) Overlays of representative histograms of fluorescence-activated cell sorter analysis of integrin α4 (top), total β1 (middle), and activated β1 (bottom) expression in the gated Ter119+ erythroid cells from mouse BM. (D) Statistical comparison of data shown in panel C. ∗P < .001; mutant vs K3WT strain; n = 5 mice per strain.
Figure 4.
Figure 4.
K3 is a constituent of erythrocyte junctional complexes, and its deficiency results in poikilocytosis and macrocytosis. (A) Representative images of mouse peripheral blood smears stained with Wright-Giemsa stain. Images were captured with ImageEM C9100-13 EMCCD monochrome camera using a Leica DMI6000 microscope equipped with an oil 40×/1.15 objective and LAS-X software. The images were processed with the Adobe Photoshop 7.0 software. Scale bar, 10 μm. (B) (left) Representative histograms of RBC volume and Hb concentration obtained via an automated complete blood count analysis of K3WT and K3KO/EpoR-cre peripheral blood with an Advia 120 Hematology System; right) the histograms from the left panel plotted as a RBC volume/hemoglobin concentration cytogram, normal K3WT RBCs fall into the central square. (C-F) Statistical comparison of MCV (C), MCHC (D), RDW values (E), and reticulocyte percentages (F) of K3WT and K3KO/EpoR-cre peripheral blood RBCs. ∗P < .001; K3KO∖EpoR-cre vs K3WT mice; n = 7 to 10 mice per group. (G) K3 forms complexes with proteins of erythrocyte junctional complexes. Western blot analysis of proteins coimmunoprecipitated with anti-K3 Ab from lysates of K3WT erythrocyte ghosts. MCHC, mean corpuscular hemoglobin concentration; MCV, mean corpuscular volume; RDW, RBC distribution width.
Figure 5.
Figure 5.
K3 associates with actin and spectrin. (A) Association of K3 with F-actin via cosedimentation. K3 (0.1 μM) or α-actinin (2 μM) or BSA (2 μM) were added to F-actin (1.5 μM) in actin-binding buffer (10 mM Tris-Cl [pH, 7.5], 10 mM NaCl, 50 mM KCl, 2 mM MgCl2, 0.2 mM CaCl2, 1 mM adenosine triphosphate) and incubated for 30 minutes at room temperature followed by separation of pellet (P) and supernatant (S) fractions via ultracentrifugation (150 000 g, 90 minutes, room temperature) and analysis by sodium dodecyl sulfate–polyacrylamide gel electrophoresis. (B) Densitometric analysis of samples as described in panel A. Densitometry of gels from 3 different experiments were performed using Image J software and the data are expressed as percentage of K3, α-actinin, or BSA input. (C) Direct binding of purified recombinant K3 to human platelet actin immobilized on 96-well plates; or (D) erythrocyte spectrin. The bound K3 was detected with anti-K3 using enzyme-linked immunosorbent assay, as described in “Materials and Methods.” The results are mean ± SD. (E) K3 (1-105) interacts with actin but not with spectrin and other proteins of junctional complexes. EGFP-tagged WT and mutant K3 as well as control EGFP were overexpressed in K562 cells differentiated with hemin, and immunopurified with EGFP-trap agarose. The immunoprecipitates were analyzed on western blots with the indicated Abs. Three experiments were performed.
Figure 6.
Figure 6.
K3 maintains normal erythrocyte actin membrane skeleton. (A) Representative western blot analysis of major actin-binding proteins and adducin α phosphorylation in K3WT and K3KO/EpoR-cre erythrocyte ghosts. Samples from 4 different mice are shown. (B) Expression levels of actin-binding proteins in RBC ghosts from panel A, normalized to GAPDH. Densitometry of triplicate western blots was performed using Image J software. ∗P < .001; K3KO∖EpoR-cre vs K3WT mice; n = 12. (C) Densitometric analysis of phospho–adducin α (S724) normalized to total adducin α of triplicate western blots from panel A. ∗P < .001; n = 12. (D) Representative images of pellet (P) and Triton X-100–soluble (supernatant; S) fractions of erythrocyte ghosts from K3WT and K3KO/EpoR-cre mice examined using western blotting for the presence of K3, spectrins, actin, phosphorylated (S724), and total adducin α. Two mice per strain are shown. (E) Relative protein expression levels and phospho–adducin α (S724) in Triton X-100–insoluble and –soluble fractions of K3WT and K3KO/EpoR-cre erythrocytes. Optical density of each protein in Triton X-100–insoluble fraction (P) of K3WT RBC ghosts was assigned the value 1. Densitometric analysis of triplicate western blots for each protein for 3 mice per group was performed using Image J software. ∗P < .01; K3WT vs K3KO/EpoR-cre mice; n = 9. (F) Disorganized actin membrane cytoskeleton in K3KO/EpoR-cre erythrocytes. Adherent to poly-L-lysine K3WT and K3KO/EpoR-cre erythrocytes were stained for F-actin with phalloidin-Alexa Fluor 488 (green) and with anti–band 3 followed by Alexa Fluor 568 goat anti-rabbit immunoglobulin G (red). Images were taken with an HC PL APO 100×/1.47 oil objective using a Leica TCS-SP8-AOBS laser scanning confocal microscope using the LAS-X 3.5.7 software. Images are representative of 7 mice per group (scale bars, 2.5 μm). Arrows point to actin clamps and clusters.
Figure 7.
Figure 7.
K3 deficiency impairs erythrocyte deformability and enhances osmotic fragility. (A,B) Osmotic gradient ektacytometry revealed increased Omin (A) and Ohyper (B) values in K3KO/EpoR-cre erythrocytes. Results are mean ± SD. ∗P < .05; n = 4; representative of 4 independent experiments. (C) Increased osmotic fragility of K3KO/EpoR-cre erythrocytes. Results are mean ± SD. ∗P < .05; n = 5; 3 independent experiments were performed. (D) Microfluidic assessment of erythrocyte deformability reveals an increased occlusion index. Results are expressed as mean ± SD. ∗P <.05; n = 5.

References

    1. Moser M, Legate KR, Zent R, Fassler R. The tail of integrins, talin, and kindlins. Science. 2009;324(5929):895–899. - PubMed
    1. Plow EF, Qin J. The kindlin family of adapter proteins. Circ Res. 2019;124(2):202–204. - PMC - PubMed
    1. Rognoni E, Ruppert R, Fassler R. The kindlin family: functions, signaling properties and implications for human disease. J Cell Sci. 2016;129(1):17–27. - PubMed
    1. Meller J, Rogozin IB, Poliakov E, et al. Emergence and subsequent functional specialization of kindlins during evolution of cell adhesiveness. Mol Biol Cell. 2015;26(4):786–796. - PMC - PubMed
    1. Malinin NL, Pluskota E, Byzova TV. Integrin signaling in vascular function. Curr Opin Hematol. 2012;19(3):206–211. - PMC - PubMed

Publication types