. 2023 Feb 22;20(1):10.1088/1741-2552/acb3fd.
doi: 10.1088/1741-2552/acb3fd.

Spatially selective stimulation of the pig vagus nerve to modulate target effect versus side effect

Affiliations

Spatially selective stimulation of the pig vagus nerve to modulate target effect versus side effect

Stephan L Blanz et al. J Neural Eng. .

Abstract

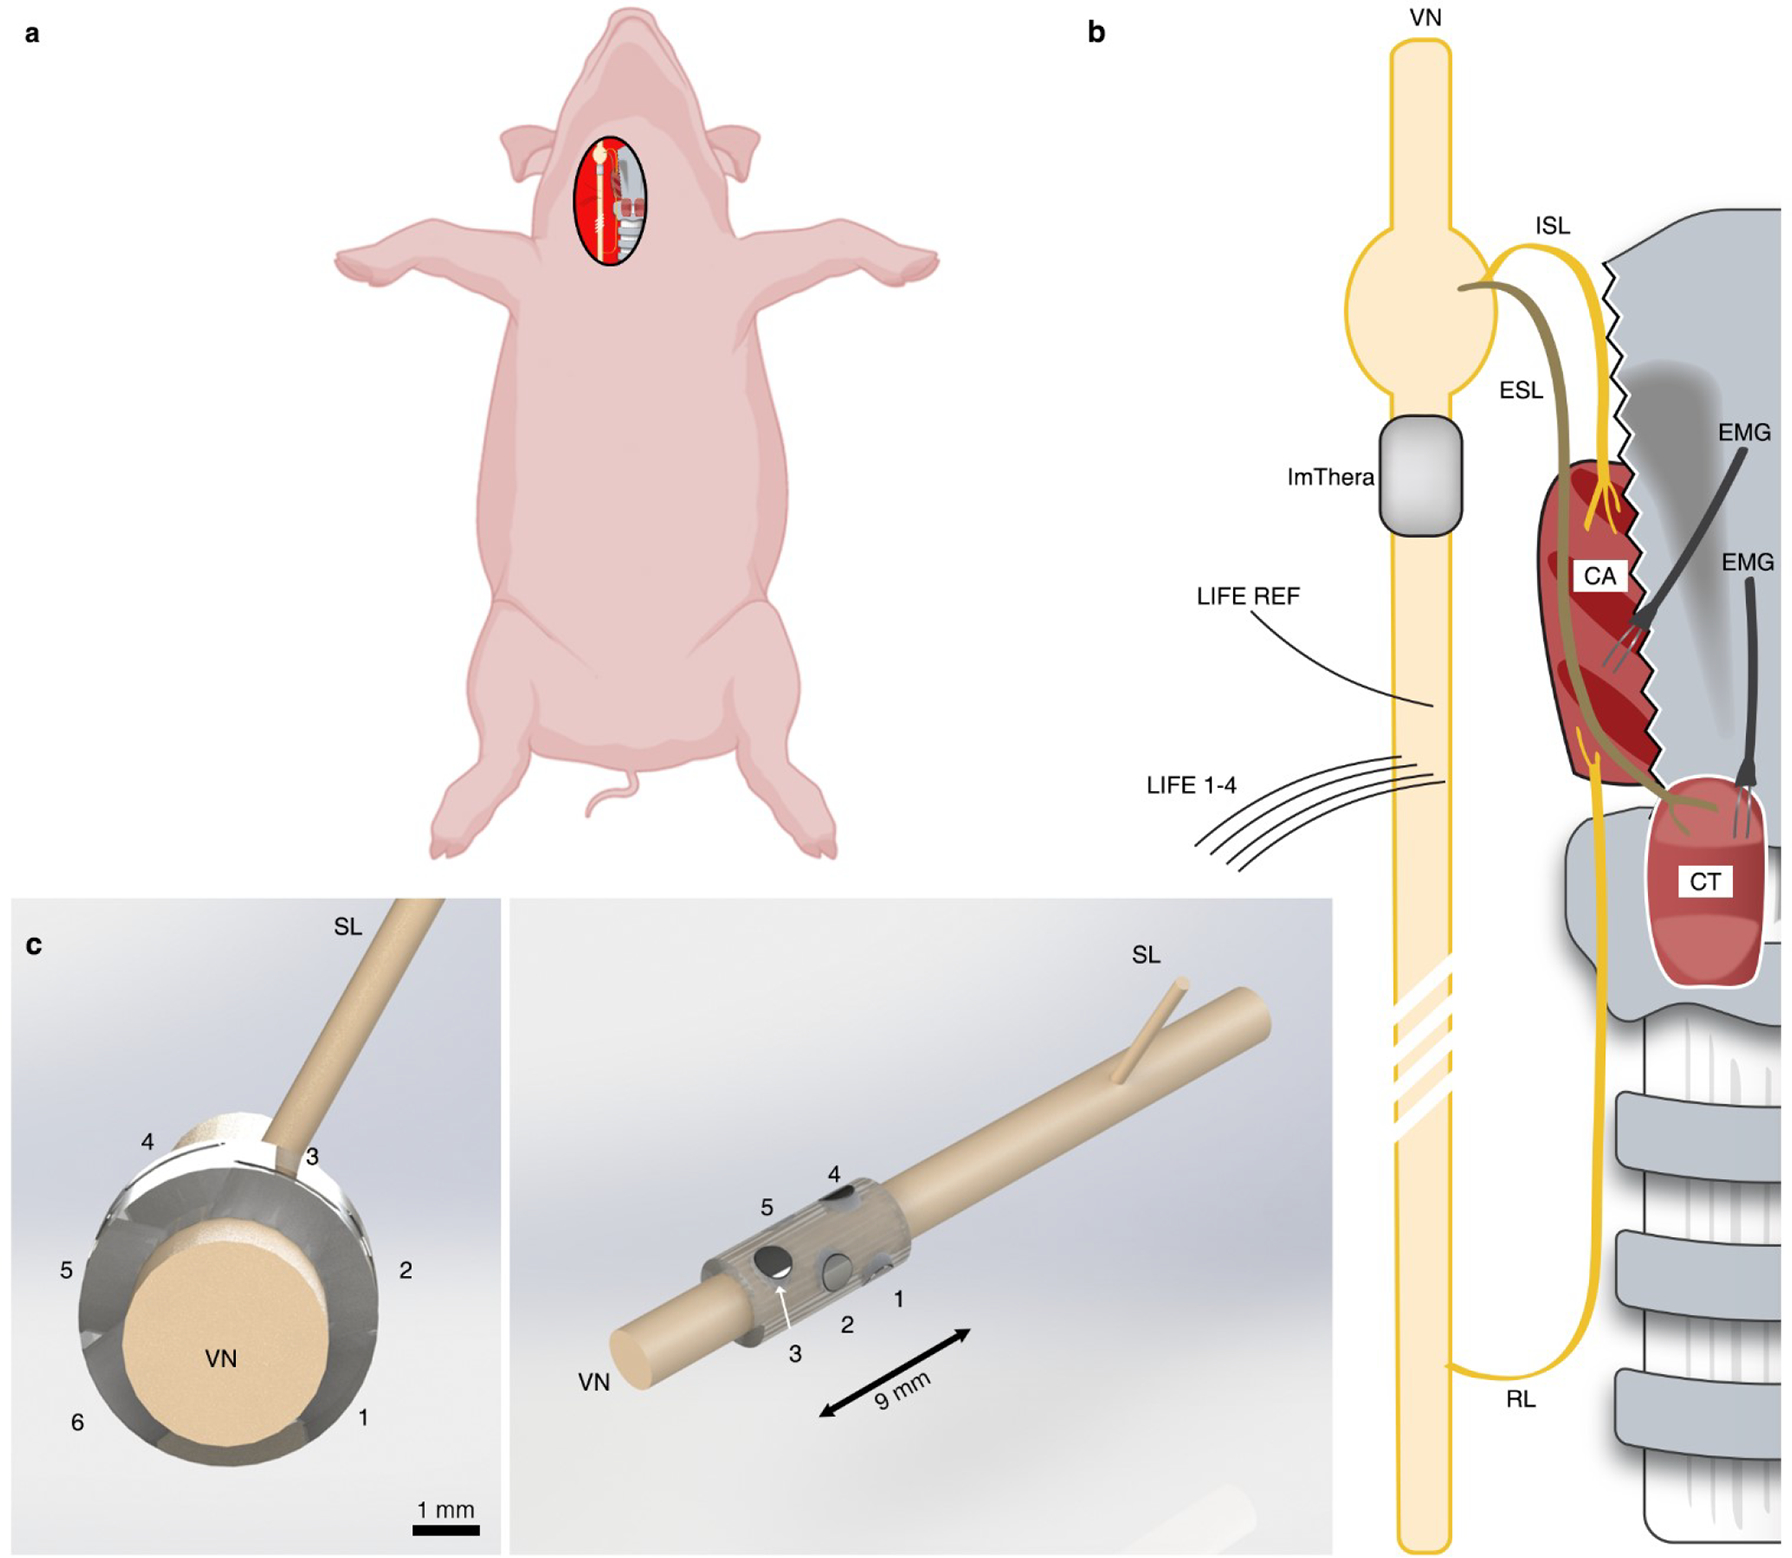
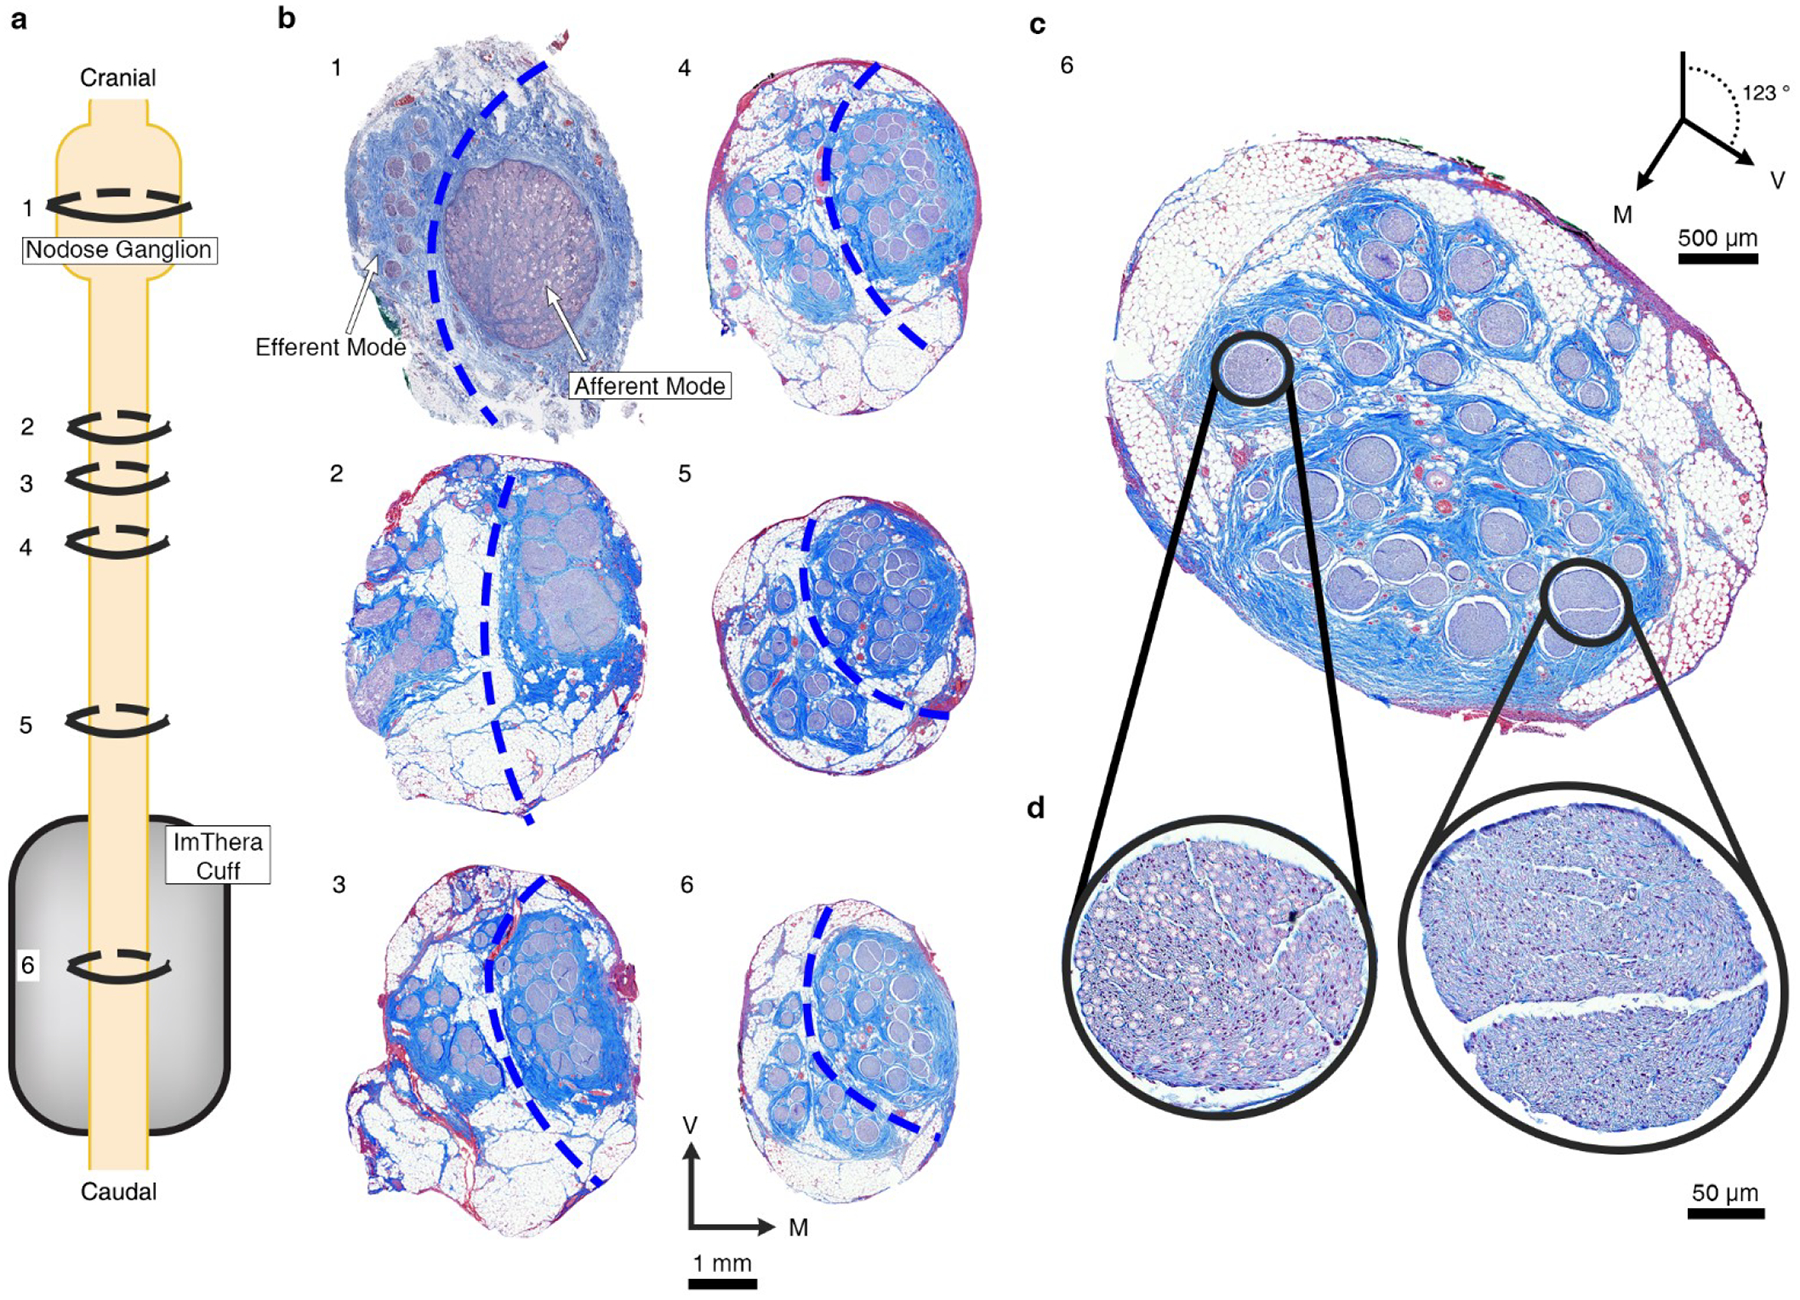
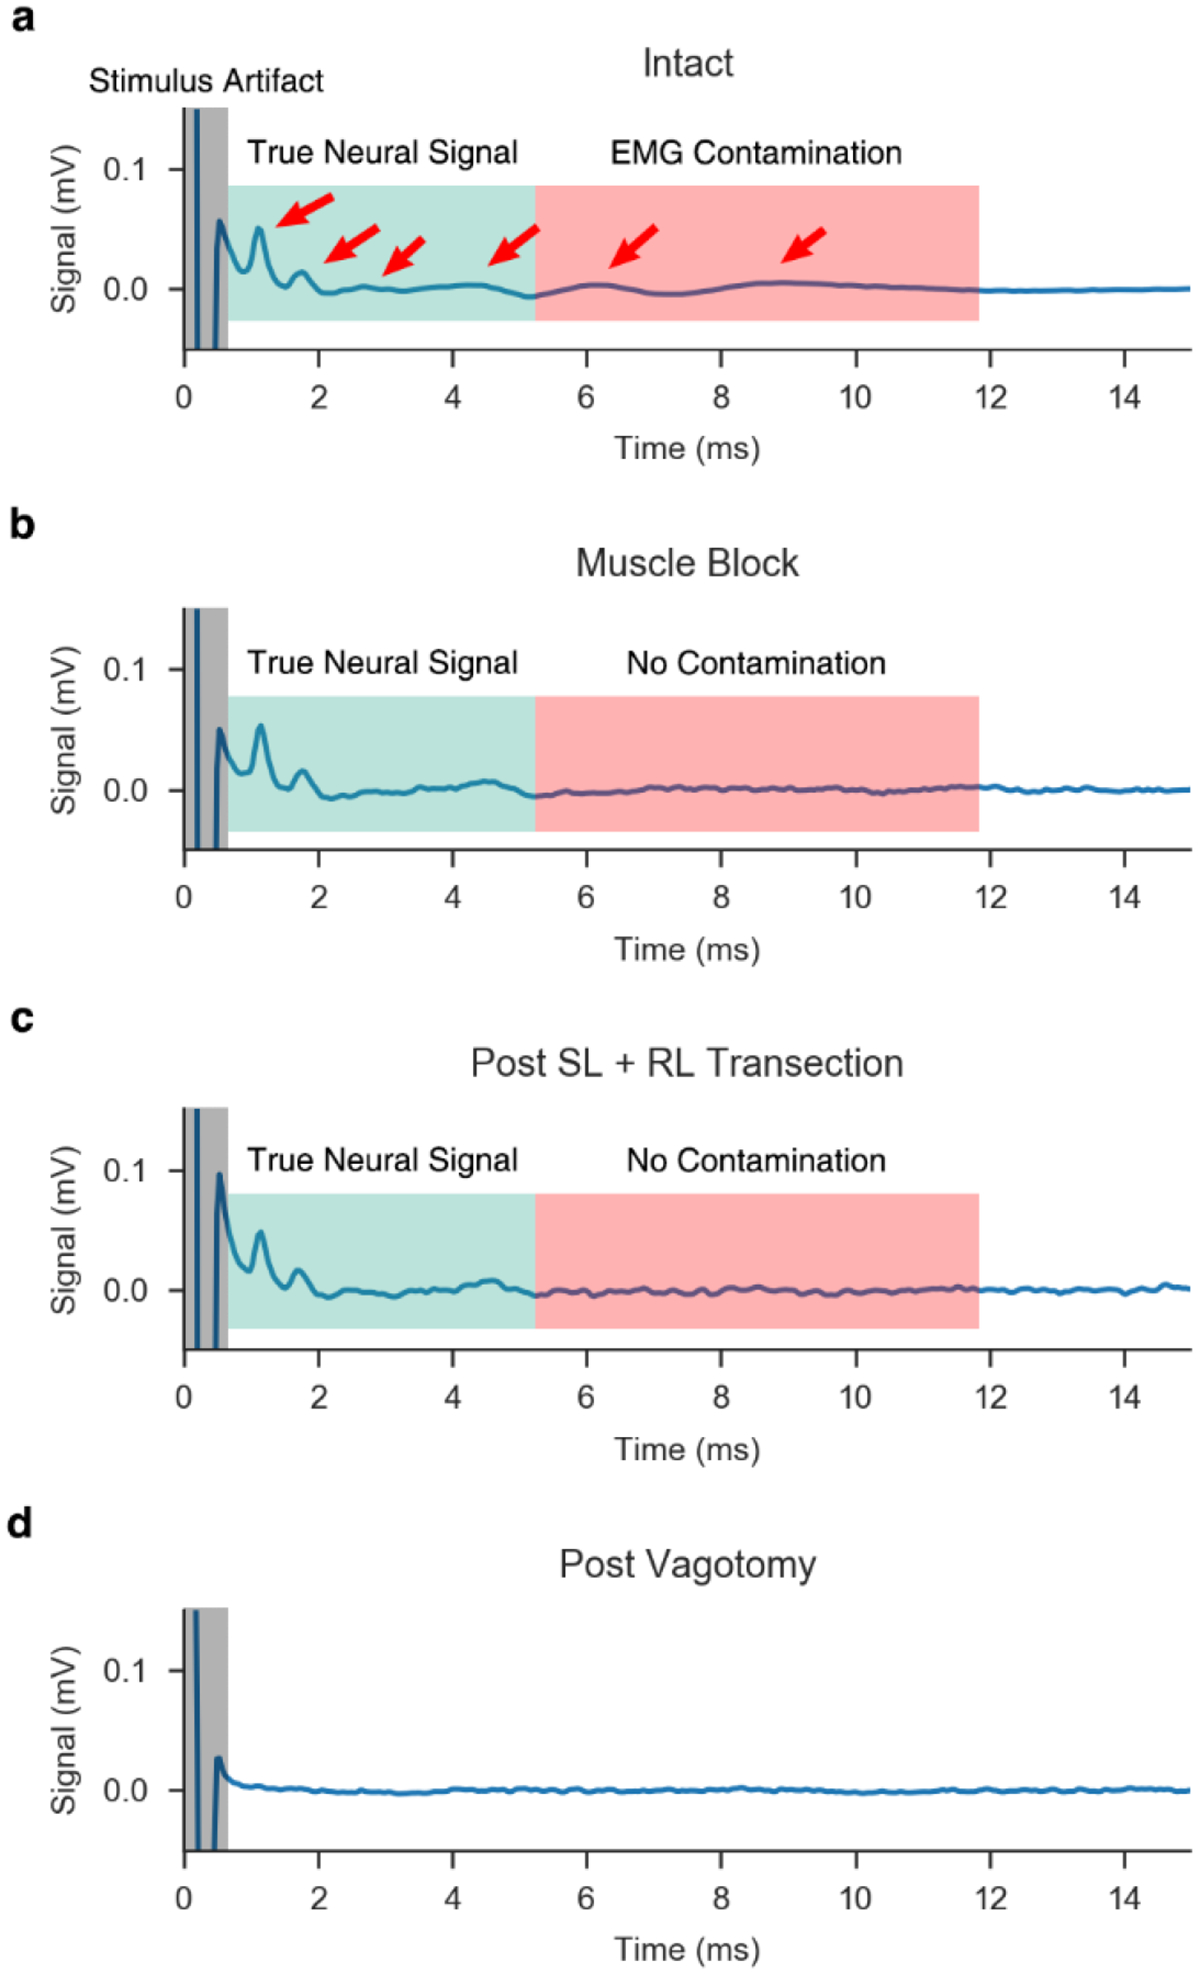
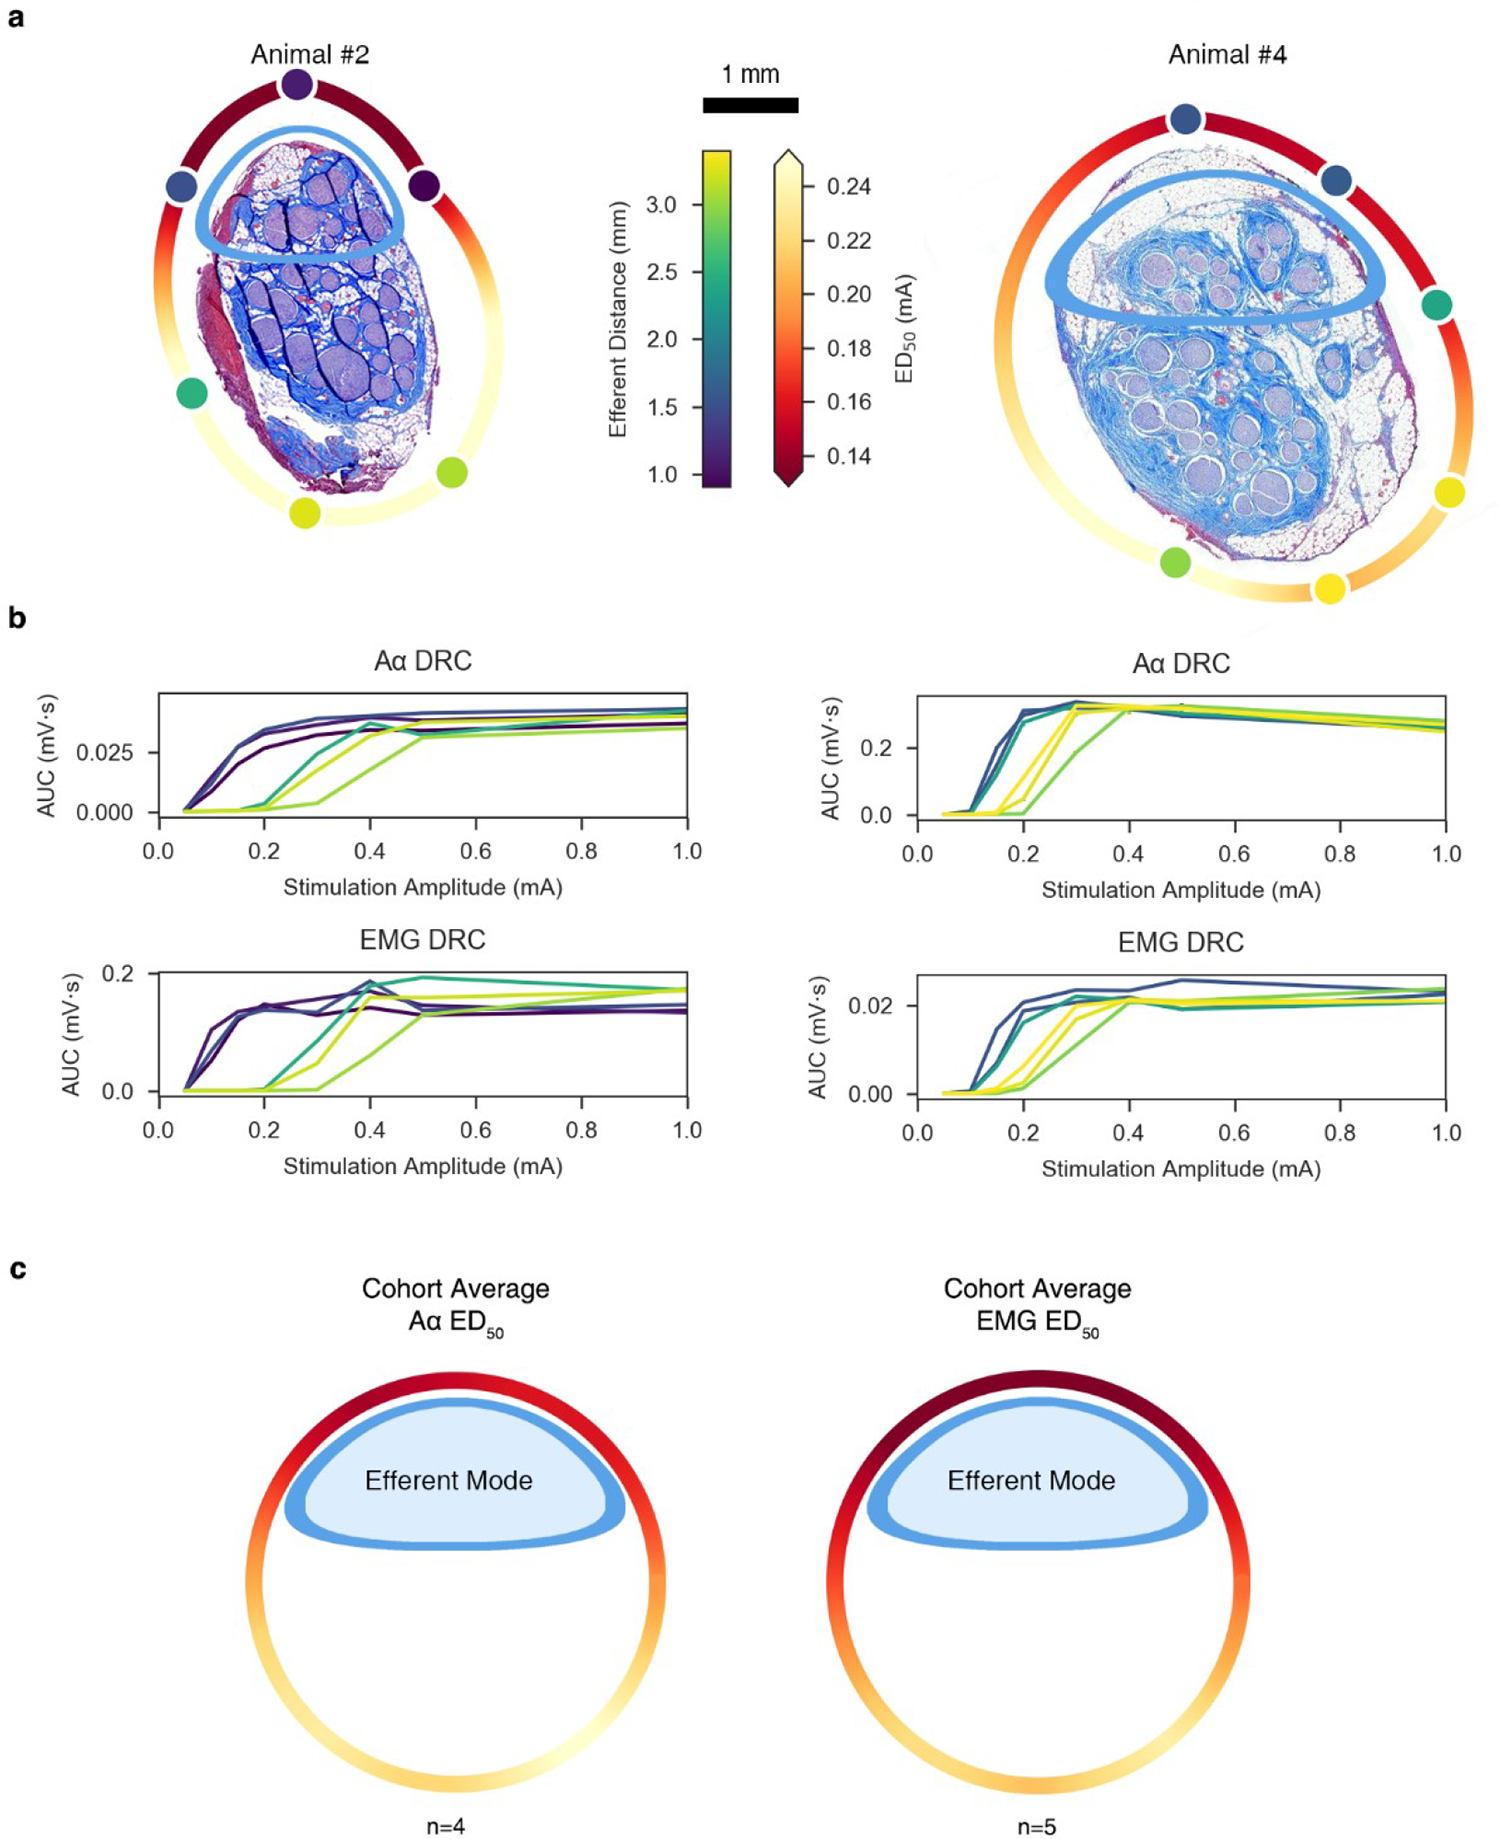
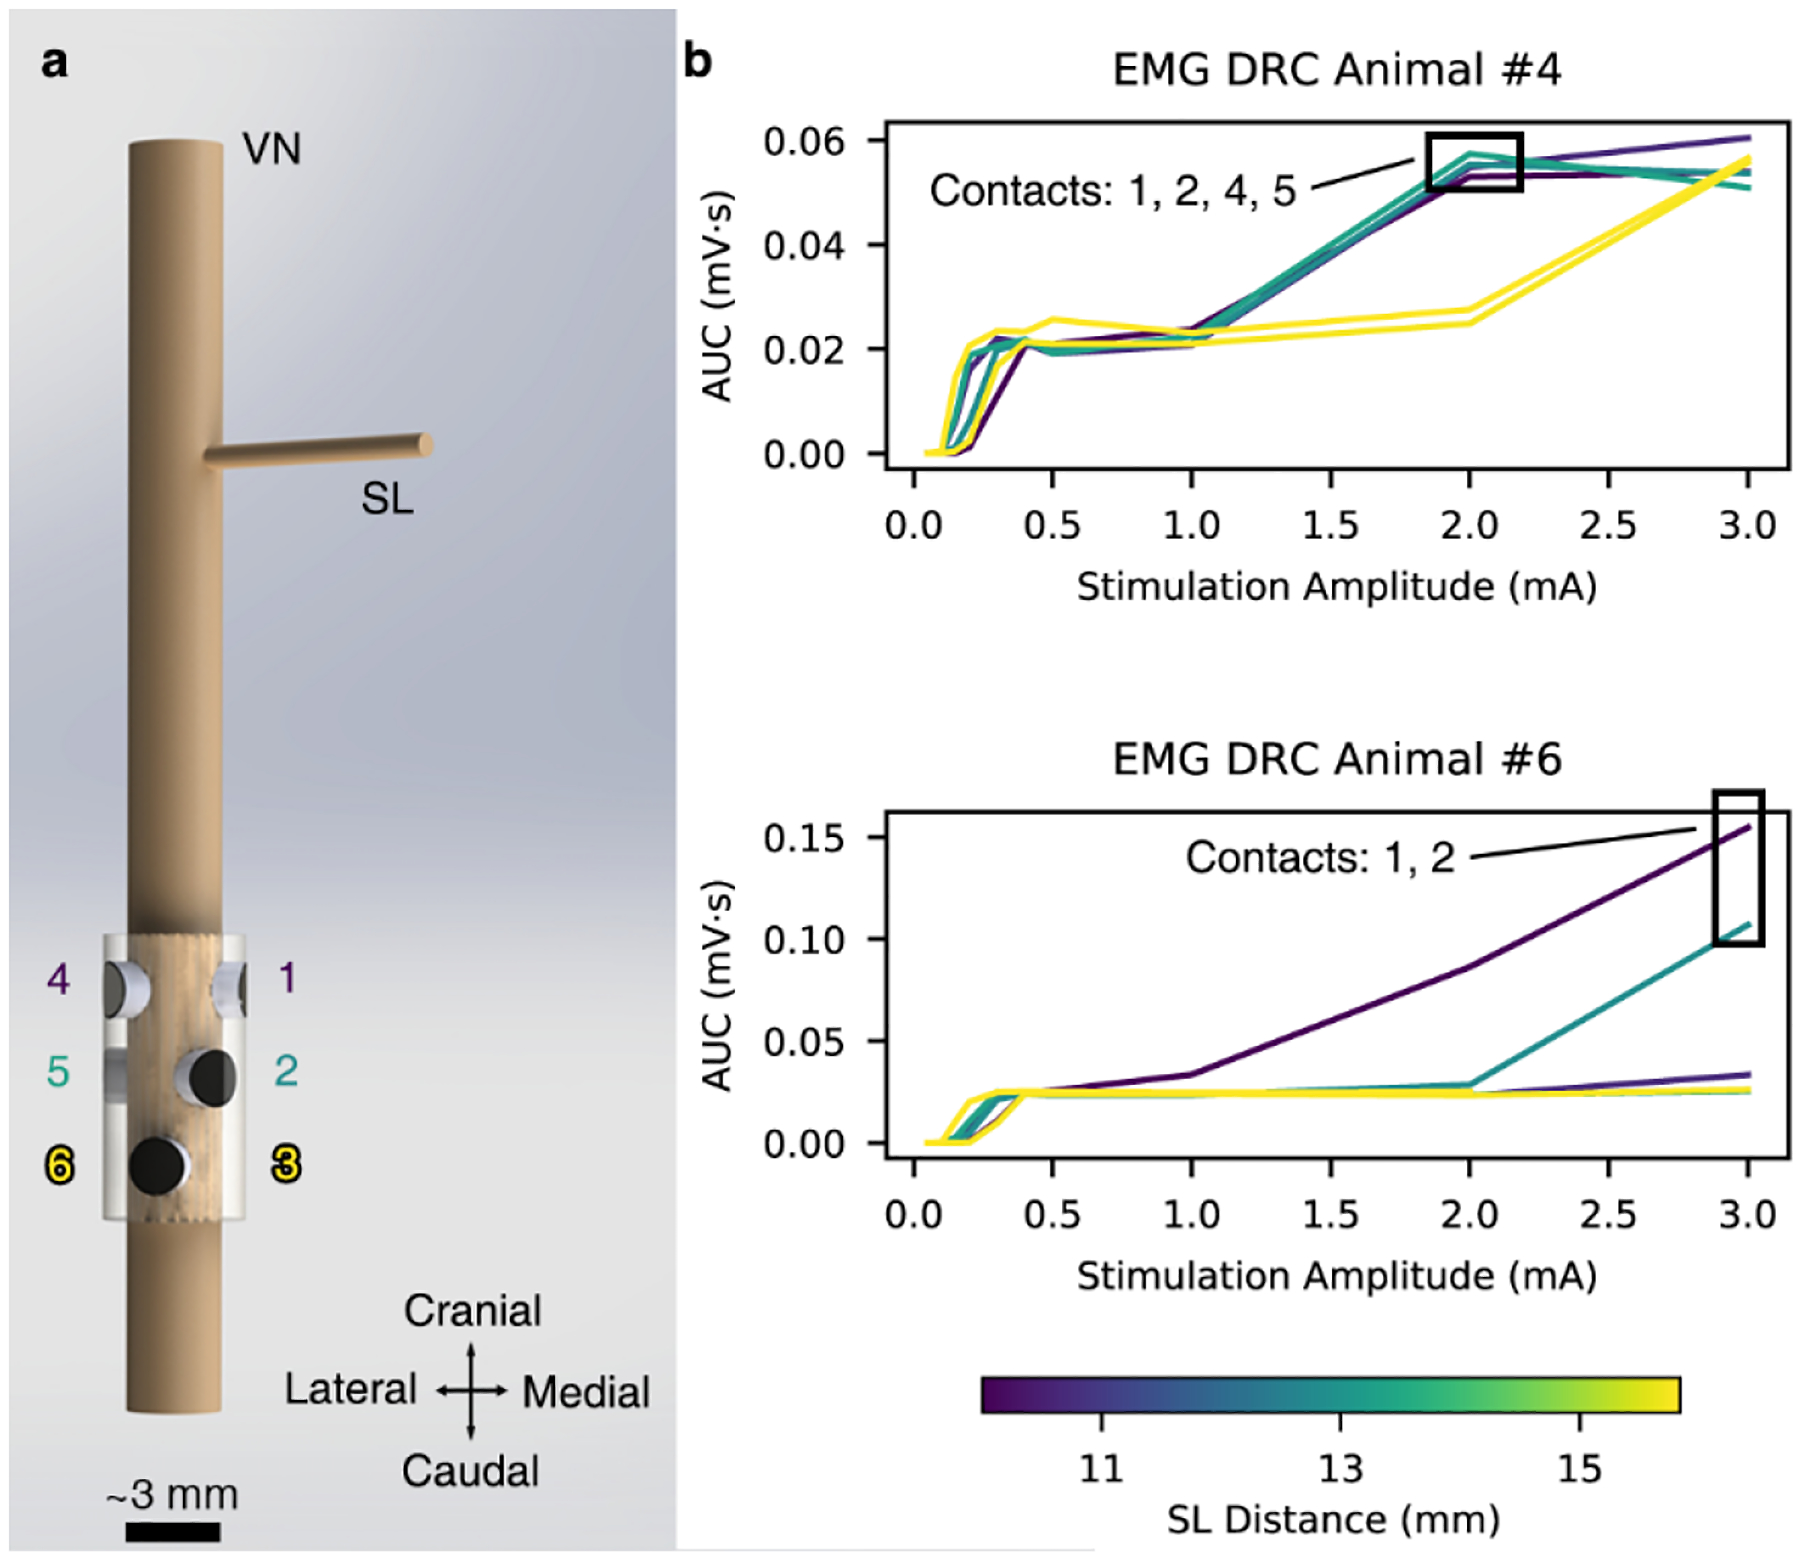
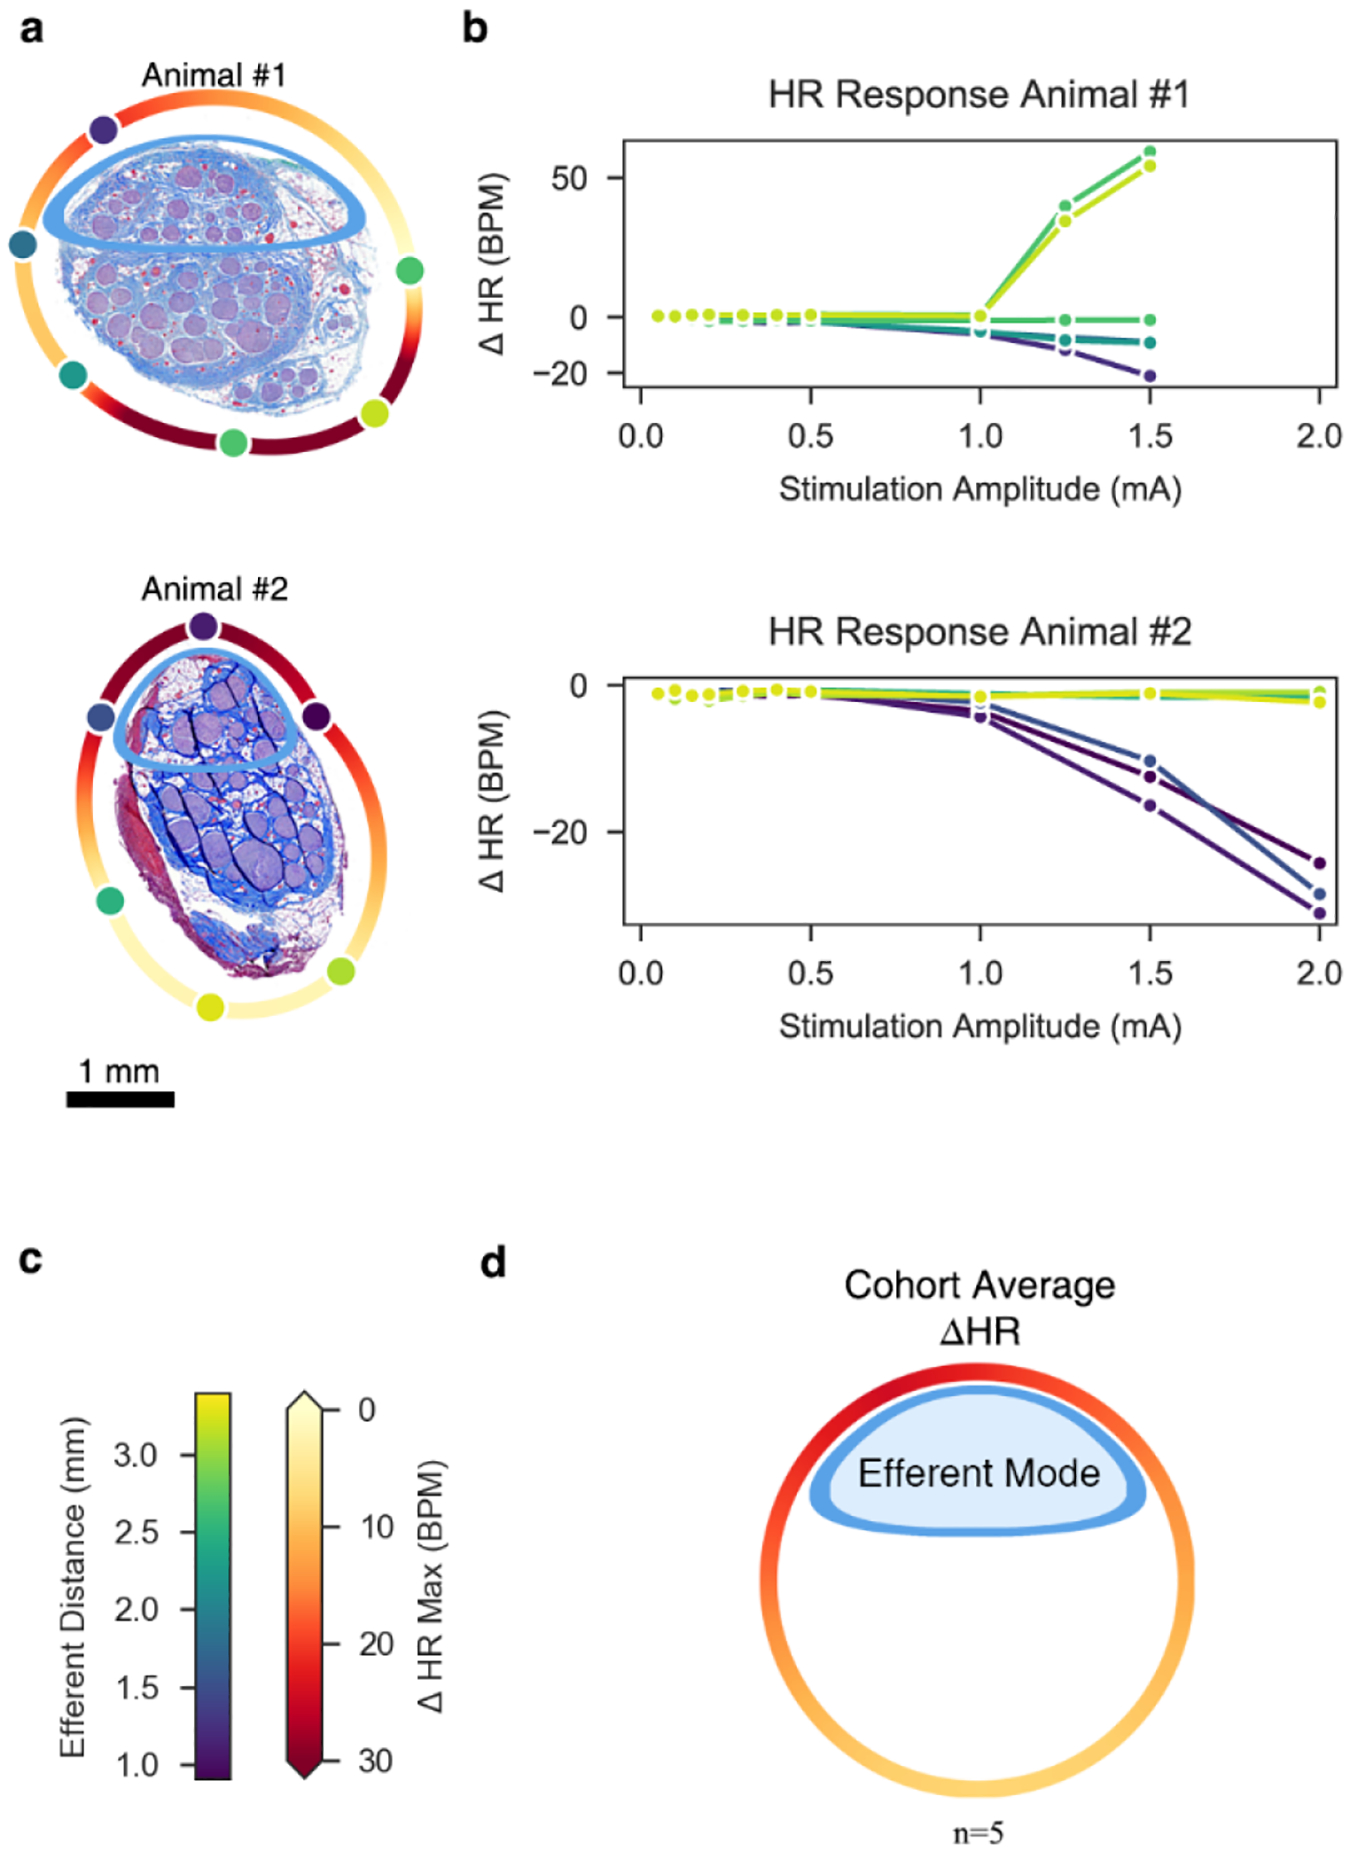
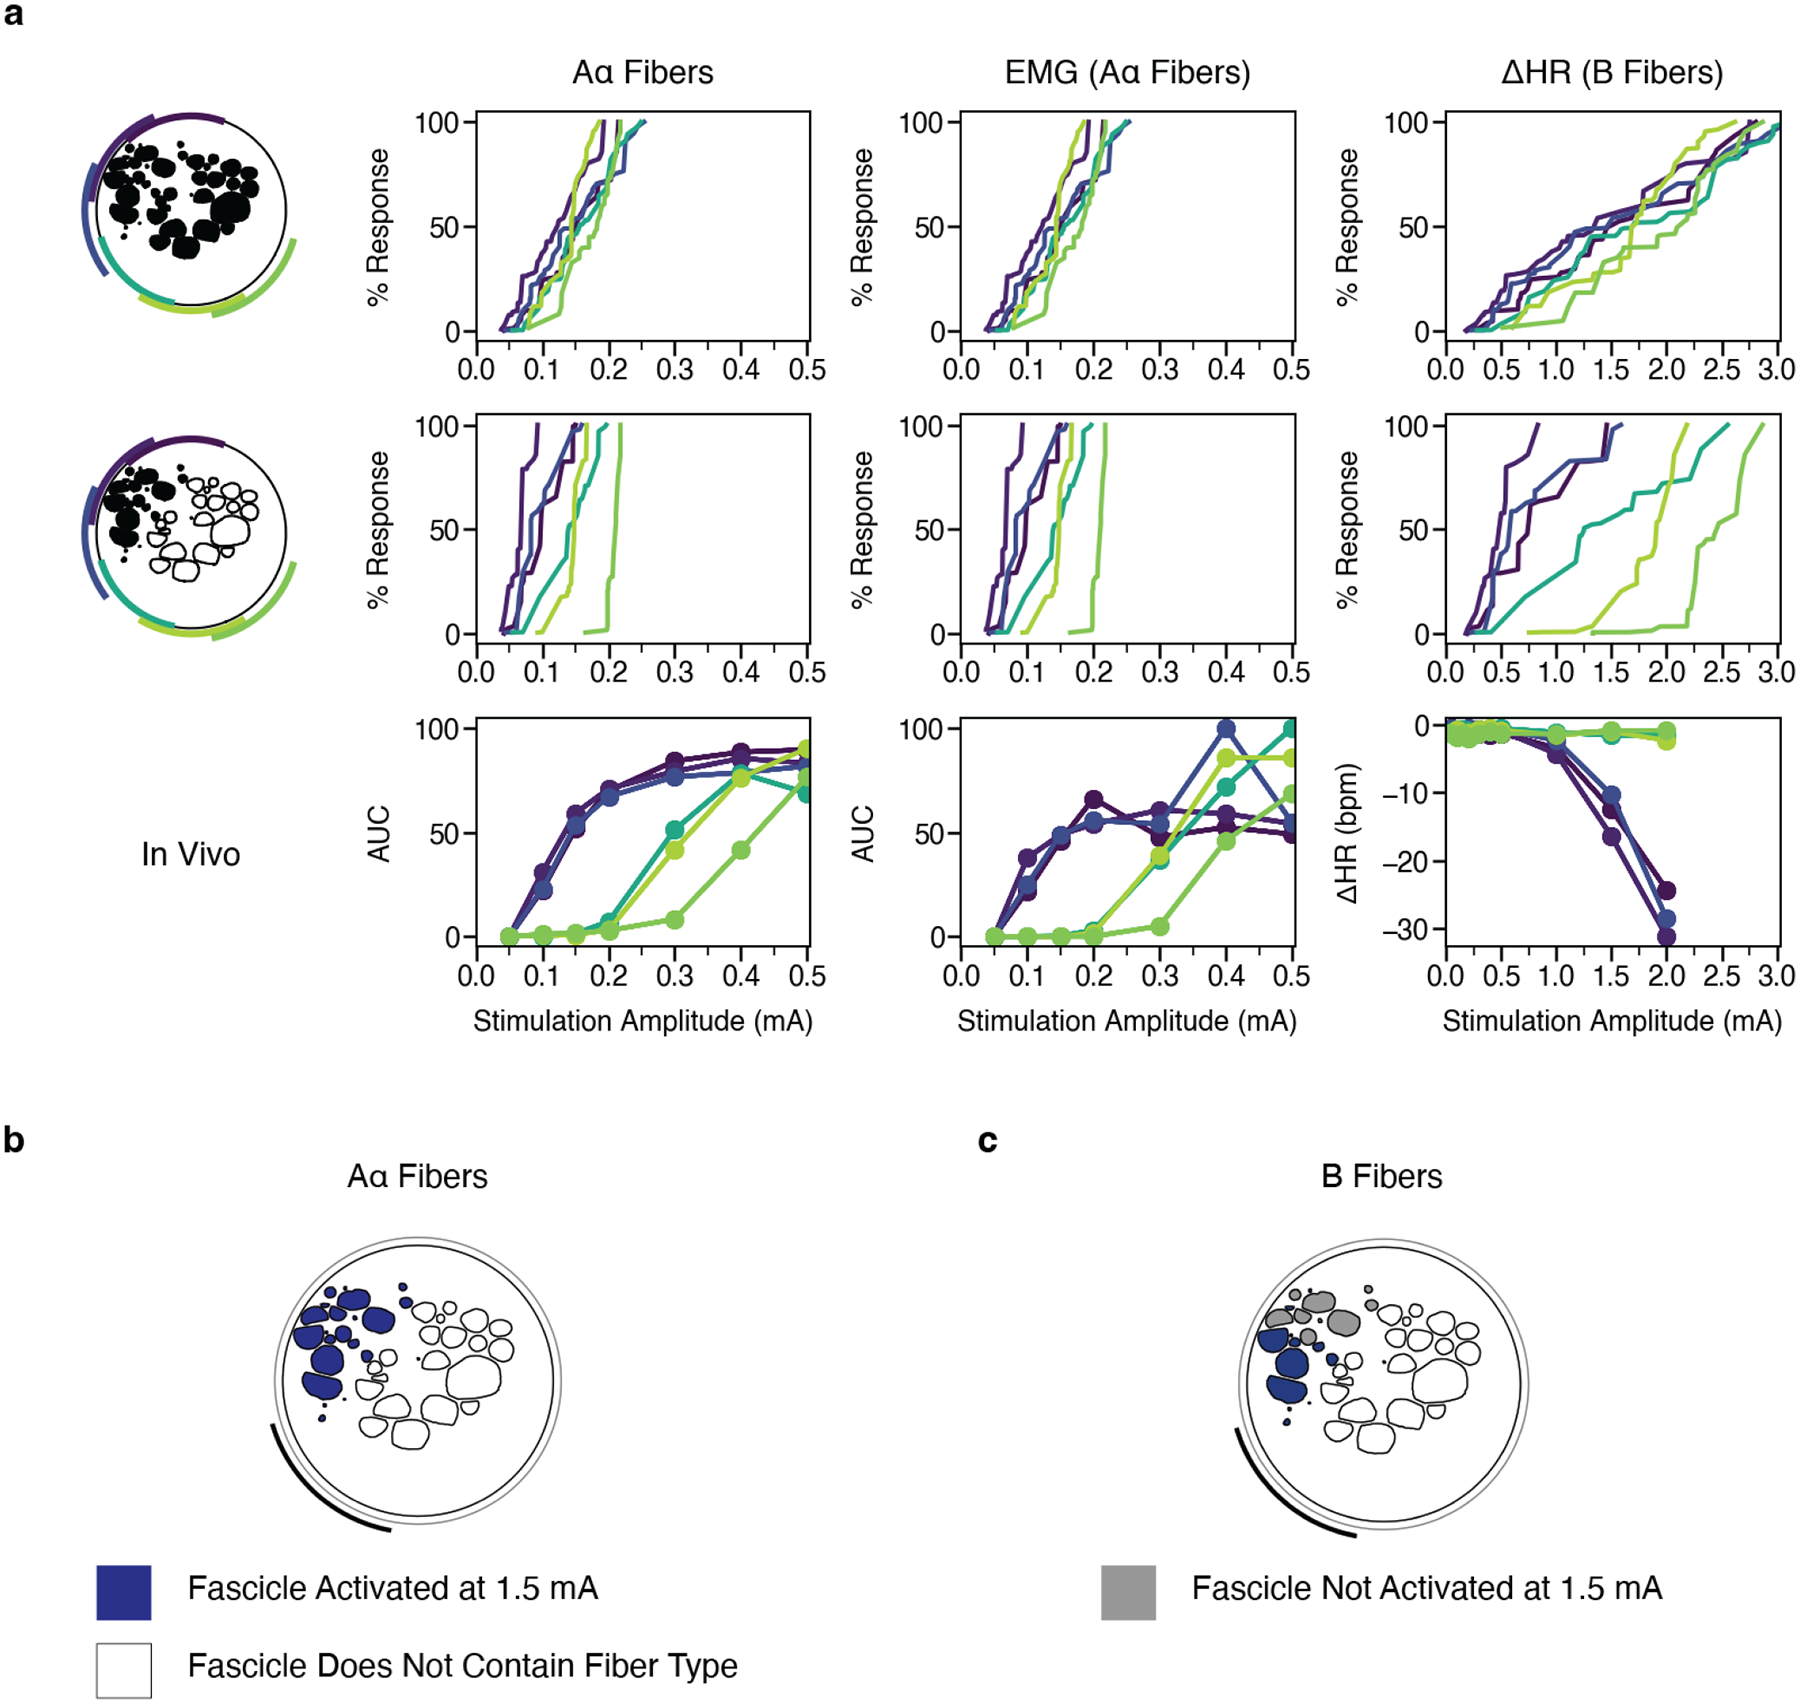
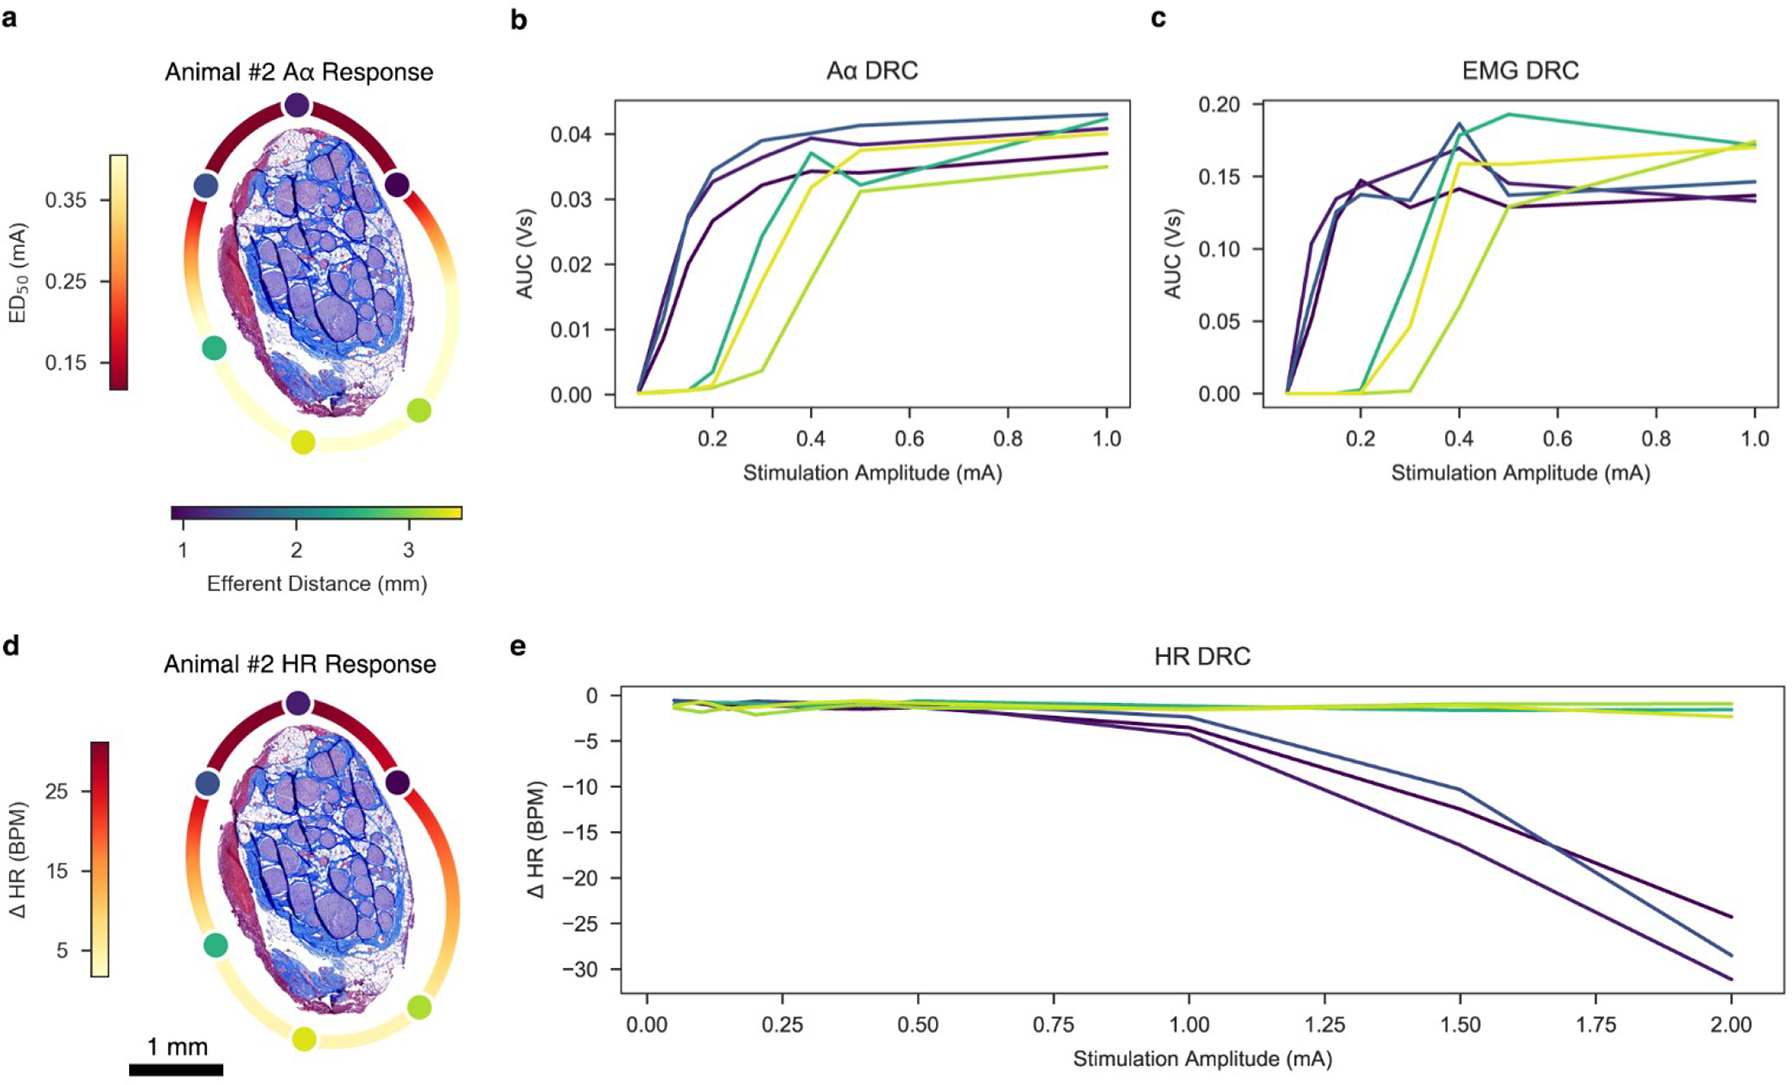
Electrical stimulation of the cervical vagus nerve using implanted electrodes (VNS) is FDA-approved for the treatment of drug-resistant epilepsy, treatment-resistant depression, and most recently, chronic ischemic stroke rehabilitation. However, VNS is critically limited by the unwanted stimulation of nearby neck muscles-a result of non-specific stimulation activating motor nerve fibers within the vagus. Prior studies suggested that precise placement of small epineural electrodes can modify VNS therapeutic effects, such as cardiac responses. However, it remains unclear if placement can alter the balance between intended effect and limiting side effect. We used an FDA investigational device exemption approved six-contact epineural cuff to deliver VNS in pigs and quantified how epineural electrode location impacts on- and off-target VNS activation. Detailed post-mortem histology was conducted to understand how the underlying neuroanatomy impacts observed functional responses. Here we report the discovery and characterization of clear neuroanatomy-dependent differences in threshold and saturation for responses related to both effect (change in heart rate) and side effect (neck muscle contractions). The histological and electrophysiological data were used to develop and validate subject-specific computation models of VNS, creating a well-grounded quantitative framework to optimize electrode location-specific activation of nerve fibers governing intended effect versus unwanted side effect.

Keywords: VNS; effect vs side effect; neuromodulation; vagus nerve.


Conflict of interest statement

Conflicts of Interest

JW and KL are scientific board members and have stock interests in NeuroOne Medical Inc., a company developing next-generation epilepsy monitoring devices. JW also has an equity interest in NeuroNexus technology Inc., a company that supplies electrophysiology equipment and multichannel probes to the neuroscience research community. KL is also a paid member of the scientific advisory board of Cala Health, Blackfynn, Abbott, and Battelle. KL also is a paid consultant for Galvani and Boston Scientific. KL and AS are consultants to and co-founders of Neuronoff Inc. None of these associations are directly relevant to the work presented in this manuscript.

Additionally, RV and JB are employed by LivaNova USA Inc., a vagus nerve stimulation company, and hold stock or stock options. RV and JB contributed primarily to the initial conceptualization and financial support for the program. The authorship team asserts that their conflict did not influence the collection, analysis, or interpretation of study results. The authorship team asserts that financial contributions of LivaNova USA funded study-related expenses but were not allocated for authorship.

The remaining authors declare that the research was conducted in the absence of any additional commercial or financial relationships that could be construed as a potential conflict of interest.

Figures

Figure 1.
Figure 1.. Experimental and instrumentational overview.
a, Depiction of the surgical preparation in which the right cervical vagus nerve (VN) is exposed. b, Depiction of pertinent anatomy. The superior laryngeal (SL) nerve branches into the internal superior laryngeal (ISL) nerve that innervates the cricoarytenoid (CA) muscle and the external superior laryngeal (ESL) nerve that innervates the cricothyroid (CT) muscle. The recurrent laryngeal (RL) nerve also innervates the CA. “Direct” activation of the neck muscles occurs via activation of motor nerve fibers from the stimulating electrode, branching at the RL and innervating the CA. “Indirect” activation of the neck muscles results from current escaping the stimulating cuff, traveling through fluid and surrounding tissue and activating motor nerve fibers in the SL, which causes contraction of the CA and CT. This figure is not drawn to scale, but the representation of a longer RL than SL is accurate and an essential factor affecting EMG latencies. c (left), Transverse plane depiction of the six-contact ImThera device on the VN. The caudal direction points out of the page, towards the reader. c (right), Additional perspective of the ImThera cuff, showing the axial and longitudinal orientation of stimulating contacts.
Figure 2.
Figure 2.. Histology from the nodose ganglion to the level of the stimulating cuff showing bimodal distribution of efferent and afferent fascicles in the vagus nerve of a pig.
a, Depiction of the VN from nodose ganglion (known point of organization of afferent fascicles) to the level of the cuff. Rings indicate the proportional locations of histological cross sections 1–6 in panel b (spanning 1.04 cm total, from slice #1 to slice #6) for Animal #4. b, Six histological cross sections of the VN for Animal #4. The serial sections track the locations of the fascicles arising from the pseudounipolar cell bodies of the visceral afferent fibers in the nodose. The dashed blue lines were superimposed to segregate the efferent and afferent modes based on the separation of the soma and the efferent fibers of passage in slice #1; we then followed these afferent and efferent groupings caudally. The most caudal section (6, chosen for representative purposes, approximately 2.6 mm more caudal than the center of the cuff) is repeated in panel c and rotated 123° clockwise to place the efferent mode in the top half of the section. d, The zoomed views shows the large, myelinated fibers in an example efferent fascicle (left) and the small, unmyelinated fibers in an example afferent fascicle (right). V: ventral; M: medial.
Figure 3.
Figure 3.. Representative ENG signals measured by intrafascicular electrodes.
a, Signal measured via LIFE in the VN during the “intact” condition. Candidate eCAPs are denoted by red arrows. Candidate eCAPs in the green shaded region correspond to the latencies of Aα and B fibers, while candidate eCAPs in the red shaded region correspond to the latencies of Aγ to B fibers. In this condition, it is difficult to determine which signals are true eCAPs and which signals are EMG contamination. Also, note the stimulus artifact at the onset of the stimulation (grey shaded region). b, Upon applying a paralytic agent, the EMG is eliminated and only the neural signal remains in the recorded trace. c, Without paralytic, RL and SL branches are transected, eliminating direct and indirect pathways to nearby muscles within the neck, which provides an additional confirmation of the lack of EMG contamination in the ENG signal. d, Verification of neural signal sources via double transection of the vagus nerve, rostral and caudal to the stimulation cuff, after which no signal remains. Note, the “intact” condition (panel a) is the result of averaging the recordings from 750 pulses, while the remaining conditions (panels b-d) are averaged across 25 pulses, resulting in slightly more noise in the traces.
Figure 4.
Figure 4.. ENG and EMG dose-response curves reflect contact position-dependent responses.
a, Histology for Animal #2 (left) and Animal #4 (right) at the level of the stimulating cuff, rotated such that the efferent cluster is oriented toward the top of the page. Stimulating contacts are superimposed to replicate the in situ condition and are characterized in color by their distance to the centroid of the efferent cluster (“Efferent Distance” colorbar). A heatmap was interpolated around the perimeter of the histology to indicate the current amplitude required to elicit half-maximal Aα responses (“ED50” colorbar). b, ENG and EMG dose-response curves for Animal #2 (left) and Animal #4 (right); 95% CIs are plotted but not visible due to its extremely narrow range. The color of each trace corresponds to the colors of the contacts in panel a. c, Extrapolated ED50 heatmap for both neural (left; n = 4) and muscle (right; n = 5) responses, averaged across the cohort and superimposed on a generalized circular illustration of the nerve cross section. The smaller ellipsoid (blue) represents the efferent mode. Same colorbar for ED50 as in panel a.
Figure 5.
Figure 5.. Off-target activation of the SL.
a, 3D rendering of the ImThera cuff placed on the VN showing the locations of the stimulating contacts relative to the SL branch. b, Dose-response curves (DRCs) in the animals with additional EMG recruitment at stimulation amplitudes >1 mA. Contacts closest to the SL branch preferentially activate the SL fibers at lower stimulation amplitudes than those that are further away.
Figure 6.
Figure 6.. Heart rate dose-response curves reflect electrode contact position-dependent recruitment.
a, Histology for Animal #1 (top) and Animal #2 (bottom) at the level of the stimulating cuff, rotated such that the efferent cluster is oriented toward the top of the page. Stimulating contacts are superimposed to replicate the in situ condition and their colors indicate their distances to the centroid of the efferent cluster. A heatmap was extrapolated around the perimeter of the nerve to indicate the maximal change in HR, based on location (see colorbar in panel c). b, Heart rate (HR) dose-response curves. Colors match the stimulating contacts in panel a. Note the marked tachycardia (increased HR) in Animal #1, particularly for contacts closest to the additional small cluster of fascicles at the bottom right of the histology. Conversely, both animals show bradycardia (decreased HR) for contacts near the efferent cluster at the top of each micrograph. c, Colorbar legends for the distance of each contact to the efferent cluster and for the maximum change in HR. Note that these legends are not related to each other (e.g., 2.5 mm distance does not correspond to 0 bpm change in HR). d, Extrapolated heatmap of the change in heart rate, averaged across the cohort (n = 5) and superimposed on a generalized circular illustration of the nerve cross section.
Figure 7.
Figure 7.. Modeling the effect of contact location on activation of Aα and B fibers without and with representation of vagotopy for Animal #2.
a, Percent of modeled (first and second rows) and in vivo (third row) Aα and B fibers activated versus stimulation amplitude across monopolar contact location (colors). In the top row, the target fiber is positioned in the centroid of each fascicle. In the middle row, we only modeled fibers in the black fascicles (i.e., the efferent mode). b-c, Fascicles labeled as suprathreshold (blue) and subthreshold (gray) in response to a 1.5 mA amplitude pulse for Aα and B fibers. At this stimulation amplitude, Aα fibers are activated in all fascicles, while the B fibers are activated concomitantly only in the fascicles closest to the contact. See data for all animals in Supplementary Material: Computational Modeling Data for Additional Animals: Figures 7–18.
Figure 8.
Figure 8.. Summary figure depicting ENG, EMG, and HR DRCs and heatmaps for Animal #2.
a, Histology of Animal #2 at the level of the stimulating cuff, rotated such that the efferent cluster is facing the top of the page. Stimulating contacts are superimposed to replicate the in situ condition and are characterized in color by their distance to the centroid of the efferent cluster. A heatmap was extrapolated around the perimeter of the histology to indicate changes in ED50 based on location. b, ENG dose-response curve. c, EMG dose-response curve. d, Same histology of Animal #2 as panel a, but a heatmap was extrapolated around the perimeter of the histology to indicate changes in HR based on location. e, HR dose-response curve.

References

    1. Ahmed U, Chang Y-C, Cracchiolo M, Lopez MF, Tomaio JN, Datta-Chaudhuri T, Zanos TP, Rieth L, Al-Abed Y, & Zanos S (2020). Anodal block permits directional vagus nerve stimulation. Scientific Reports, 10(1), Article 1. 10.1038/s41598-020-66332-y - DOI - PMC - PubMed
    1. Ardell JL, Nier H, Hammer M, Southerland EM, Ardell CL, Beaumont E, KenKnight BH, & Armour JA (2017). Defining the neural fulcrum for chronic vagus nerve stimulation: Implications for integrated cardiac control. The Journal of Physiology, 595(22), 6887–6903. 10.1113/JP274678 - DOI - PMC - PubMed
    1. Aristovich K, Donega M, Fjordbakk C, Tarotin I, Chapman CAR, Viscasillas J, Stathopoulou T-R, Crawford A, Chew D, Perkins J, & Holder D (2021). Model-based geometrical optimisation and in vivo validation of a spatially selective multielectrode cuff array for vagus nerve neuromodulation. Journal of Neuroscience Methods, 109079. 10.1016/j.jneumeth.2021.109079 - DOI - PubMed
    1. Hill AV. (1910). The possible effects of the aggregation of the molecules of huemoglobin on its dissociation curves. The Journal of Physiology, 40(Suppl)(PROCEEDINGS OF THE PHYSIOLOGICAL SOCIETY: January 22, 1910), iv–vii.
    1. Baumgart JP, Zhou Z-Y, Hara M, Cook DC, Hoppa MB, Ryan TA, & Hemmings HC (2015). Isoflurane inhibits synaptic vesicle exocytosis through reduced Ca2+ influx, not Ca2+-exocytosis coupling. Proceedings of the National Academy of Sciences of the United States of America, 112(38), 11959–11964. 10.1073/pnas.1500525112 - DOI - PMC - PubMed

Publication types

LinkOut - more resources