. 2023 Mar 2;31(3):329-342.e4.
doi: 10.1016/j.str.2022.12.011. Epub 2023 Jan 16.

Conformational exchange divergence along the evolutionary pathway of eosinophil-associated ribonucleases

Affiliations

Conformational exchange divergence along the evolutionary pathway of eosinophil-associated ribonucleases

David N Bernard et al. Structure. .

Abstract

The evolutionary role of conformational exchange in the emergence and preservation of function within structural homologs remains elusive. While protein engineering has revealed the importance of flexibility in function, productive modulation of atomic-scale dynamics has only been achieved on a finite number of distinct folds. Allosteric control of unique members within dynamically diverse structural families requires a better appreciation of exchange phenomena. Here, we examined the functional and structural role of conformational exchange within eosinophil-associated ribonucleases. Biological and catalytic activity of various EARs was performed in parallel to mapping their conformational behavior on multiple timescales using NMR and computational analyses. Despite functional conservation and conformational seclusion to a specific domain, we show that EARs can display similar or distinct motional profiles, implying divergence rather than conservation of flexibility. Comparing progressively more distant enzymes should unravel how this subfamily has evolved new functions and/or altered their behavior at the molecular level.

Keywords: CEST; CPMG; Markov State Model; NMR relaxation; antibacterial activity; conformational exchange; enzyme dynamics; intrinsically disordered proteins; molecular dynamics simulations; ribonucleases.


Conflict of interest statement

Declaration of interests Pratul K. Agarwal is the founder of the company Arium BioLabs, LLC.

Figures

Figure 1.
Figure 1.. Overall fold of the pancreatic-type ribonuclease.
Cartoon representation of human eosinophil-derived neurotoxin (EDN), also known as Homo sapiens RNase 2 (HsR2, PDB entry 1GQV). The characteristic V-shaped kidney structure shows two opposite domains termed V1 and V2, defined by two opposing antiparallel β-sheets formed by strands β2-β3-β6-β7 for V1 and strands β1-β4-β5 for V2 . Secondary structure elements are annotated, and conserved disulfide bridges are shown in yellow. Catalytic residues His15, Lys38 and His129 are labelled in blue.
Figure 2.
Figure 2.. Phylogenetic classification of pancreatic-type RNases.
Multiple sequence alignment of selected members of the RNase superfamily depicted in Figure S1 was used for phylogenetic clustering. Branching of the eight human RNases is identified using distinct colors. Inset shows the branch corresponding to the EAR subfamily. The six RNases characterized in this work (HsR2, HsR3, AtR2, PpR3, PaR3, and MfR3) are indicated using an asterisk in the inset (*).
Figure 3.
Figure 3.. Antibacterial activity of simian eosinophil RNases.
Normalized counts of colony-forming units (CFUs) of exponentially growing gram-negative E. coli or gram-positive S. aureus incubated for three hours in presence of various amounts of eosinophil RNases. Bovine RNase A (BtRA) was used as a negative control, and human RNase 3 (HsR3) was used as a positive control. Each condition was monitored at least in triplicate. Individual data points are shown as blue scatter plots on each bar graph. Significance was assessed using OneWay ANOVA with * for p < 0.05, ** for p < 0.01, *** for p < 0.001, and **** for p < 0.0001.
Figure 4.
Figure 4.. Cytotoxicity of simian eosinophil RNases.
A) Viability of HeLa cells as a function of increasing concentrations of simian RNases assessed with the Cell Titer-Blue Cell Viability Assay from Promega. Bovine RNase A (BtRA, black) was used as a noncytotoxic negative control. Results are expressed as percentage of control (non-treated cells) and represent the mean±SEM of at least 3 independent experiments performed in triplicate. B) Close-up view of the dashed rectangle found in panel A.
Figure 5.
Figure 5.. Conformational exchange experienced by simian eosinophil RNases.
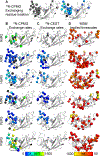
Subpanel A depicts the two different analysis methods used to characterize conformational exchange within each RNase, using HsR3 15N-CPMG data as an example. The left panel depicts exchanging residues as grey spheres to highlight their location, whereas the right panel includes the exchange rate. Residues undergoing conformational exchange are represented as spheres and were identified using dual fits of 15N-CPMG relaxation dispersion NMR data (B - first column), 15N-CEST experiments (C - second column), and Markov State Model analysis implied timescales (D - third column). Catalytic residues are depicted as sticks. In B and C, exchanging residues are colored according to the exchange rate kex, whereas residues are colored according to the implied timescale of the exchange process in D. The magnitude of kex values and implied timescales are represented using the color gradient legends on the bottom. Residues whose fits give a kex with a standard deviation larger than the actual value are depicted as black spheres. Black loops correspond to unassigned residues due to line broadening in the NMR spectra. Only residues with an implied timescale slower than 50 ns (see STAR Methods) are depicted as spheres in the third column. Representative curves for each technique are displayed in Figures S5 and S6.
Figure 6.
Figure 6.. Examples of residue dynamics experienced on the 100-ns timescale.
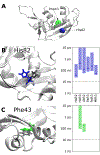
A) Overall structure of HsR3 showing locations of amino acids analyzed in subsequent panels. B-C) Representative structures of MSM metastable states illustrating between which structures the identified exchange process occurs (left) at positions 82 (B) and 43 (C). In both panels, MSM implied timescales (right) indicate the relaxation time corresponding to that process, resolved for the different eosinophil RNases. Confidence intervals (shaded areas) are computed from Bayesian sampling of the posterior . In panel B, two rotamers of His82 (in HsR2, HsR3 [shown structure], PpR3, and MfR3) or Tyr82 (in AtR2 and PaR3) (located on β4) are configurations between which the MSM exchange process occurs. It can be observed in all investigated RNases. In panel C, Phe43 (on β1, embedded between α1 and α2) is conserved in all RNases but shows conformational exchange on the 100-ns regime only for AtR2 and HsR3. Structure renders were created with VMD .
Figure 7.
Figure 7.. Pairwise comparison of eosinophil RNase exchange profiles.
Pairwise cosine similarity values for location (left panels) and exchange timescale (right panels) calculated based on comparison of residues along the consensus sequence, color-coded based on strong (white) to weak (dark) similarity. Pairwise cosine similarity values are shown for A) 15N-CPMG, B) 15N-CEST, and C) MSM implied timescales.
Figure 8.
Figure 8.. Amplitude of atomistic fluctuations on the ns-μs timescale.
A) Root mean square fluctuations as a function of the consensus sequence for members of the eosinophil associated RNases. The calculated RMSFs represent the Cα displacements of the top ten quasi-harmonic modes of eosinophil RNases. The consensus residue numbering represents the indexing that includes gaps, corresponding to insertions/deletions, in sequences. B) Pairwise Pearson’s correlation coefficients for the eosinophil RNases calculated based on comparison of RMSF10 values for each of the positions without an insertion/deletion in any of the six RNases.

References

    1. Agarwal PK (2019). A Biophysical Perspective on Enzyme Catalysis. Biochemistry 58, 438–449. 10.1021/acs.biochem.8b01004. - DOI - PMC - PubMed
    1. Frauenfelder H, Parak F, and Young RD (1988). Conformational substates in proteins. Annu Rev Biophys Biophys Chem 17, 451–479. 10.1146/annurev.bb.17.060188.002315. - DOI - PubMed
    1. Henzler-Wildman K, and Kern D (2007). Dynamic personalities of proteins. Nature 450, 964–972. 10.1038/nature06522. - DOI - PubMed
    1. Maria-Solano MA, Serrano-Hervás E, Romero-Rivera A, Iglesias-Fernández J, and Osuna S (2018). Role of conformational dynamics in the evolution of novel enzyme function. Chem Commun (Camb) 54, 6622–6634. 10.1039/c8cc02426j. - DOI - PMC - PubMed
    1. Bhabha G, Biel JT, and Fraser JS (2015). Keep on moving: discovering and perturbing the conformational dynamics of enzymes. Acc Chem Res 48, 423–430. 10.1021/ar5003158. - DOI - PMC - PubMed

Publication types

LinkOut - more resources