. 2023 Jan;11(1):e005319.
doi: 10.1136/jitc-2022-005319.

Tasquinimod suppresses tumor cell growth and bone resorption by targeting immunosuppressive myeloid cells and inhibiting c-MYC expression in multiple myeloma

Affiliations

Tasquinimod suppresses tumor cell growth and bone resorption by targeting immunosuppressive myeloid cells and inhibiting c-MYC expression in multiple myeloma

Rong Fan et al. J Immunother Cancer. 2023 Jan.

Abstract

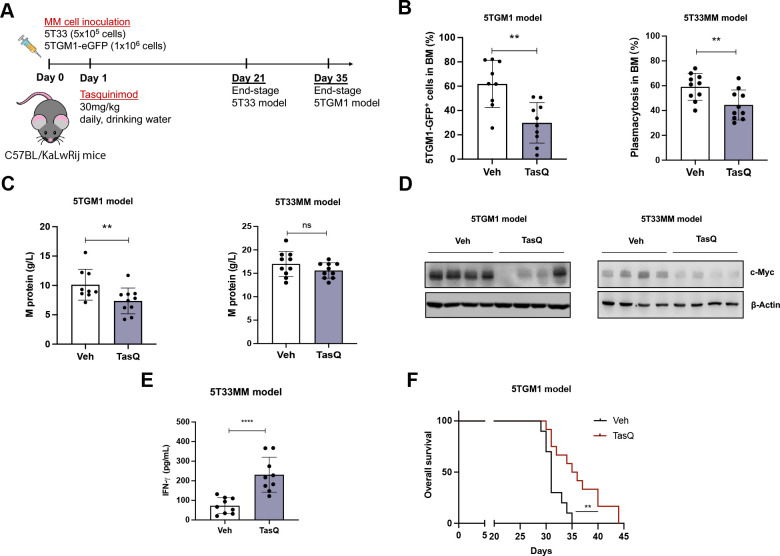
Background: Immunotherapy emerged as a promising treatment option for multiple myeloma (MM) patients. However, therapeutic efficacy can be hampered by the presence of an immunosuppressive bone marrow microenvironment including myeloid cells. S100A9 was previously identified as a key regulator of myeloid cell accumulation and suppressive activity. Tasquinimod, a small molecule inhibitor of S100A9, is currently in a phase Ib/IIa clinical trial in MM patients (NCT04405167). We aimed to gain more insights into its mechanisms of action both on the myeloma cells and the immune microenvironment.

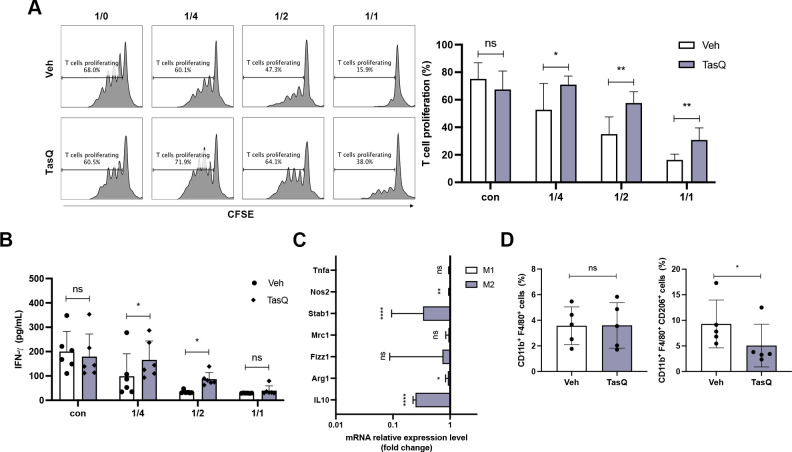
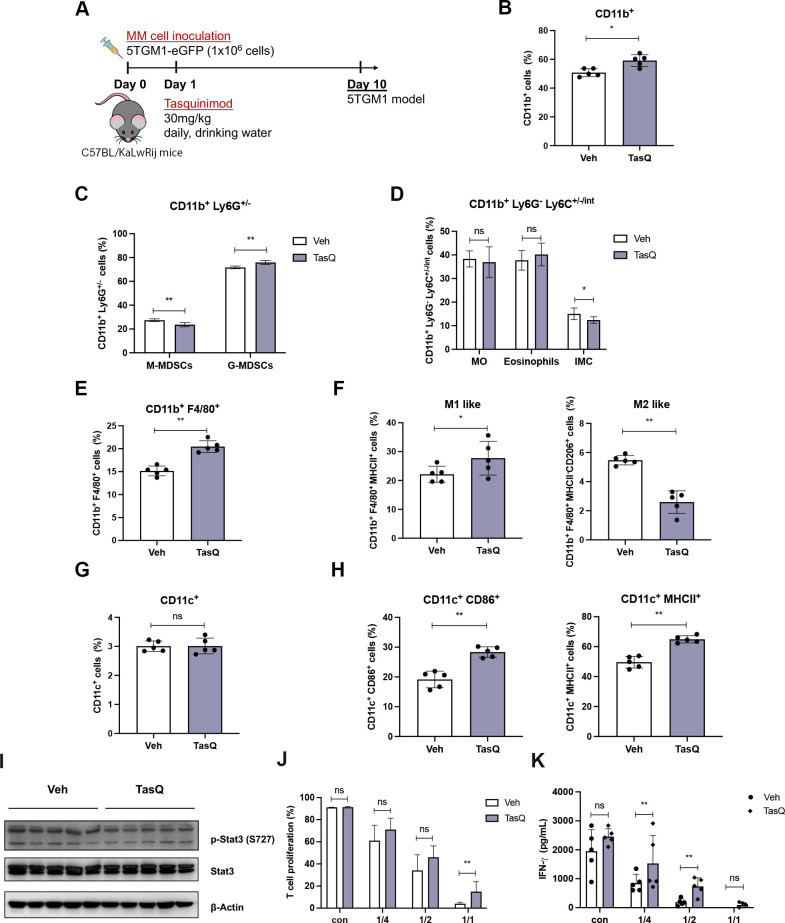
Methods: We analyzed the effects of tasquinimod on MM cell viability, cell proliferation and downstream signaling pathways in vitro using RNA sequencing, real-time PCR, western blot analysis and multiparameter flow cytometry. Myeloid cells and T cells were cocultured at different ratios to assess tasquinimod-mediated immunomodulatory effects. The in vivo impact on immune cells (myeloid cell subsets, macrophages, dendritic cells), tumor load, survival and bone disease were elucidated using immunocompetent 5TMM models.

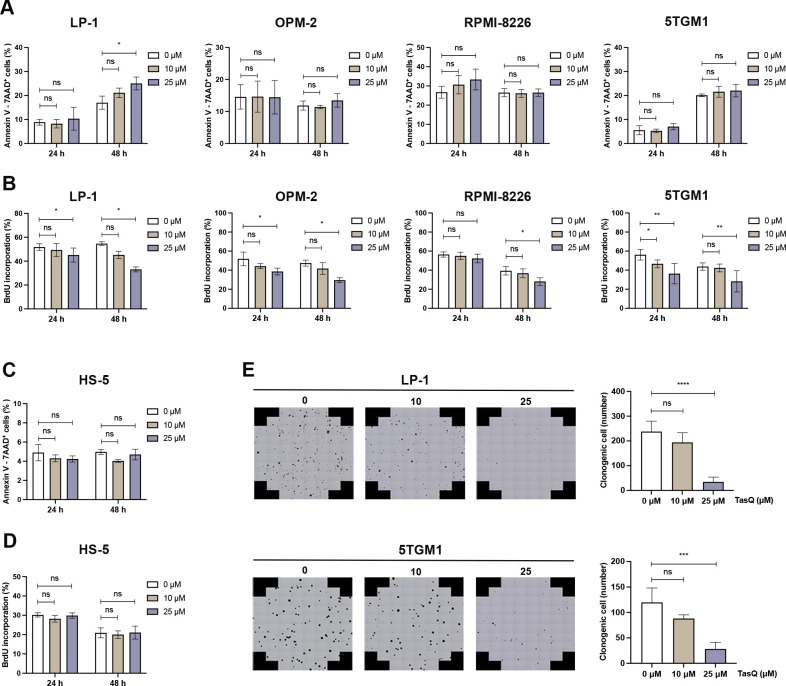
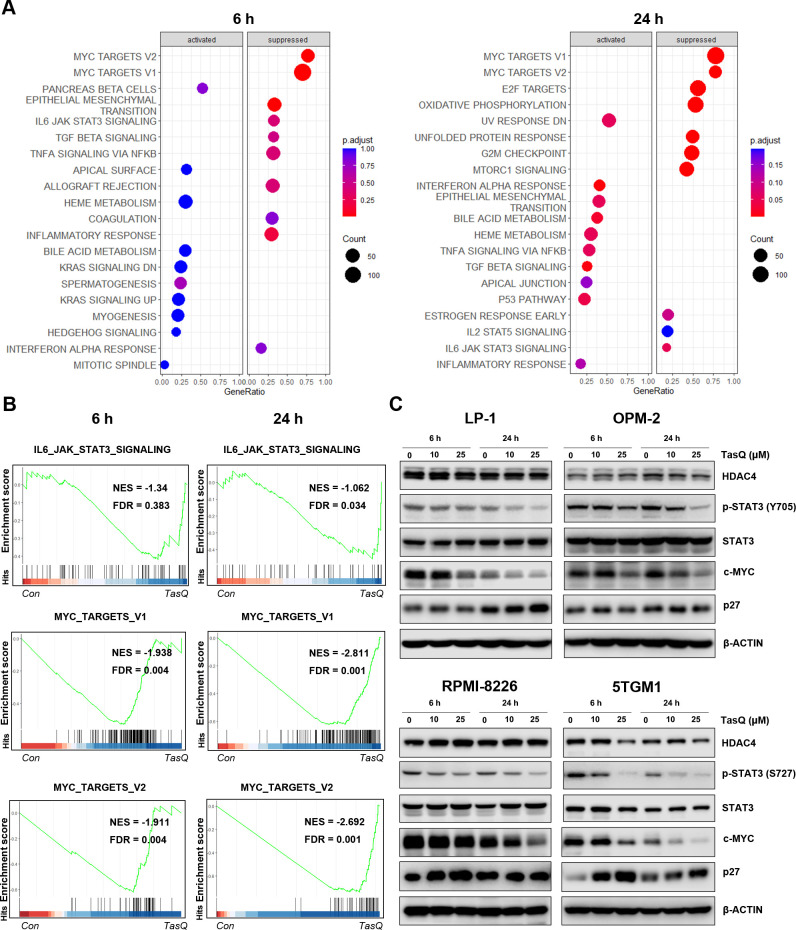
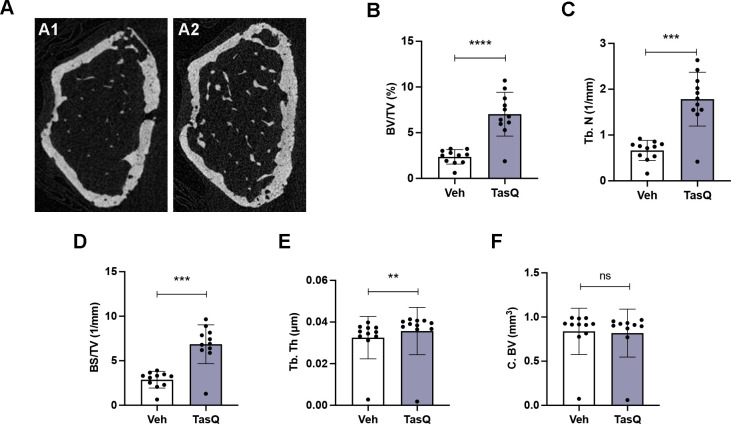
Results: Tasquinimod treatment significantly decreased myeloma cell proliferation and colony formation in vitro, associated with an inhibition of c-MYC and increased p27 expression. Tasquinimod-mediated targeting of the myeloid cell population resulted in increased T cell proliferation and functionality in vitro. Notably, short-term tasquinimod therapy of 5TMM mice significantly increased the total CD11b+ cells and shifted this population toward a more immunostimulatory state, which resulted in less myeloid-mediated immunosuppression and increased T cell activation ex vivo. Tasquinimod significantly reduced the tumor load and increased the trabecular bone volume, which resulted in prolonged overall survival of MM-bearing mice in vivo.

Conclusion: Our study provides novel insights in the dual therapeutic effects of the immunomodulator tasquinimod and fosters its evaluation in combination therapy trials for MM patients.

Keywords: Hematologic Neoplasms; Immunomodulation; Immunotherapy; Myeloid-Derived Suppressor Cells.


Conflict of interest statement

Competing interests: This study was in part funded by Active Biotech.

Figures

Figure 1
Figure 1
Tasquinimod inhibits MM cell proliferation and reduces colony formation in vitro. (A) Apoptosis was analyzed by flow cytometry using Annexin V/7-AAD staining of tasquinimod-treated MM cell lines including LP-1, OPM-2, RPMI-8226 and 5TGM1 at indicated concentrations for 24 and 48 hours (n=3). (B) Cell proliferation of tasquinimod-treated MM cells (10, 25 µM) was investigated using BrdU staining at 24 hours and 48 hours. Various human MM cell lines were tested including LP-1 (n=3), OPM-2 (n=3), RPMI-8226 (n=4) and 5TGM1 (n=5). (C) Apoptosis and cell proliferation of the human stromal cell line HS-5 treated/untreated with tasquinimod (10, 25 µM) was detected by Annexin V/7-AAD (n=3) and BrdU staining (n=4). (D) Methylcellulose colony formation assays were used for LP-1 and 5TGM1 cell lines treated with vehicle or tasquinimod (10, 25 µM) for 14 days. Quantification of colony numbers was also shown (n=4). *p<0.05, **p<0.01, ***p<0.001, ****p<0.0001, Mann-Whitey U test, Error bars indicate SD. 7-AAD, 7-aminoactinomycin D; MM, multiple myeloma; ns, not significant.
Figure 2
Figure 2
Tasquinimod-mediated downregulation of c-MYC expression in MM cells in vitro. (A) The bubble plot shows the top 20 differentially regulated (activated/suppressed) pathways in the tasquinimod-treated group compared with the control group (6, 24 hours) (n=3). (B) Gene set enrichment analysis (GSEA) of the IL6-JAK-STAT3 and MYC targets V1, V2 gene signature in LP-1 cells after treatment with either 25 µM of tasquinimod or DMSO for 6 hours and 24 hours. GSEA of differentially expressed genes was determined by querying the MSigDB. False discovery rate (FDR) and normalized enrichment scores (NES) are indicated (n=3). (C) LP-1, OPM-2, RPMI-8226 and 5TGM1 cells were cultured with tasquinimod (TasQ) (10, 25 µM) for 6 hours and 24 hours. Whole-cell lysates were subjected to Western blot using HDAC4, anti-Phospho-Stat3 (Tyr705, S727), anti-Stat3, anti-c-MYC, anti-p27 Kip and anti-β-Actin antibodies (n=5). HDAC4, histone deacetylase 4.
Figure 3
Figure 3
Tasquinimod reduces the MDSC suppressive capacity and increases T cell proliferation in vitro. (A) MACS sorted CD11b+ BM cells were cocultured in the presence of 5TGM1 MM conditioned medium, CD3/CD28 microbeads and splenic CFSE-labeled T cells of naive mice with/without tasquinimod (TasQ). MDSC and T cells were cocultured at a ratio of 1/4, 1/2 and 1/1, respectively. After 72 hours, T cell proliferation was analyzed using flow cytometry (n=8, Mann-Whitey U test). (B) Supernatant was collected from this assay and IFN-γ was analyzed by ELISA (n=8, Mann-Whitey U test). (C) CD11b+ cells were sorted from the BM of the 5TGM1MM model and treated with vehicle or tasquinimod for 24 hours. The mRNA level of genes was measured with RT-qPCR and calculated with the ΔΔC. The data are expressed relative to their respective controls set to 1 (n=5, unpaired t-test). (D) The CD11b+ F4/80+ population and M2 macrophage subset (CD11b+ F4/80+ CD206+) were detected by flow cytometry (n=5, Mann-Whitey U test). *p<0.05, **p<0.01, ****p<0.0001. Error bars indicate SD. BM, bone marrow; CFSE, carboxyfluorescein succinimidyl ester; MACS, magnetic-activated cell sorting; MDSC, myeloid-derived suppressor cell; MM, multiple myeloma.
Figure 4
Figure 4
Short-term tasquinimod treatment of 5TMM mice modulates the myeloid cell phenotype and increases T cell activation. (A) 6-week-old C57BL/KaLwRij mice were inoculated with 1.0×10⁶ 5TGM1-eGFP cells on day 0 and treatment with tasquinimod (TasQ, 30 mg/kg in daily drinking water) started on day 1 (n=5/group). At day 10, all mice were sacrificed to investigate immune cell populations using flow cytometry. (B) The effect of tasquinimod on the percentage of CD11b+ cells in tasquinimod-treated mice compared with vehicle mice. (C) The percentage of monocytic MDSCs (M-MDSCs) (CD11b+, Ly6G-) and granulocytic MDSCs (G-MDSCs) (CD11b+, Ly6G+) in tasquinimod-treated mice compared with vehicle mice. (D) In the CD11b+Ly6Glow population three MDSC subtypes were distinguished based on Ly6C (Ly6Chi inflammatory monocytes (MO), Ly6Cintermediate eosinophils, and Ly6Clow immature myeloid cells (IMC)). (E) The percentage F4/80+ cells within the CD11b+ cell population in vehicle and tasquinimod-treated mice. (F) Frequency of CD11b+ F4/80+ MHCII+ cells (M1 like) and CD11b+ F4/80+ MHCII- CD206+ cells (M2 like) in the 5TGM1 model±tasquinimod treatment for 10 days. (G) Percentage of total CD11c+ cells. (H) Percentage of CD86+ MHCII+ CD11c+ cells in 5TGM1 model±tasquinimod treatment for 10 days. (I) CD11b+ cells were sorted from the BM of 5TGM1 mice treated with tasquinimod or vehicle, followed by western blot for p-Stat3. (J) T cells were stimulated with CD3/CD28 in the presence of CD11b+ cells from mice treated with tasquinimod or vehicle (at indicated ratios) and proliferation was measured by CFSE incorporation using flow cytometry. (K) IFN-γ ELISA of supernatant of naïve spleen cells cocultured with BM CD11b+ cells of mice treated with tasquinimod or vehicle (n=5/group). *p<0.05, **p<0.01, Mann-Whitey U test, Error bars indicate SD. BM, bone marrow; CFSE, carboxyfluorescein succinimidyl ester; MACS, magnetic-activated cell sorting; MDSCs, myeloid-derived suppressor cells.
Figure 5
Figure 5
Tasquinimod decreases tumor burden and significantly prolongs median survival of 5TMM mice. (A) 6-week-old C57BL/KaLwRij mice were inoculated with 1.0×10⁶ 5TGM1-eGFP cells on day 0 for the 5TGM1 model (n=10/group). Six-week-old C57BL/KaLwRij mice were inoculated with 1.0×10⁶ 5T33 vv cells on day 0 for the 5T33MM model (n=10/group). Treatment with tasquinimod (30 mg/kg in daily drinking water) started on day 1. At day 35 (5TGM1 model) or 21 (5T33MM model) all mice were sacrificed. (B) In the 5TGM1 model, teGFP expression was analyzed using flow cytometry to determine the number of tumor cells in the bone marrow. For the 5T33MM model, tumor load was assessed using May-Grunwald Giemsa-stained cytosmears of mononuclear bone marrow cells and the percentage plasma cells was calculated. (C) The M protein was analyzed by serum electrophoresis. (D) MM cells were MACS sorted from the bone marrow of vehicle and tasquinimod-treated mice and c-MYC levels were detected via western blot. (E) Serum IFN-γ concentration in the 5T33MM model was detected using ELISA. (F) Kaplan-Meier survival curves for the 5TGM1 mice treated with/without tasquinimod (n=10/group). **p<0.01, ****p<0.0001, Mann-Whitney U test. Error bars indicate SD. MM, multiple myeloma.
Figure 6
Figure 6
Tasquinimod therapy resulted in increased trabecular bone volume in vivo. (A) Three-dimensional reconstructions of micro-CT scans of the representative femur from vehicle (A1) and tasquinimod-treated 5TGM1 mice (A2). (B) Percentage of bone volume over total volume or bone volume fraction (BV/TV). (C) Trabecular number (Tb.N). (D) Surface density (BS/TV). (E) Trabecular thickness (Tb. Th). (F) Cortical bone volume (C. BV). **p<0.01, ***p<0.001, ****p<0.0001, Mann-Whitney U test. Error bars indicate SD, n=10 per group.

References

    1. NWCJ vandeD, Pawlyn C, Yong KL. Multiple myeloma. Lancet 2021;397:410–27. 10.1016/S0140-6736(21)00135-5 - DOI - PubMed
    1. Kawano Y, Moschetta M, Manier S, et al. Targeting the bone marrow microenvironment in multiple myeloma. Immunol Rev 2015;263:160–72. 10.1111/imr.12233 - DOI - PubMed
    1. Gooding S, Edwards CM. New approaches to targeting the bone marrow microenvironment in multiple myeloma. Curr Opin Pharmacol 2016;28:43–9. 10.1016/j.coph.2016.02.013 - DOI - PubMed
    1. Labani-Motlagh A, Ashja-Mahdavi M, Loskog A. The tumor microenvironment: a milieu hindering and obstructing antitumor immune responses. Front Immunol 2020;11:940–40. 10.3389/fimmu.2020.00940 - DOI - PMC - PubMed
    1. Minnie SA, Hill GR. Immunotherapy of multiple myeloma. J Clin Invest 2020;130:1565–75. 10.1172/JCI129205 - DOI - PMC - PubMed

Publication types

Associated data