. 2023 Feb 22;43(8):1298-1309.
doi: 10.1523/JNEUROSCI.2080-19.2023. Epub 2023 Jan 17.

Mechanisms That Underlie Expression of Estradiol-Induced Excitatory Synaptic Potentiation in the Hippocampus Differ between Males and Females

Affiliations

Mechanisms That Underlie Expression of Estradiol-Induced Excitatory Synaptic Potentiation in the Hippocampus Differ between Males and Females

Anant Jain et al. J Neurosci. .

Abstract

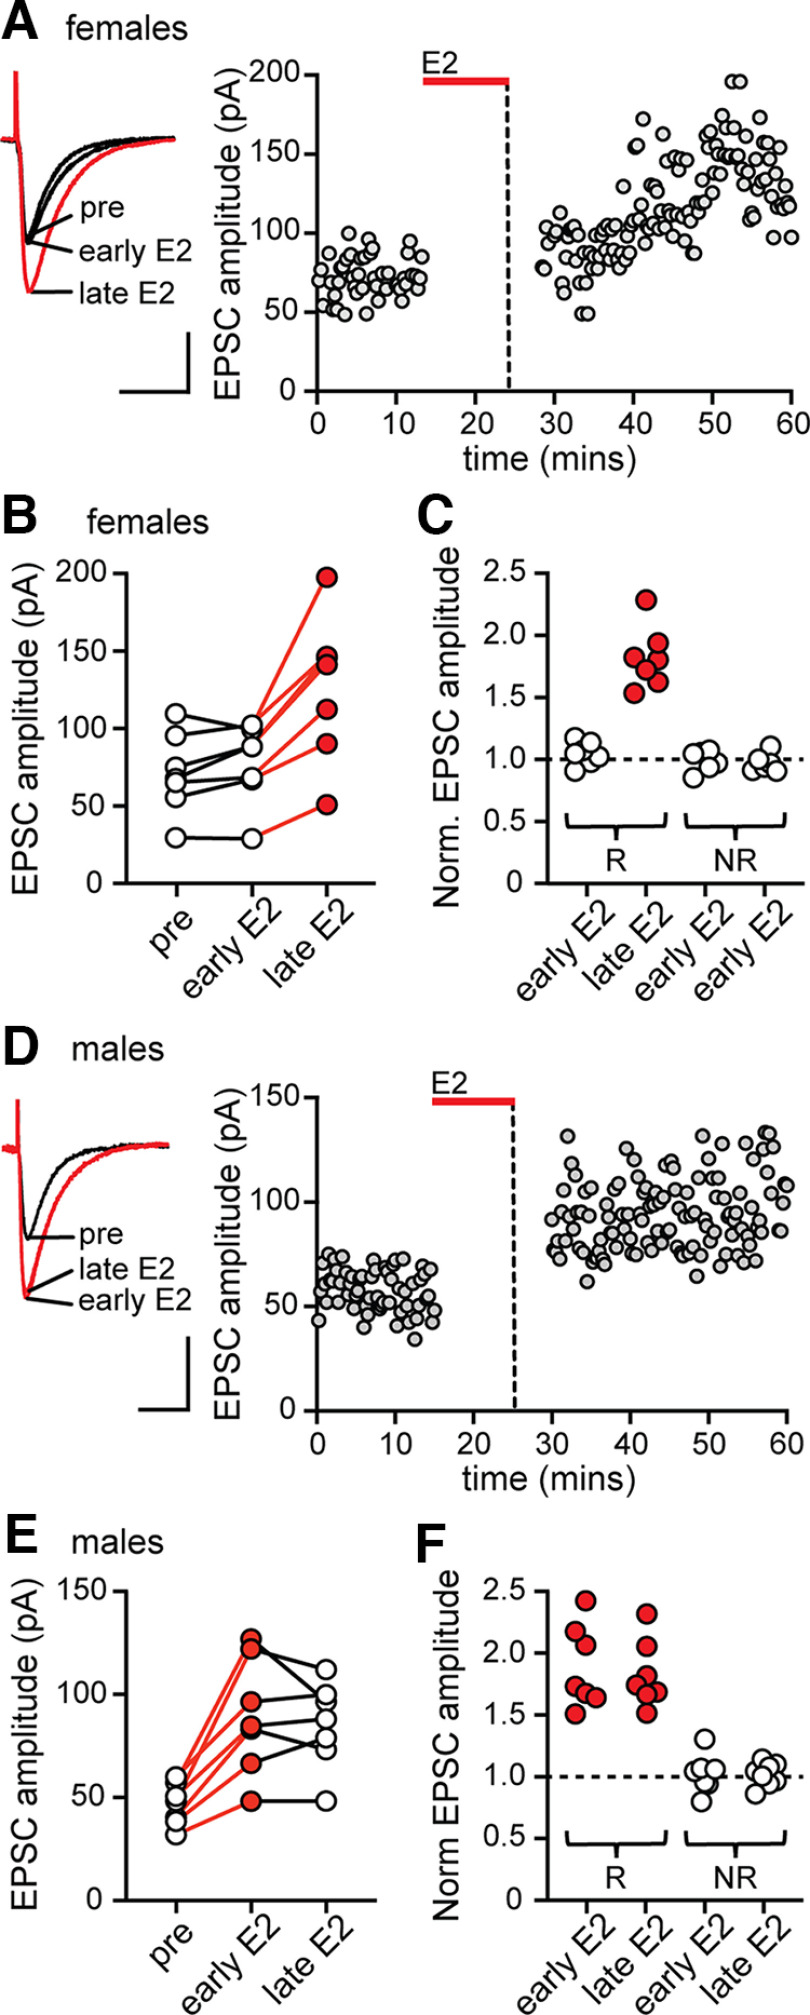
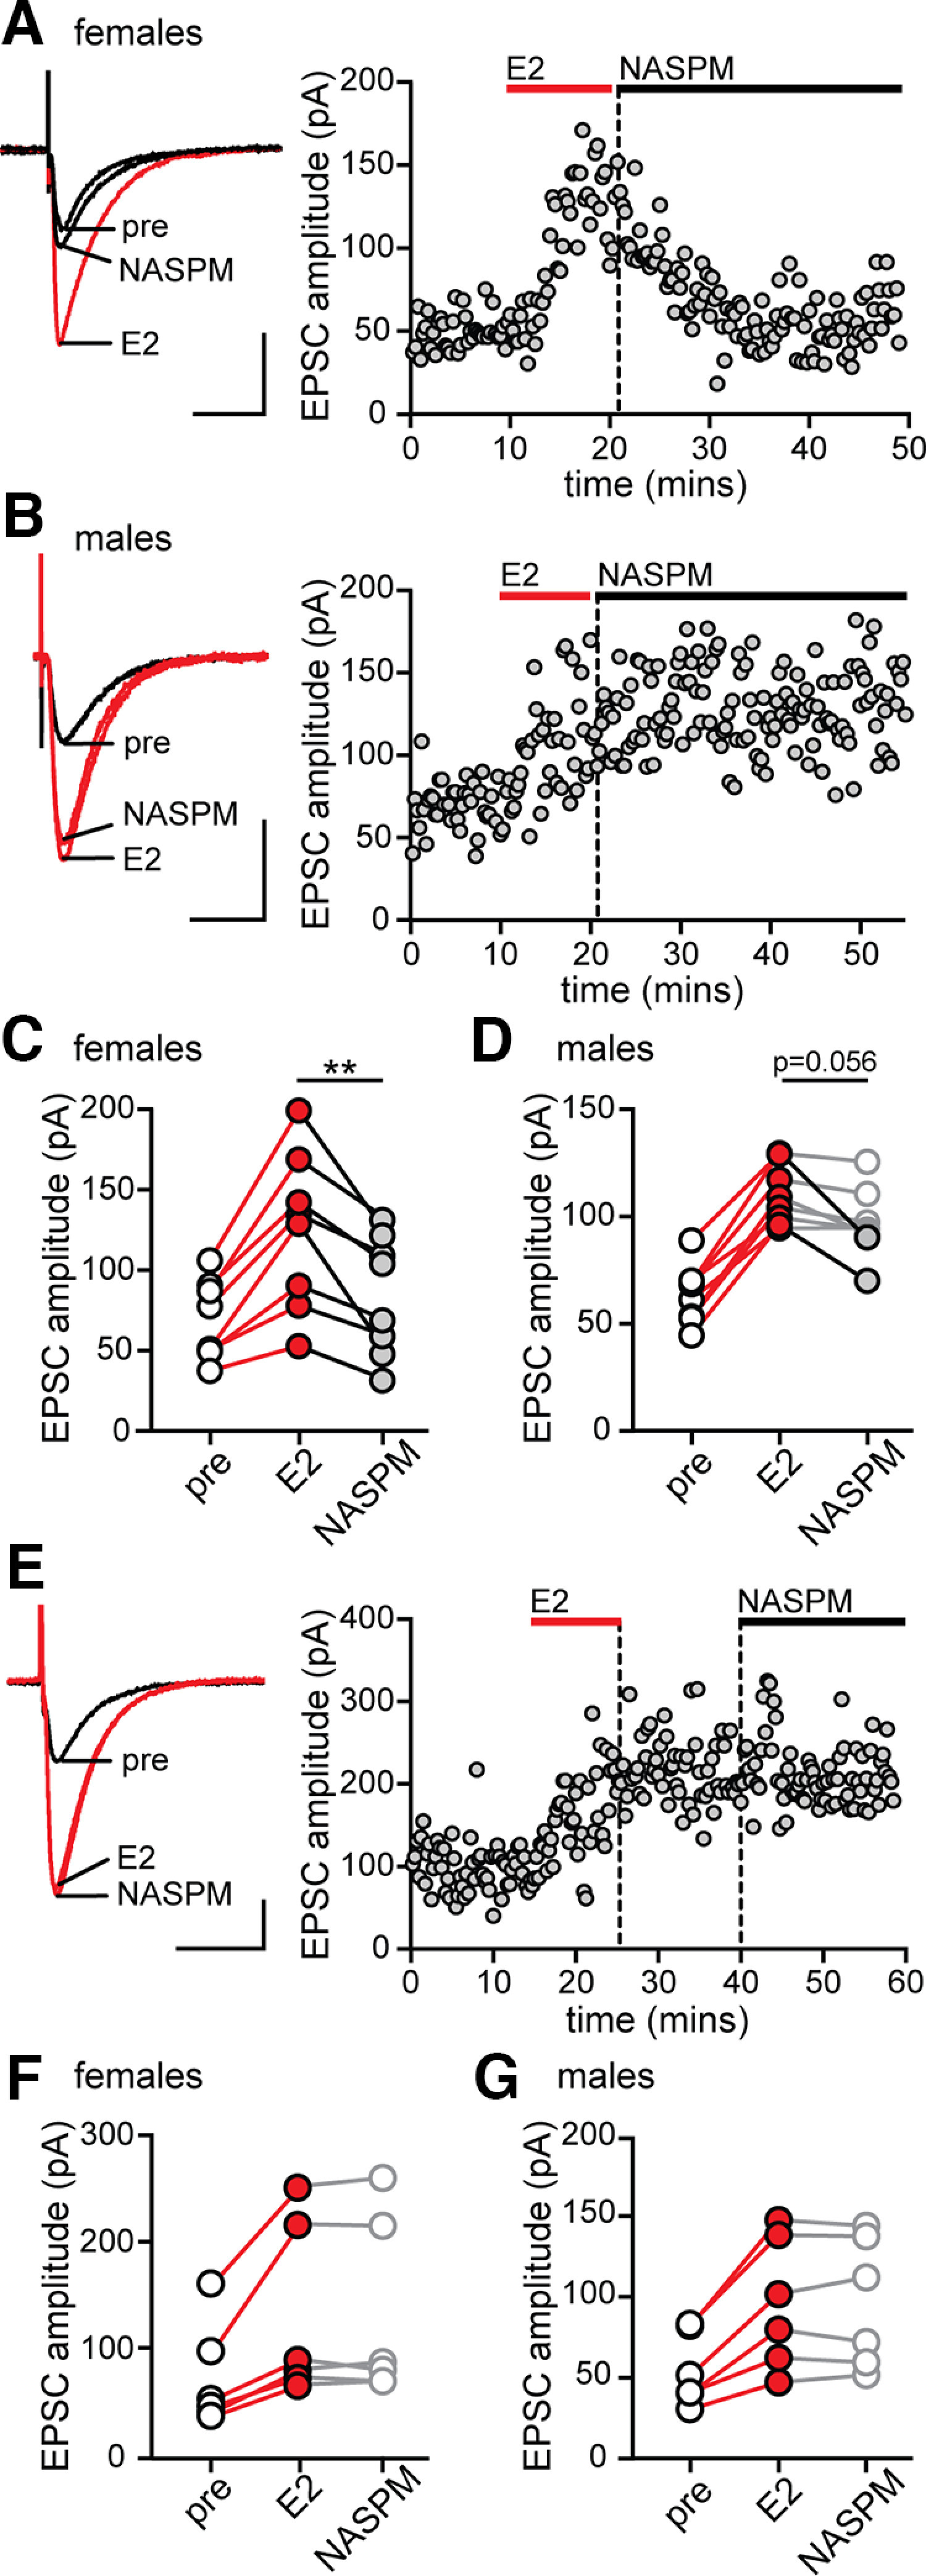
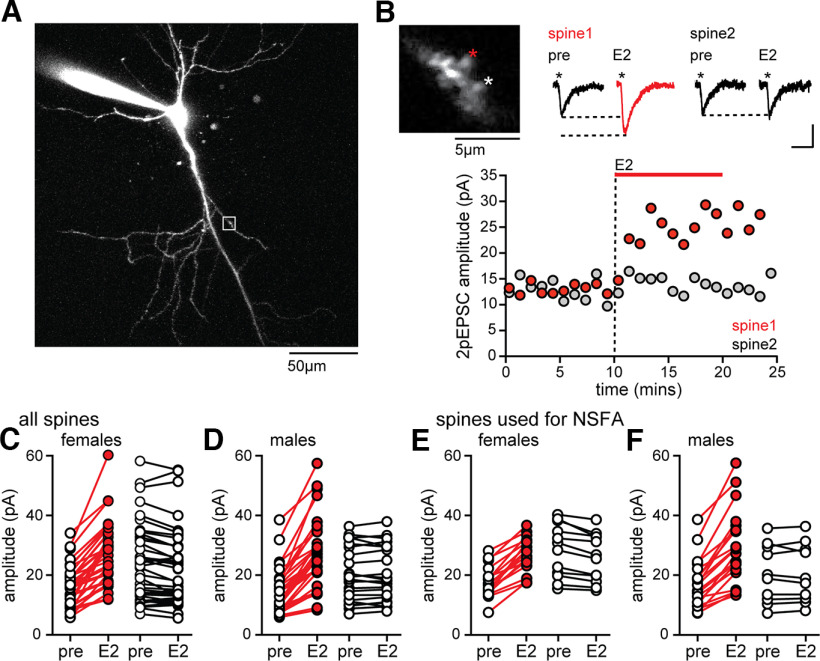
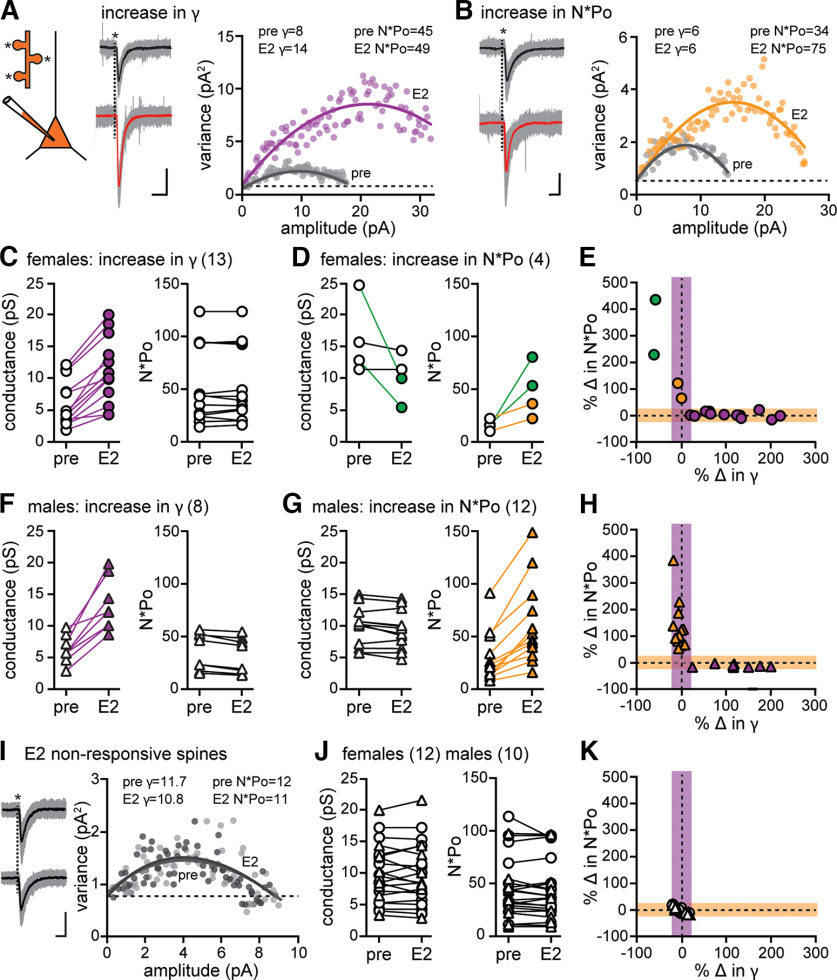
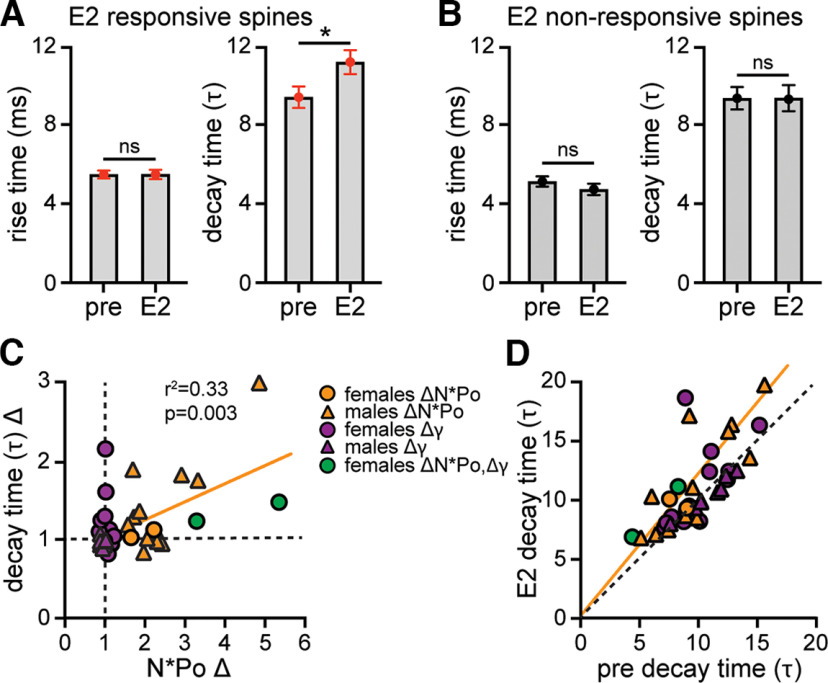
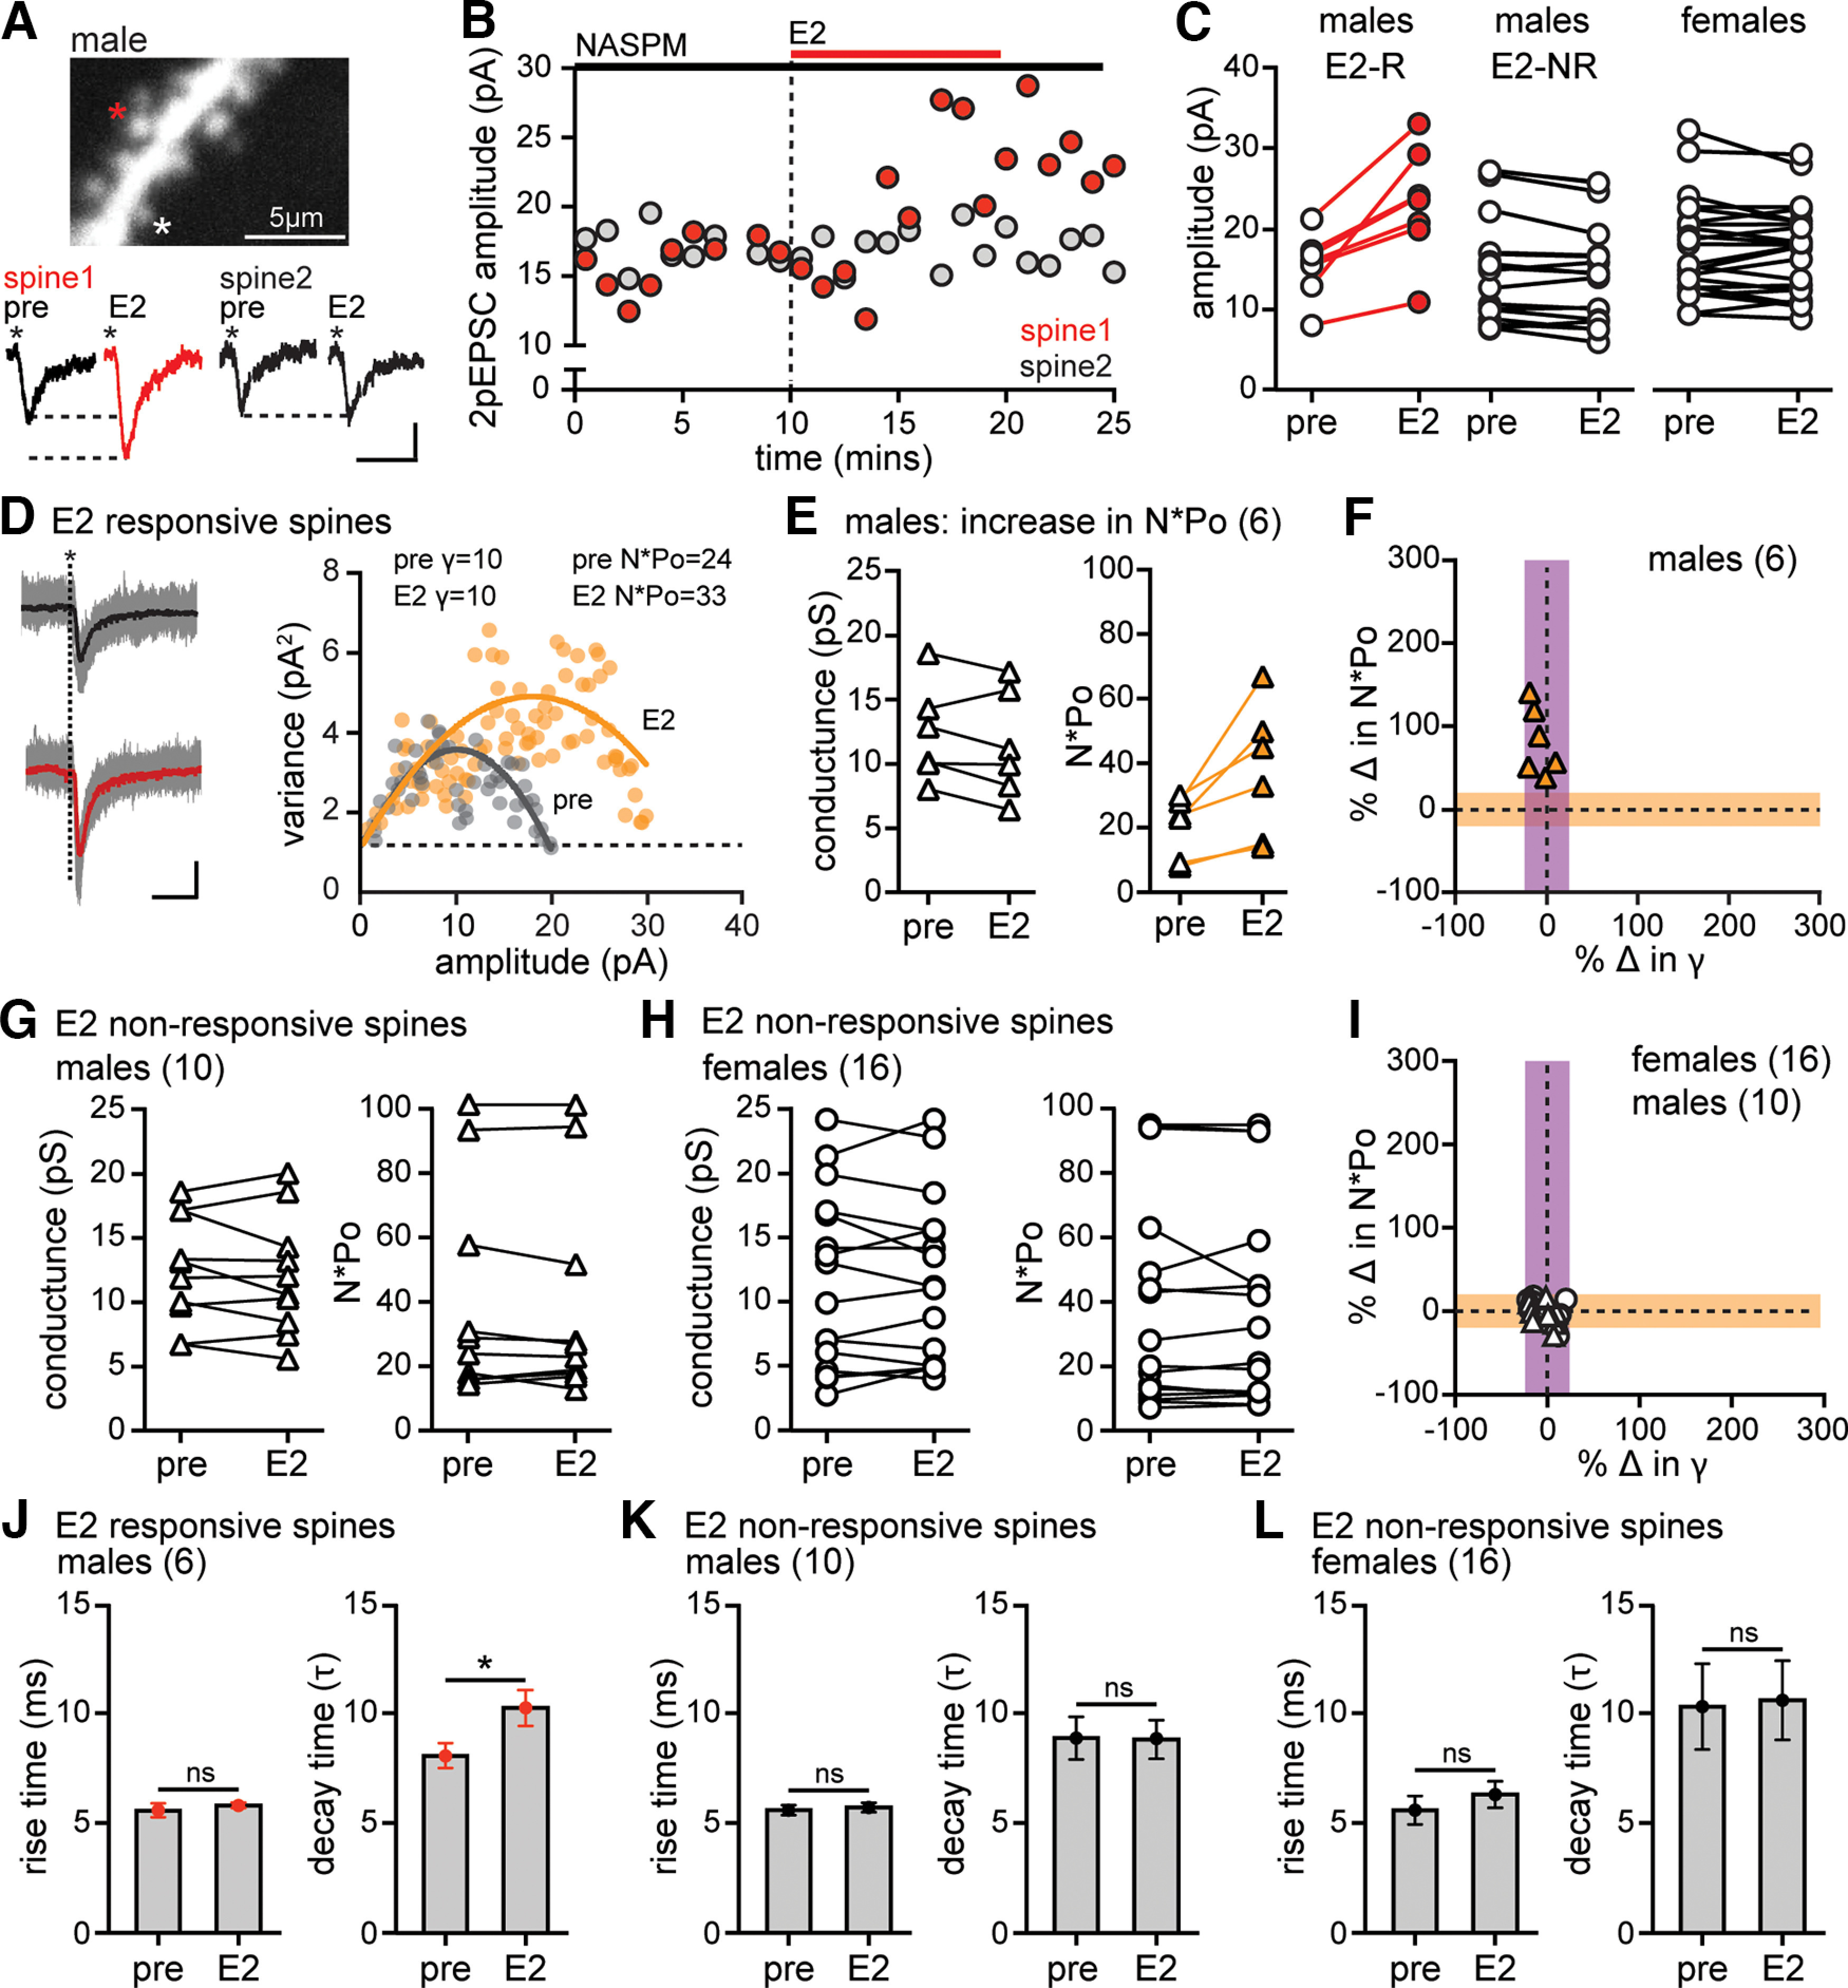
17β-estradiol (E2) is synthesized in the hippocampus of both sexes and acutely potentiates excitatory synapses in each sex. Previously, we found that the mechanisms for initiation of E2-induced synaptic potentiation differ between males and females, including in the molecular signaling involved. Here, we used electrical stimulation and two-photon glutamate uncaging in hippocampal slices from adult male and female rats to investigate whether the downstream consequences of distinct molecular signaling remain different between the sexes or converge to the same mechanism(s) of expression of potentiation. This showed that synaptic activity is necessary for expression of E2-induced potentiation in females but not males, which paralleled a sex-specific requirement in females for calcium-permeable AMPARs (cpAMPARs) to stabilize potentiation. Nonstationary fluctuation analysis of two-photon evoked unitary synaptic currents showed that the postsynaptic component of E2-induced potentiation occurs either through an increase in AMPAR conductance or in nonconductive properties of AMPARs (number of channels × open probability) and never both at the same synapse. In females, most synapses (76%) were potentiated via increased AMPAR conductance, whereas in males, more synapses (60%) were potentiated via an increase in nonconductive AMPAR properties. Inhibition of cpAMPARs eliminated E2-induced synaptic potentiation in females, whereas some synapses in males were unaffected by cpAMPAR inhibition; these synapses in males potentiated exclusively via increased AMPAR nonconductive properties. This sex bias in expression mechanisms of E2-induced synaptic potentiation underscores the concept of latent sex differences in mechanisms of synaptic plasticity in which the same outcome in each sex is achieved through distinct underlying mechanisms.SIGNIFICANCE STATEMENT Estrogens are synthesized in the brains of both sexes and potentiate excitatory synapses to the same degree in each sex. Despite this apparent similarity, the molecular signaling that initiates estrogen-induced synaptic potentiation differs between the sexes. Here we show that these differences extend to the mechanisms of expression of synaptic potentiation and result in distinct patterns of postsynaptic neurotransmitter receptor modulation in each sex. Such latent sex differences, in which the same outcome is achieved through distinct underlying mechanisms in males versus females, indicate that molecular mechanisms targeted for drug development may differ between the sexes even in the absence of an overt sex difference in behavior or disease.

Keywords: AMPA receptor; neurosteroid; plasticity; sex difference; synapse.


Conflict of interest statement

The authors declare no competing financial interests.

Figures

Figure 1.
Figure 1.
Synaptic activity is required for E2-induced synaptic potentiation in females but not in males. A, Individual traces and time course of synaptic potentiation in a representative experiment in females in which stimulation was suspended during 10 min of E2 application and then resumed 5 min after E2 washout. Early E2 refers to the first 5 min after stimulation was resumed, and late E2 refers to the last 5 min of the recording (also in B–F). Calibration: 50 pA, 25 ms. Each point is an individual sweep (also in D). B, Group EPSC amplitude data in females (n = 7) showing that synaptic activity was required to potentiate EPSCs in females. Red points in late E2 indicate a significant increase in EPSC amplitude compared with baseline (within-cell ANOVA followed by multiple comparisons, p < 0.05; also in C). C, Normalized EPSC amplitude in E2-responsive (R) and nonresponsive (NR) recordings in the early E2 and late E2 phase of each experiment in females showing that EPSC amplitude was increased only in the late E2 phase. D, Individual traces and time course of synaptic potentiation in a representative experiment in males in which stimulation was suspended during 10 min application of E2 and then resumed 5 min after E2 washout (as in A). E, Group EPSC amplitude data in males (n = 7) showing that, in contrast to females, synaptic activity was not required to potentiate EPSCs in males. Red points in early E2 and late E2 indicate a significant difference from baseline (within-cell ANOVA followed by multiple comparisons, p < 0.05; also in F). F, Normalized EPSC amplitude in E2-responsive (R) and nonresponsive (NR) recordings in the early E2 and late E2 phase of each experiment in males showing that EPSC amplitude was increased in both phases.
Figure 2.
Figure 2.
Calcium-permeable AMPARs are required for stabilization of E2-induced synaptic potentiation in females but not in males. A, Individual traces and time course of synaptic potentiation and its reversal by NASPM in a representative experiment in females in which NASPM was applied immediately after E2 washout. Calibration: 50 pA, 25 ms. Each point is an individual sweep (also in B,E). B, Individual traces and time course of synaptic potentiation and lack of its reversal by NASPM in a representative experiment in males in which NASPM was applied immediately after E2 washout. C, Group EPSC amplitude data for all E2-responsive recordings in females (n = 8). Red points indicate a significant difference from baseline. Gray points indicate a significant effect of NASPM to reverse potentiated EPSCs (within-cell unpaired t tests, p < 0.05; also in D–G). **p < 0.01, an overall effect of NASPM to decrease EPSC amplitude compared with E2 (paired t test). D, Group EPSC amplitude data for all E2-responsive recordings in males (n = 8). NASPM decreased EPSC amplitude in two recordings (gray points) but resulted in only a statistical trend overall (paired t test, p = 0.056). E, Individual traces and time course of synaptic potentiation and lack of its reversal in a representative experiment (female) in which NASPM was applied 15 min after E2 washout. F, G, Group EPSC amplitude data for all E2-responsive experiments in females (F, n = 6) and males (G, n = 6) in which NASPM was applied 15 min after E2 washout. After stabilization of E2-induced synaptic potentiation, NASPM had no effect in either sex.
Figure 3.
Figure 3.
E2 potentiates two-photon evoked EPSCs in a subset of spines in both sexes. A, Representative CA1 pyramidal cell filled with Alexa-594 during recording. White box represents the dendritic segment targeted for 2p glutamate uncaging. B, Higher-magnification view of the dendritic segment indicated in A showing two spines that were targeted for uncaging (*), individual 2pEPSCs from each spine before (pre) and after E2, and time course of 2pEPSC potentiation in spine 1 (red) but not spine 2 (gray). Calibration: 2pEPSCs, 10 pA, 10 ms. Each point in the time course represents mean 2pEPSC amplitude per minute in each spine. C, Group EPSC amplitude data from all 2pEPSC experiments in females. Red points represent spines in which E2 significantly increased 2pEPSC amplitude (within-spine unpaired t tests, p < 0.05). White points represent spines in which E2 did not change 2pEPSC amplitude (also in D–F). D, Group EPSC amplitude data from all 2pEPSC experiments in males. E, Group EPSC amplitude data from the subset of spines in C used to perform NSFA in females. F, Group EPSC amplitude data from the subset of spines in D used to perform NSFA in males.
Figure 4.
Figure 4.
Nonstationary fluctuation analysis indicates a sex difference in AMPAR modulation that underlies expression of E2-induced synaptic potentiation. A, Glutamate was uncaged (*) at multiple dendritic spines on a dendrite of each recorded cell. Data are from a representative female spine in which E2 increased 2pEPSC amplitude and AMPAR conductance (γ), but not number × mean open probability (N*Po). Traces represent all 2pEPSCs (22 events, gray) and mean (black) during baseline and all 2pEPSCs (25 events, gray) and mean (red) after E2. Calibration: A, B, 5 pA, 5 ms. The variance versus mean plot for this spine indicated that E2 (purple) increased γ compared with baseline (pre, gray) with no change in N*Po. The goodness-of-fit R2 values for these plots are 0.92 (pre) and 0.82 (E2). Dotted line indicates the background variance (also in B,I). B, Data are from a representative male spine in which E2 increased 2pEPSC amplitude and N*Po, but not conductance. Traces represent all 2pEPSCs (19 events, gray) and mean (black) during baseline and all 2pEPSCs (33 events, gray) and mean (red) after E2. The variance versus mean plot for this spine indicated that E2 (gold) increased N*Po compared with baseline (pre, gray) with no change in conductance. The goodness-of-fit R2 values for these plots are 0.88 (pre) and 0.85 (E2). C, Group conductance and N*Po estimates in females obtained by NSFA in E2-responsive spines that showed increased conductance (purple) compared with baseline (n = 13) with no change in N*Po in the same spines. D, Group conductance and N*Po estimates in females obtained by NSFA in E2-responsive spines that showed increased N*Po compared with baseline (n = 4) with no increase in conductance. Two of these spines showed no change in conductance (open), and two showed a decrease (green). E, Normalized changes in N*Po versus conductance for the same E2-responsive spines in females shown in C and D (n = 17), where shaded regions represent the 20% threshold for a change in either property (also in H,K). F, Group conductance and N*Po estimates in males obtained by NSFA in E2-responsive spines that showed increased conductance (purple) compared with baseline (n = 8) with no change in N*Po. G, Group conductance and N*Po estimates in males obtained by NSFA in E2-responsive spines that showed increased N*Po compared with baseline (n = 12) with no change in conductance. The fraction of E2-responsive spines showing an increase in conductance was significantly greater in females than males (Fisher’s exact test, p < 0.05). H, Normalized changes in N*Po versus conductance for the same E2-responsive spines in males shown in F and G (n = 20). I, Data are from a representative spine in which E2 did not change EPSC amplitude. Traces represent all 2pEPSCs (26 events, gray) and mean (black) during baseline and all 2pEPSCs (20 events, gray) and mean (black) after E2. The variance versus mean plot for this spine indicated that E2 (dark gray) affected neither conductance nor N*Po compared with baseline (pre, light gray). The goodness-of-fit R2 values for these plots are 0.88 (pre) and 0.90 (E2). J, Group conductance and N*Po measurements obtained by NSFA in all E2-nonresponsive spines (n = 12 females, n = 10 males), showing no changes in either property. K, Normalized change in N*Po versus conductance for the same E2-nonresponsive spines shown in J (n = 12 females, n = 10 males).
Figure 5.
Figure 5.
Relationship between E2 modulation of 2pEPSC kinetics and AMPAR single-channel properties. A, Mean ± SEM 2pEPSC rise time and decay time (τ) in the same E2-responsive spines shown in Figure 4. B, Mean ± SEM 2pEPSC rise time and decay time (τ) in the same E2-nonresponsive spines shown in Figure 4. E2 increased decay time specifically in E2-responsive spines but did not affect rise time in any spines. *p < 0.05 (unpaired t test). C, Comparison of fold-change in decay time (τ) versus AMPAR number × mean open probability (N*Po) among all E2-responsive spines showing a statistically significant correlation (r2 = 0.33, p = 0.003). D, Comparison of decay time (τ) in E2 versus baseline (pre) conditions among all E2-responsive spines using linear regression analysis showing that the majority of spines in which decay time increased also showed an increase in N*Po (orange and green). Orange line indicates the fitting for spines that show an increase in N*Po, which is different from the perfect linear fit (black dashed line, p < 0.001, simple linear regression).
Figure 6.
Figure 6.
cpAMPARs are required for the E2-induced increase in AMPAR conductance. A, High-magnification view of a dendritic segment from a cell (male) filled with Alexa-594 during recording in NASPM showing two dendritic spines that were targeted for uncaging (*) and individual 2pEPSCs from each spine before (pre) and after E2. Calibration: 5 pA, 5 ms. B, Time course of 2pEPSC potentiation in spine 1 (red) but not spine 2 (gray) for the same spines shown in A. C, Group 2pEPSC amplitude data for all E2-responsive (E2-R, red) and nonresponsive (E2-NR, white) spines recorded in NASPM, showing potentiation in a subset of spines in males (n = 7), whereas other spines in males (n = 10) and all spines in females (n = 16) were E2-nonresponsive. D, 2pEPSC traces and variance versus mean plot for a representative male spine in which E2 increased 2pEPSC amplitude and AMPAR number × mean open probability (N*Po) with no change in conductance (γ). Traces represent all 2pEPSCs (18 events, gray) and mean (black) during baseline and all 2pEPSCs (23 events, gray) and mean (red) after E2. Calibration: 5 pA, 5 ms. The goodness-of-fit R2 values for these plots are 0.79 (pre, gray) and 0.86 (E2, gold). Dotted line indicates the background variance. E, Group data showing conductance and N*Po estimates obtained by NSFA in the 6 male spines that showed E2-induced 2pEPSC potentiation in NASPM and met criteria for analysis. F, Normalized changes in N*Po versus conductance from NSFA in all E2-responsive male spines shown in E in which the shaded areas represent the 20% threshold for a change in either property. All 6 E2-responsive male spines recorded in NASPM showed increased N*Po (orange triangles) with no change in conductance. G, Group data showing no changes in conductance or N*Po estimates obtained by NSFA in the 10 E2-nonresponsive male spines. H, Group data showing no changes in conductance or N*Po estimates obtained by NSFA in any of the 16 E2-nonresponsive female spines. I, Normalized changes in N*Po versus conductance from NSFA in all E2-nonresponsive spines in NASPM (n = 16 females, n = 10 males). J, Mean ± SEM 2pEPSC rise time and decay time (τ) in E2-responsive male spines recorded in NASPM showing that E2 increased in decay time specifically in E2-responsive spines in males (*p < 0.05, unpaired t test) with no change in rise time in any of the spines. K, L, Mean ± SEM 2pEPSC rise time and decay time in E2-nonresponsive male (K) and female (L) spines recorded in NASPM showing no changes (unpaired t test).

Similar articles

Cited by

References

    1. Abel T, Nguyen PV, Barad M, Deuel TA, Kandel ER, Bourtchouladze R (1997) Genetic demonstration of a role for PKA in the late phase of LTP and in hippocampus-based long-term memory. Cell 88:615–626. 10.1016/s0092-8674(00)81904-2 - DOI - PubMed
    1. Adesnik H, Nicoll RA (2007) Conservation of glutamate receptor 2-containing AMPA receptors during long-term potentiation. J Neurosci 27:4598–4602. 10.1523/JNEUROSCI.0325-07.2007 - DOI - PMC - PubMed
    1. Andrasfalvy BK, Magee JC (2004) Changes in AMPA receptor currents following LTP induction on rat CA1 pyramidal neurones. J Physiol 559:543–554. 10.1113/jphysiol.2004.065219 - DOI - PMC - PubMed
    1. Banke TG, Bowie D, Lee H, Huganir RL, Schousboe A, Traynelis SF (2000) Control of GluR1 AMPA receptor function by cAMP-dependent protein kinase. J Neurosci 20:89–102. 10.1523/JNEUROSCI.20-01-00089.2000 - DOI - PMC - PubMed
    1. Benke T, Traynelis SF (2019) AMPA-type glutamate receptor conductance changes and plasticity: still a lot of noise. Neurochem Res 44:539–548. - PMC - PubMed

Publication types

LinkOut - more resources