

Revised historical Northern Hemisphere black carbon emissions based on inverse modeling of ice core records
- PMID: 36650124
- PMCID: PMC9845213
- DOI: 10.1038/s41467-022-35660-0
Revised historical Northern Hemisphere black carbon emissions based on inverse modeling of ice core records
Abstract
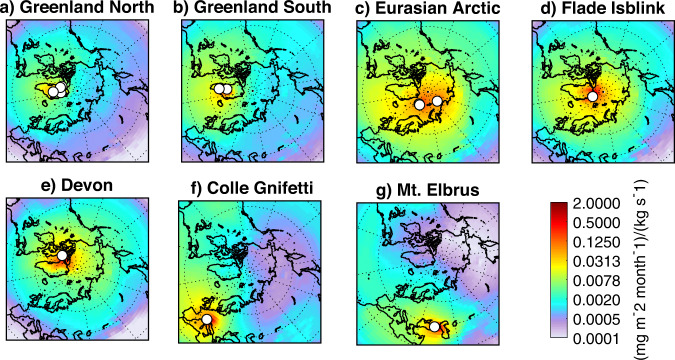
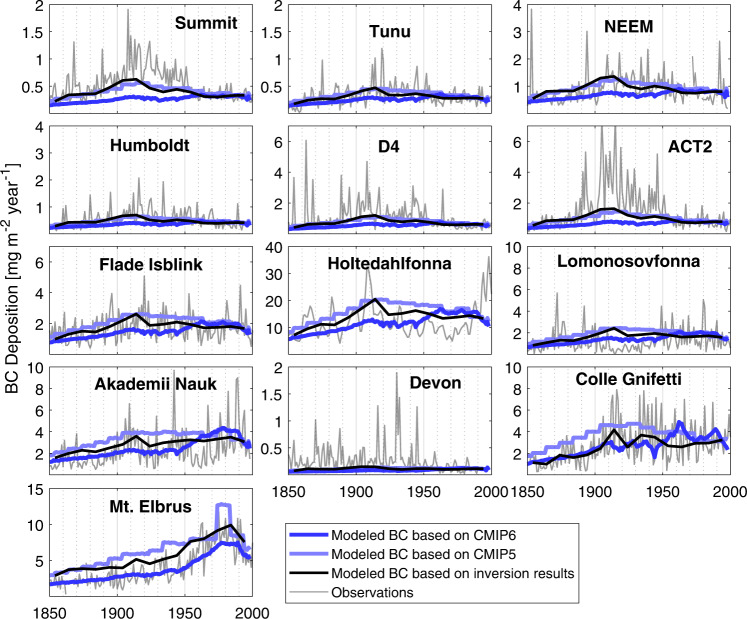
Black carbon emitted by incomplete combustion of fossil fuels and biomass has a net warming effect in the atmosphere and reduces the albedo when deposited on ice and snow; accurate knowledge of past emissions is essential to quantify and model associated global climate forcing. Although bottom-up inventories provide historical Black Carbon emission estimates that are widely used in Earth System Models, they are poorly constrained by observations prior to the late 20th century. Here we use an objective inversion technique based on detailed atmospheric transport and deposition modeling to reconstruct 1850 to 2000 emissions from thirteen Northern Hemisphere ice-core records. We find substantial discrepancies between reconstructed Black Carbon emissions and existing bottom-up inventories which do not fully capture the complex spatial-temporal emission patterns. Our findings imply changes to existing historical Black Carbon radiative forcing estimates are necessary, with potential implications for observation-constrained climate sensitivity.
© 2023. The Author(s).
Conflict of interest statement
The authors declare no competing interests.
Figures

References
-
- Bond TC, et al. Bounding the role of black carbon in the climate system: A scientific assessment. J. Geophys. Res.-Atmos. 2013;118:5380–5552. doi: 10.1002/jgrd.50171. - DOI
-
- AMAP: Arctic Monitoring and Assessment Programme. Assessment 2015: Black Carbon and Ozone as Arctic Climate Forcers. Technical report, AMAP, Oslo, Norway, vii + 116 pp., https://www.amap.no/documents/doc/amap-assessment-2015-black-carbon-and-... (accessed 6th January 2023), (2015).
-
- IPCC. Summary for Policymakers. In: Climate Change 2021. (2021) 10.1017/9781009157896.001. (Fig SPM.2)
-
- Flanner MG, Zender CS, Randerson JT, Rasch PJ. Present-day climate forcing and response from black carbon in snow. J. Geophys. Res-Atmos. 2007;112:D11202. doi: 10.1029/2006JD008003. - DOI
-
- Kang S, Zhang Y, Qian Y, Wang H. A review of black carbon in snow and ice and its impact on the cryosphere. Earth-Sci. Rev. 2020;210:103346. doi: 10.1016/j.earscirev.2020.103346. - DOI
Publication types
MeSH terms
Substances
LinkOut - more resources
Full Text Sources
Miscellaneous
