. 2023 Jan 17;14(1):282.
doi: 10.1038/s41467-022-35752-x.

Transcriptional vulnerabilities of striatal neurons in human and rodent models of Huntington's disease

Affiliations

Transcriptional vulnerabilities of striatal neurons in human and rodent models of Huntington's disease

Ayano Matsushima et al. Nat Commun. .

Abstract

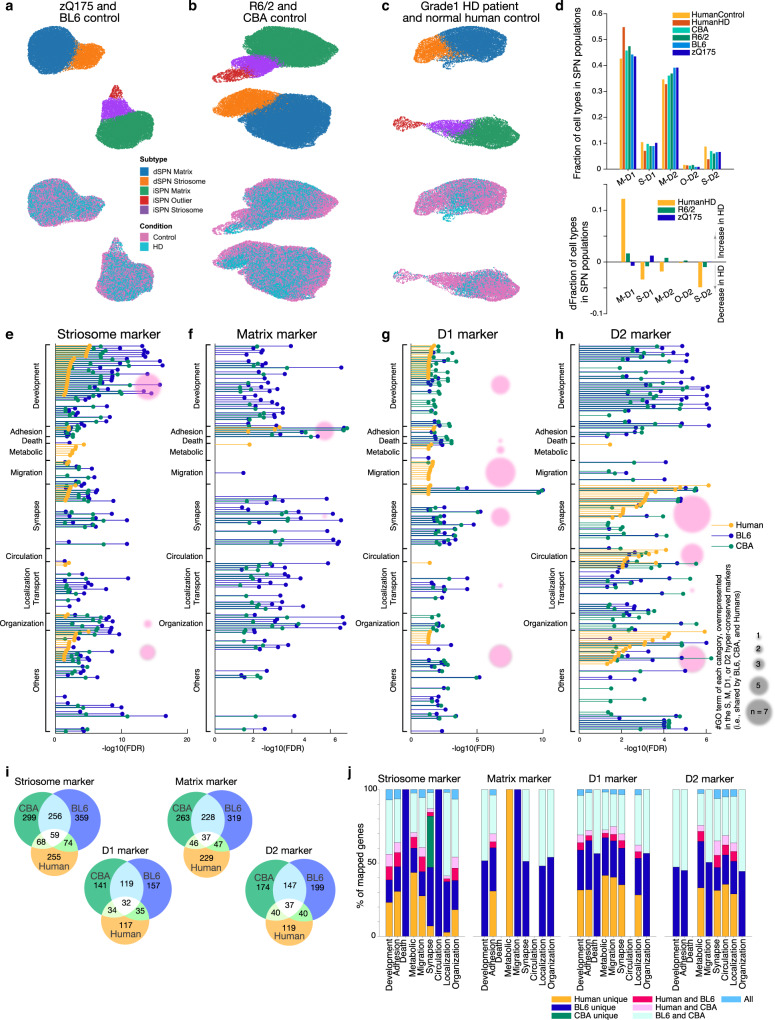
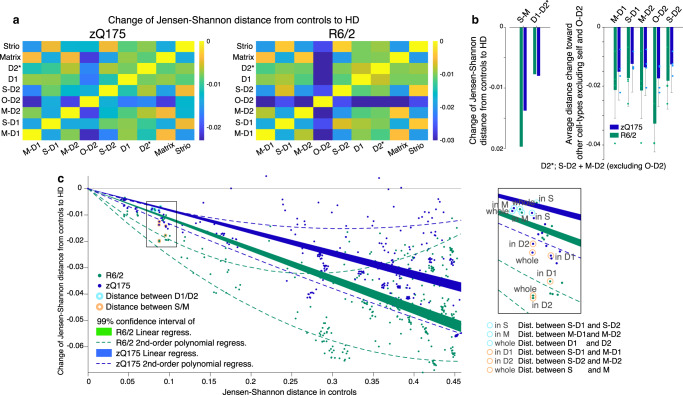
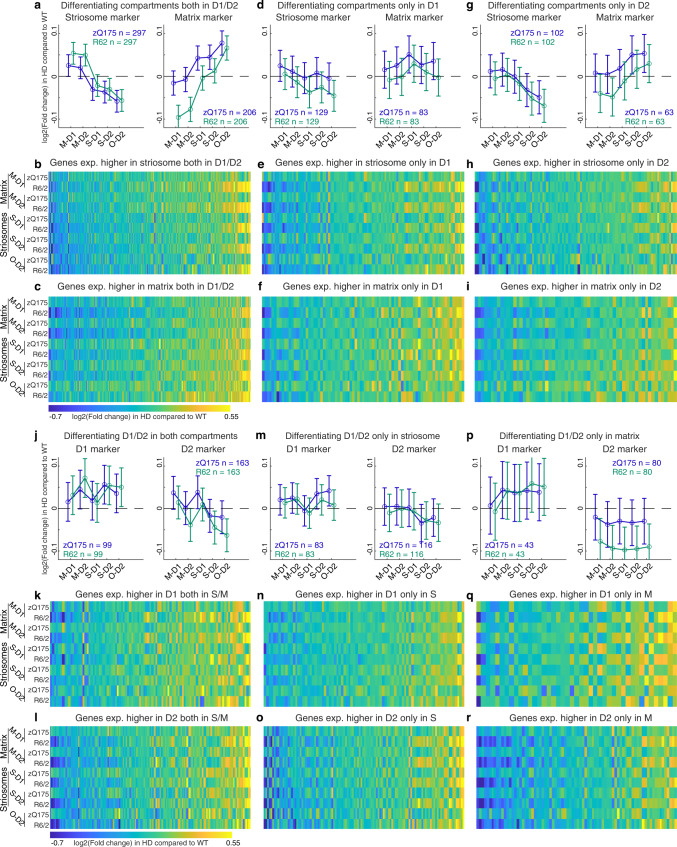
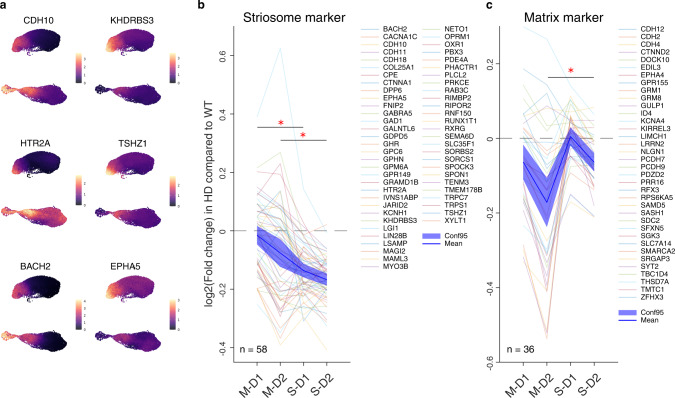
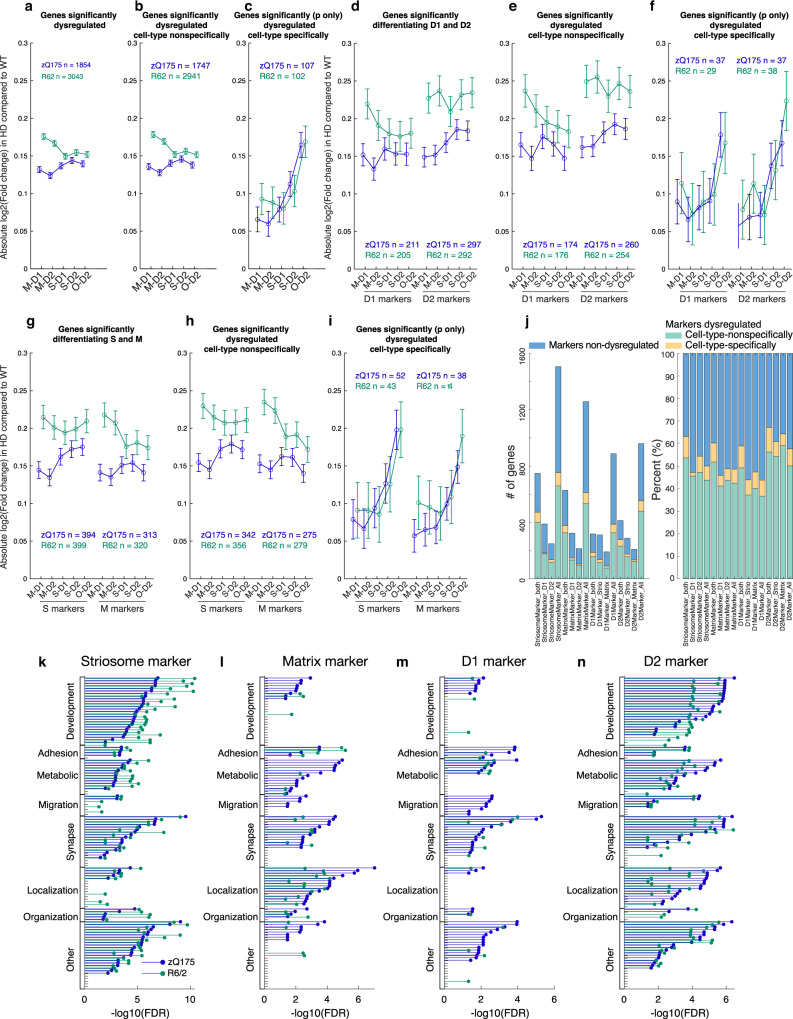
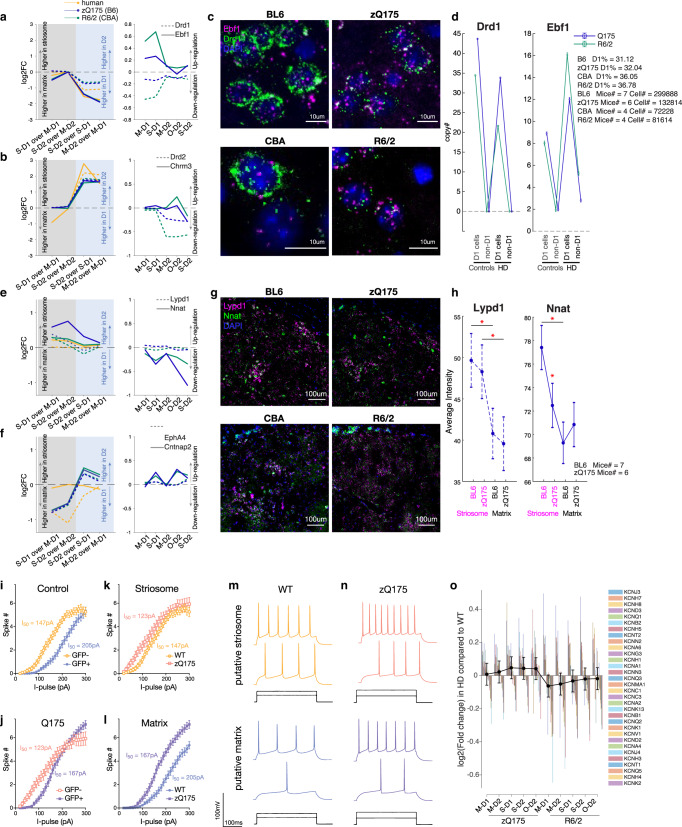
Striatal projection neurons (SPNs), which progressively degenerate in human patients with Huntington's disease (HD), are classified along two axes: the canonical direct-indirect pathway division and the striosome-matrix compartmentation. It is well established that the indirect-pathway SPNs are susceptible to neurodegeneration and transcriptomic disturbances, but less is known about how the striosome-matrix axis is compromised in HD in relation to the canonical axis. Here we show, using single-nucleus RNA-sequencing data from male Grade 1 HD patient post-mortem brain samples and male zQ175 and R6/2 mouse models, that the two axes are multiplexed and differentially compromised in HD. In human HD, striosomal indirect-pathway SPNs are the most depleted SPN population. In mouse HD models, the transcriptomic distinctiveness of striosome-matrix SPNs is diminished more than that of direct-indirect pathway SPNs. Furthermore, the loss of striosome-matrix distinction is more prominent within indirect-pathway SPNs. These results open the possibility that the canonical direct-indirect pathway and striosome-matrix compartments are differentially compromised in late and early stages of disease progression, respectively, differentially contributing to the symptoms, thus calling for distinct therapeutic strategies.


Conflict of interest statement

The authors declare no competing interests.

Figures

Fig. 1
Fig. 1. Identification and characterization of human and rodent SPN cell-type-specific markers.
ac ACTIONet UMAP plots of distinct dSPN (D1) and iSPN (D2) parent clusters, and striosomal and matrix sub-clusters within zQ175 (cyan) and their control (magenta) samples (a), R6/2 (cyan) and their control (magenta) samples (b), and a human Grade 1 HD patient (cyan) and healthy controls (magenta, c). Samples are described in Supplementary Dataset 1. d Fraction of each SPN subtype in the entire SPN population identified (top) and the change of fractions in HD as compared to controls (bottom). e FDR for enriched GO terms in universal striosome markers found in BL6 (blue) and CBA (green) mice, and in human (orange). Within the GO terms overrepresented in striosome, matrix, D1, or D2 markers, top (i.e., lowest FDR) 40 GO terms are included, and grouped into 9 categories. In each group, the GO terms are sorted by FDRs for humans. Pink circles indicate the number of GO terms in each category, found to be commonly overrepresented in the hyper-conserved striosome markers. fh Same as e but for universal matrix (f), D1 (g), or D2 (h) markers. i Venn diagrams showing the marker overlaps across species and across mouse strains for universal striosome, matrix, D1 or D2 markers as labeled. j Overlap of marker genes across species that are mapped onto GO terms related to development, adhesion, metabolic, migration, synapse, circulation, localization/transport, and organization (see Supplementary Dataset 2 for GO IDs included). See also Supplementary Figs. 1–5.
Fig. 2
Fig. 2. Striosome-matrix transcriptomic distinction is more vulnerable than those of D1-D2 in HD.
a Jensen-Shannon distances between pairs of cell types for zQ175 (left) and R6/2 (right) as compared to control. Negative values indicate loss of transcriptomic distinction. b Summary of loss of transcriptomic distinctions measured by Jensen-Shannon distance. Distinction between striosomes and matrix (S-M) and between dSPN and iSPN (D1-D2*) are shown. Right: Loss of distinction between each pair of cell-types. Blue (zQ175) and green (R6/2) bars indicate average loss of distances from each cell-type (labeled above) toward other cell types (excluding self and O-D2). Thus, the numbers of data points are 4 for all SPN subtypes other than O-D2 (n = 3), and all data were plotted as independent measures. D2* does not include O-D2. Error bars indicate 95% confidence intervals. c Loss of Jensen-Shannon distances in HD as a function of those in controls are shown for every pair of cell types in the striatum of zQ175 (blue) and R6/2 (green) models. Data points corresponding to S-M distinctions are indicated by orange circles, whereas those for D1-D2 are indicated by cyan circles. Loss of distance (i.e., loss of transcriptomic distinction in HD) was larger for endogenously more distinct cell-type pairs in controls as captured by the 99% confidence intervals of linear regression (shades) or second order polynomial regression (broken lines). Inset: enlarged image of boxed area. Note that loss of distance between S-M populations is larger than expected from the entire striatal dataset, whereas loss of distance between D1-D2 populations is smaller.
Fig. 3
Fig. 3. S-M markers but not D1-D2 markers exhibit cell-type-dependent dysregulation to blur their transcriptomic, discriminative identities.
a Alteration of striosomal (left) and matrix (right) marker expressions, which differentiated the control compartments both in dSPN and iSPN populations in zQ175 (blue) and R6/2 (green) models. N indicates number of markers included in each panel. Error bars indicate 95% confidence intervals for the averages. b, c Alteration of striosome (b) or matrix (c) marker expressions in a. di, Same as in ac, but for markers differentiating the compartments only in D1 (df) or D2 (gi) population. j, Alteration of dSPN (left) and iSPN (right) marker expression, which differentiated D1-D2 SPNs in both compartments in controls, for each model. N indicates number of markers included in each panel. Error bars indicate 95% confidence intervals for the averages. k, l Alterations of D1 (k) or D2 (l) marker expressions in j, shown for each cell type of each model. mr Same as in jl, but for markers differentiating D1-D2 SPNs only in striosomes mo or in matrix pr. See also Supplementary Fig. 6.
Fig. 4
Fig. 4. Data from the human Grade 1 HD patient indicate the loss of compartmental identities as a conserved signature of HD.
a Differential expression of conserved striosome markers is shown for human data including Grade 1 HD patient and controls as in Fig. 1c. Counts of individual transcripts are shown in color codes at right. b, c Alteration of conserved striosome marker (b) and conserved matrix marker (c) expressions in the human Grade 1 HD patient relative to controls, shown as log2(fold change of the expression in HD as compared to that in controls). N indicates the number of markers included in each panel. One-way ANOVA followed by Tukey-Kramer post-hoc multiple comparison test. One-way ANOVA: p = 6.92 × 1010, multiple comparison: p = 1.14 × 106 for M-D1 vs. S-D1, p = 5.120 × 104 for M-D2 vs. S-D2 for conserved striosome marker in b. One-way ANOVA: p = 2.43 × 106, multiple comparison: p = 0.1349 for M-D1 vs. S-D1, p = 0.0038 for M-D2 vs. S-D2 for conserved matrix marker in c.
Fig. 5
Fig. 5. Cell-type-specific dysregulations reflect the intrinsic vulnerability shared across multiple HD models.
ac Only cell-type-specific gene dysregulations are shared between the two HD models. Average degrees of dysregulation, i.e., absolute value of log2(fold change of the expression in HD as compared to that in controls), are shown for all dysregulated genes detected with the criteria of abs(log2FC) > 0.1 and p < 0.001 in at least one of four canonical cell types (a), or the subset of them that are unidirectionally dysregulated (i.e., upregulated, or downregulated in all four cell types, b). In c, we first selected genes with significant dysregulation (p < 0.001) in at least one of four canonical cell types, then further restrict to the genes that are dysregulated bidirectionally dependent on the cell types (i.e., upregulated in one cell type(s) and downregulated in another cell type(s)). N indicates number of markers included in each panel. Error bars indicate 95% confidence intervals. One-way ANOVA followed by Tukey-Kramer post-hoc multiple comparison test. df, Same as ac but restricted for D1-D2 markers. gi, Same as ac but restricted for S-M markers. j, Composition of patterns of dysregulation for D1-D2 markers and S-M markers. k, FDR for enriched GO terms in dysregulated striosome markers in zQ175 (blue) or R6/2 (green) mice. Within the GO terms overrepresented in dysregulated striosome, dysregulated matrix, dysregulated D1, or dysregulated D2 markers, top (i.e., lowest FDR) 40 GO terms are included, and grouped into 9 categories. In each group, the GO terms are sorted by FDRs for zQ175 mice. l–n, Same as k but showing FDRs of the enrichments in dysregulated matrix (l), dysregulated D1 (m), or dysregulated D2 (n) markers. See also Supplementary Fig. 7.
Fig. 6
Fig. 6. Histological and physiological loss of compartmental identity in HD model mice.
a snRNA-seq data for dSPN markers, i.e., Drd1 (broken lines) and Ebf1 (solid lines). Left: Differential expression was measured between the cell-type pairs indicated below and shown as log2(fold change). Right: Expressions in HD models are compared to those in controls. b Same as in a, but for iSPN markers, i.e., Drd2 (broken lines) and Chrm3 (solid lines). c FISH images of sections obtained from the anterior striatum in the two HD models compared to their controls, stained for Drd1 (green), Ebf1 (magenta), and DAPI (blue). d Quantification of FISH image. Copy numbers (i.e., number of detected spots) for Drd1 (left) and Ebf1 (right) are shown separately for D1 and non-D1 cells in controls or HD models. Error bars indicate 95% confidence intervals from the averages. e, f Same as in a and b, but for striosome markers (e), i.e., Lypd1 (broken lines) and Nnat (solid lines), or matrix markers (f), i.e., EphA4 (broken lines) and Cntnap2 (solid lines). g Same as in c but for Lypd1 (magenta), Nnat (green), and DAPI (blue). The images were obtained from anterior striatal sections of the same mice shown in c. h Quantification of FISH image. Average intensity of FISH signals is shown for Lypd1 (left) and Nnat (right) separately for striosomes and matrix in zQ175 mice and in their controls. Error bars indicate 95% confidence intervals. One-way ANOVA followed by Tukey-Kramer post-hoc multiple comparison test. One-way ANOVA: p = 0.0001, multiple comparison: striosomes vs. matrix in BL6; p = 0.0017, striosomes vs. matrix in zQ175; p = 0.0073 for Lypd1 (left). One-way ANOVA: p = 5.89 × 107, multiple comparison: BL6 vs. zQ175 in striosomes, p = 0.0052 for Nnat (right). il Using zQ175 mice crossed with a matrix reporter mouse line (CalDAG-GEFI-GFP), electrophysiological properties of putative striosomal (GFP-negative, orange) and putative matrix (GFP-positive, purple) SPNs were examined ex vivo. Current-frequency responses are shown for control (i) and zQ175 (j) mice, or for putative striosomal SPNs (k) and putative matrix SPNs (l). I50 is defined as the input current producing 50% of maximal spike numbers. Error bars indicate SEM. Control: N = 10 mice, n = 212 neurons. zQ175: N = 9 mice, n = 198 neurons. The mean ± SD number of cells recorded per each mouse evaluated was 22 ± 6. m Representative traces in control mice are shown separately for putative striosomal (top, orange) and putative matrix (bottom, purple) SPNs in response to I50 and I90 of putative striosomal SPNs. n Same as in m, but for zQ175 mice. o Dysregulation of potassium channels separately shown for each cell-type of R6/2 and zQ175 mice as compared to controls. We included all 32 out of 79 potassium channels whose dysregulations were quantifiable. Error bars indicate 95% confidence intervals from the averages. See also Supplementary Fig. 8.

References

    1. McColgan P, Tabrizi SJ. Huntington’s disease: a clinical review. Eur. J. Neurol. 2018;25:24–34. doi: 10.1111/ene.13413. - DOI - PubMed
    1. Deng YP, et al. Differential loss of striatal projection systems in Huntington’s disease: a quantitative immunohistochemical study. J. Chem. Neuroanat. 2004;27:143–164. doi: 10.1016/j.jchemneu.2004.02.005. - DOI - PubMed
    1. Glass M, Dragunow M, Faull RLM. The pattern of neurodegeneration in Huntington’s disease: a comparative study of cannabinoid, dopamine, adenosine and GABAA receptor alterations in the human basal ganglia in Huntington’s disease. Neurosci. 2000;97:505–519. doi: 10.1016/S0306-4522(00)00008-7. - DOI - PubMed
    1. Langfelder P, et al. Integrated genomics and proteomics define huntingtin CAG length-dependent networks in mice. Nat. Neurosci. 2016;19:623–633. doi: 10.1038/nn.4256. - DOI - PMC - PubMed
    1. Reiner A, et al. Differential loss of striatal projection neurons in Huntington disease. Proc. Natl Acad. Sci. USA. 1988;85:5733–5737. doi: 10.1073/pnas.85.15.5733. - DOI - PMC - PubMed

Publication types