. 2023 Jan 17;14(1):75.
doi: 10.1038/s41467-022-35637-z.

Ligand-tethered lipid nanoparticles for targeted RNA delivery to treat liver fibrosis

Affiliations

Ligand-tethered lipid nanoparticles for targeted RNA delivery to treat liver fibrosis

Xuexiang Han et al. Nat Commun. .

Abstract

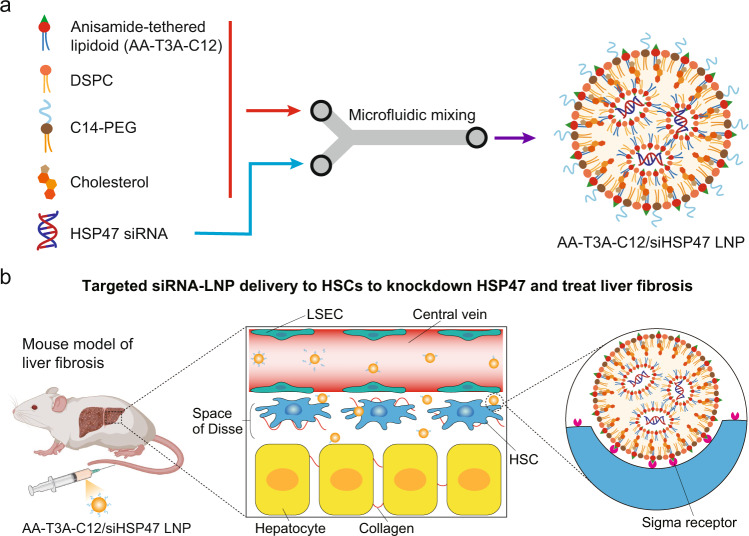
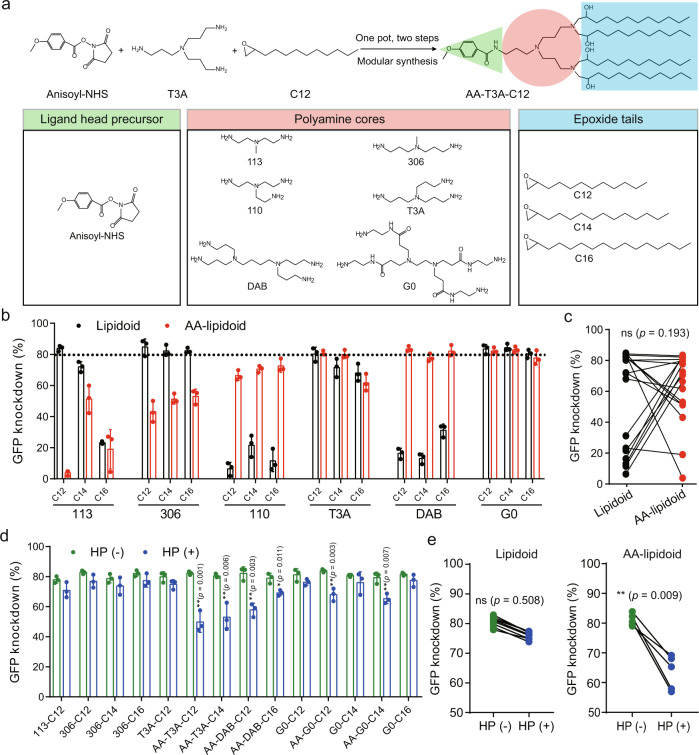
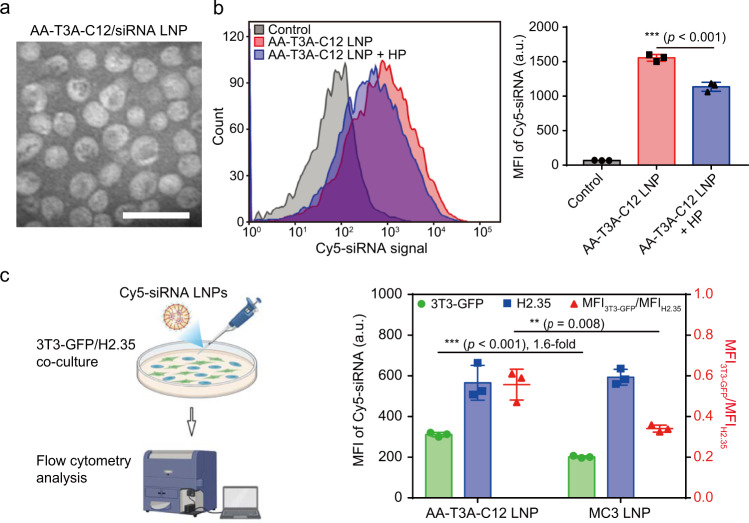
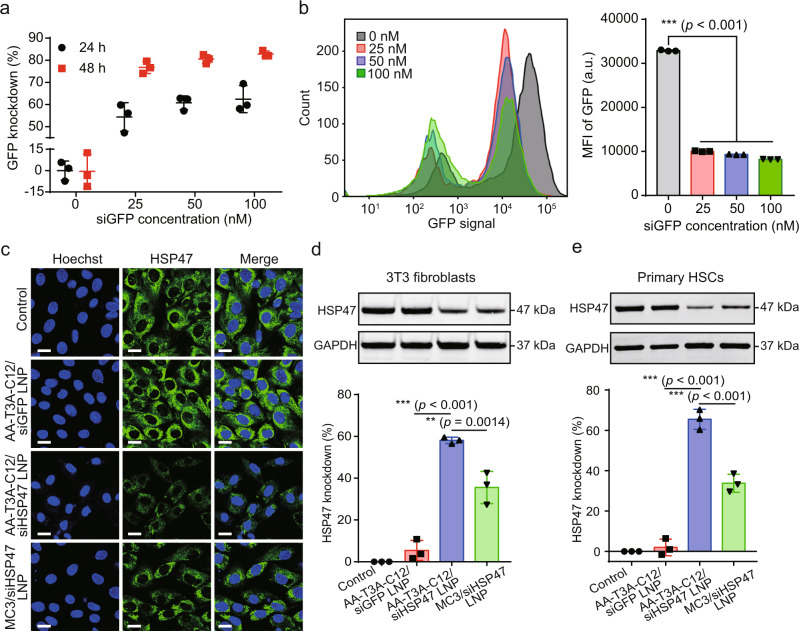
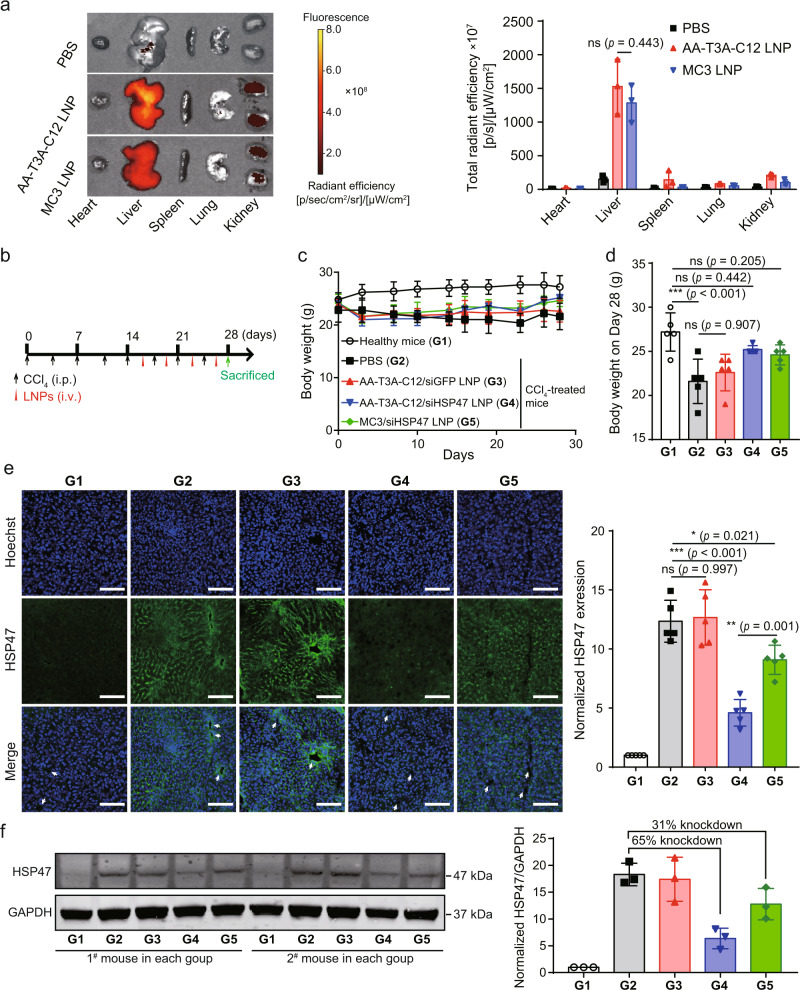
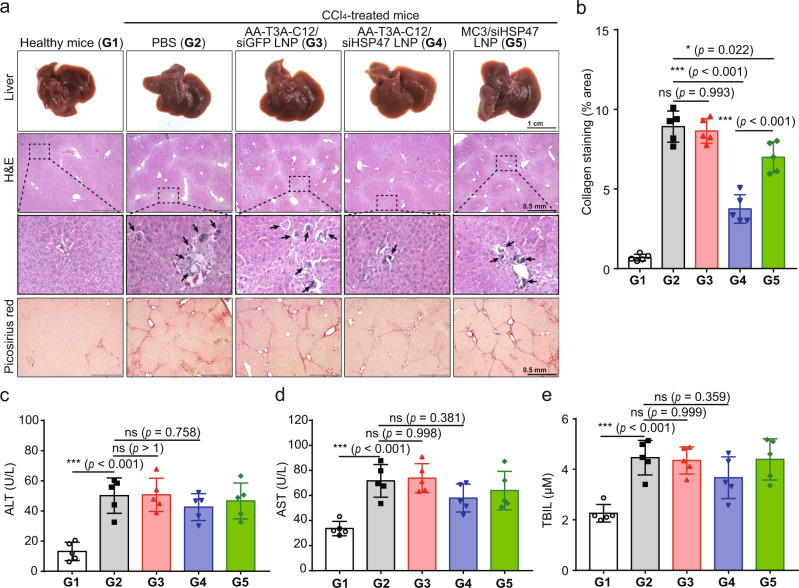
Lipid nanoparticle-mediated RNA delivery holds great potential to treat various liver diseases. However, targeted delivery of RNA therapeutics to activated liver-resident fibroblasts for liver fibrosis treatment remains challenging. Here, we develop a combinatorial library of anisamide ligand-tethered lipidoids (AA-lipidoids) using a one-pot, two-step modular synthetic method and adopt a two-round screening strategy to identify AA-lipidoids with both high potency and selectivity to deliver RNA payloads to activated fibroblasts. The lead AA-lipidoid AA-T3A-C12 mediates greater RNA delivery and transfection of activated fibroblasts than its analog without anisamide and the FDA-approved MC3 ionizable lipid. In a preclinical model of liver fibrosis, AA-T3A-C12 enables ~65% silencing of heat shock protein 47, a therapeutic target primarily expressed by activated fibroblasts, which is 2-fold more potent than MC3, leading to significantly reduced collagen deposition and liver fibrosis. These results demonstrate the potential of AA-lipidoids for targeted RNA delivery to activated fibroblasts. Furthermore, these synthetic methods and screening strategies open a new avenue to develop and discover potent lipidoids with targeting properties, which can potentially enable RNA delivery to a range of cell and tissue types that are challenging to access using traditional lipid nanoparticle formulations.


Conflict of interest statement

X.H. and M.J.M. are inventors on a patent filed by the Trustees of the University of Pennsylvania (U.S. Provisional Patent Application No. 63/286,760, filed December 7, 2021) describing the ligand-tethered lipid nanoparticle technology in this manuscript. All other authors declare they have no competing interests.

Figures

Fig. 1
Fig. 1. Preparation and application of ligand-tethered lipidoid nanoparticles for targeted siRNA delivery to HSCs to treat liver fibrosis.
a Formulation of AA-T3A-C12/siHSP47 LNP via microfluidic mixing. The ethanol lipid solution containing anisamide-tethered lipidoid (AA-T3A-C12), phospholipid (DSPC), PEG-lipid (C14-PEG), and cholesterol is rapidly mixed with an acidic aqueous solution containing HSP47 siRNA in a microfluidic device to formulate AA-T3A-C12/siHSP47 LNP. b Scheme of targeted AA-T3A-C12/siHSP47 LNP delivery to activated HSCs to knockdown HSP47 and treat liver fibrosis. HSCs are located in the space of Disse, an area between LSECs and hepatocytes. After rapidly shedding PEG in circulation, the LNP exposes multivalent anisamide ligands on its surface that can strongly bind with sigma receptors overexpressed on activated HSCs to mediate cellular uptake. b was created with BioRender.com.
Fig. 2
Fig. 2. Synthesis and screening of AA-lipidoids for targeted RNA delivery to activated fibroblasts.
a One-pot, two-step modular synthesis of AA-lipidoids. A representative synthesis of AA-T3A-C12 is shown. Anisoyl-NHS, polyamines, and epoxides were used to build a combinatorial library of 18 AA-lipidoids. b First-round screening of lipidoids and AA-lipidoids with high potency (n = 3/group). Lipidoids without anisamide were synthesized by the traditional ring-opening reactions between epoxides and polyamines. GFP siRNA-loaded LNPs were formulated to treat activated 3T3-GFP fibroblasts for 48 h to obtain their knockdown efficiency. The dashed line indicates 80% GFP knockdown. c Statistical analysis of structure–activity relationships. GFP knockdown efficiency was plotted based on lipidoids with or without anisamide. d Second round screening of lipidoids and AA-lipidoids with high dependency on sigma receptor-mediated transfection (n = 3/group). Activated 3T3-GFP fibroblasts were pre-treated with haloperidol (HP) to block sigma receptors before treatment with GFP siRNA-loaded LNPs. e Statistical analysis of the relationship between sigma receptor blocking and knockdown efficiency. GFP knockdown efficiency was plotted based on treatment with or without HP. Data are presented as mean ± SD. ns not significant; *p < 0.05, **p < 0.01. ce two-sided t-test. Source data are provided as a Source Data file.
Fig. 3
Fig. 3. Characterization of AA-T3A-C12 LNP and cellular uptake.
a A representative TEM image of AA-T3A-C12/siRNA LNP from three independent experiments. Scale bar, 100 nm. b Flow cytometry analysis of cellular uptake of Cy5-siRNA-loaded LNPs with or without haloperidol (HP) pretreatment (representative dataset from n = 3/group). c Flow cytometry analysis of competitive cellular uptake of Cy5-siRNA-loaded LNPs in a fibroblast/hepatocyte (3T3-GFP/H2.35) co-culture environment (representative dataset from n = 3/group). The mean fluorescence intensity ratio between fibroblast and hepatocyte (MFI3T3-GFP/MFIH2.35) was calculated to indicate preferential uptake by fibroblasts over hepatocytes. Data are presented as mean ± SD. **p < 0.01; ***p < 0.001. b and c one-way ANOVA with Tukey’s correction. Source data are provided as a Source Data file. c was created with BioRender.com.
Fig. 4
Fig. 4. AA-T3A-C12 LNP-mediated GFP and HSP47 knockdown in activated fibroblasts.
a GFP knockdown using AA-T3A-C12/siGFP LNP (n = 3/group). Activated 3T3-GFP fibroblasts were treated with AA-T3A-C12/siGFP LNP at the indicated dose for 24 or 48 h. b Flow cytometry analysis of GFP expression after AA-T3A-C12/siGFP LNP treatment for 48 h (representative dataset from n = 3/group). c Immunofluorescence (IF) staining of HSP47 in LNP-treated activated 3T3 fibroblasts. Scale bar: 20 μm. d and e Western blot analysis of HSP47 expression in LNP-treated activated 3T3 fibroblasts and primary HSCs (representative dataset from n = 3/group). GAPDH was used as an internal control. Quantitative analysis was performed using ImageJ software. Data are presented as mean ± SD (n = 3). **p < 0.01; ***p < 0.001. b, d, e one-way ANOVA with Tukey’s correction. Source data are provided as a Source Data file.
Fig. 5
Fig. 5. Biodistribution and HSP47 silencing activity of LNPs in fibrotic mice.
a Ex vivo fluorescence imaging and signal quantification of major organs from PBS, AA-T3A-C12 LNP/Cy5-siRNA or MC3 LNP/Cy5-siRNA treated fibrotic mice (representative dataset from n = 3/group). b Scheme of CCl4 and LNP treatment. Mice received intraperitoneal (i.p.) injections of 20% CCl4 (0.7 μl/g) in corn oil twice a week for 4 weeks. LNPs were intravenously (i.v.) administered at a siRNA dose of 5 μg/mouse twice weekly for 2 weeks. c Body weight changes of mice over time during the experiment (n = 5/group). d Body weight at the end of the experiment (n = 5/group). e IF staining of HSP47 in liver sections (representative dataset from n = 5/group). Arrows indicate central veins. Quantitative analysis was performed using ImageJ software (n = 5/group). Scale bar: 100 μm. f Western blot analysis of HSP47 expression in liver lysates (representative dataset from n = 3/group). GAPDH was used as an internal control. Representative images for two sets of mouse liver samples are shown. Quantitative analysis was performed using ImageJ software (n = 3/group). Data are presented as mean ± SD. G1, healthy mice; G2, PBS-treated fibrotic mice; G3, AA-T3A-C12/siGFP LNP-treated fibrotic mice; G4, AA-T3A-C12/siHSP47 LNP-treated fibrotic mice; G5, MC3/siHSP47 LNP-treated fibrotic mice. ns, not significant; *p < 0.05; **p < 0.01; ***p < 0.001. a, d, e one-way ANOVA with Tukey’s correction. Source data are provided as a Source Data file.
Fig. 6
Fig. 6. Macroscopic, histopathological, and biochemical analysis of liver fibrosis.
a Representative images of livers and liver sections stained with hematoxylin and eosin (H&E) or Picrosirius red (representative dataset from n = 5/group). Black arrows indicate apoptotic hepatocytes. b Morphometric quantification of Picrosirius red stained areas by ImageJ software (n = 5/group). c Quantification of serum alanine aminotransferase (ALT, n = 5/group). d Quantification of serum aspartate aminotransferase (AST, n = 5/group). e Quantification of serum total bilirubin (TBIL, n = 5/group). Data are presented as mean ± SD. ns not significant; *p < 0.05; ***p < 0.001. be one-way ANOVA with Tukey’s correction. Source data are provided as a Source Data file.

Similar articles

Cited by

References

    1. Schuppan D, Afdhal NH. Liver cirrhosis. Lancet. 2008;371:838–851. doi: 10.1016/S0140-6736(08)60383-9. - DOI - PMC - PubMed
    1. Lim YS, Kim WR. The global impact of hepatic fibrosis and end-stage liver disease. Clin. Liver Dis. 2008;12:733–746, vii. doi: 10.1016/j.cld.2008.07.007. - DOI - PubMed
    1. Friedman SL. Mechanisms of disease: mechanisms of hepatic fibrosis and therapeutic implications. Nat. Clin. Pract. Gastroenterol. Hepatol. 2004;1:98–105. doi: 10.1038/ncpgasthep0055. - DOI - PubMed
    1. Friedman SL. Evolving challenges in hepatic fibrosis. Nat. Rev. Gastroenterol. Hepatol. 2010;7:425–436. doi: 10.1038/nrgastro.2010.97. - DOI - PubMed
    1. Kisseleva T, Brenner D. Molecular and cellular mechanisms of liver fibrosis and its regression. Nat. Rev. Gastroenterol. Hepatol. 2021;18:151–166. doi: 10.1038/s41575-020-00372-7. - DOI - PubMed

Publication types