. 2023 Jan 17;14(1):280.
doi: 10.1038/s41467-023-35783-y.

Bottom-up evolution of perovskite clusters into high-activity rhodium nanoparticles toward alkaline hydrogen evolution

Affiliations

Bottom-up evolution of perovskite clusters into high-activity rhodium nanoparticles toward alkaline hydrogen evolution

Gaoxin Lin et al. Nat Commun. .

Abstract

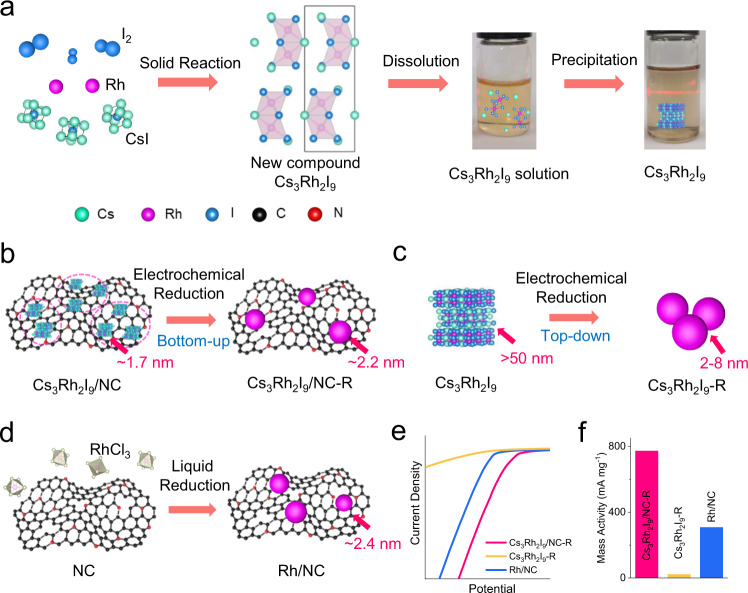
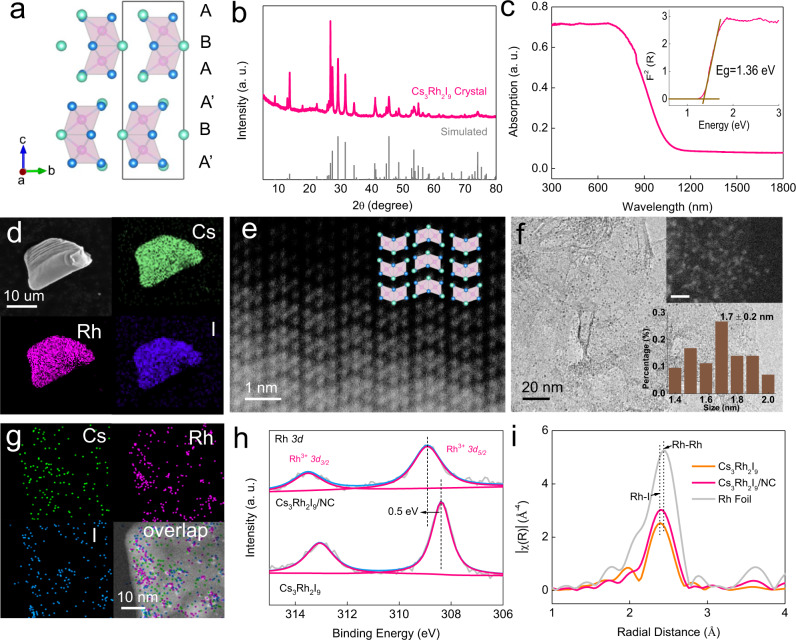
Self-reconstruction has been considered an efficient means to prepare efficient electrocatalysts in various energy transformation process for bond activation and breaking. However, developing nano-sized electrocatalysts through complete in-situ reconstruction with improved activity remains challenging. Herein, we report a bottom-up evolution route of electrochemically reducing Cs3Rh2I9 halide-perovskite clusters on N-doped carbon to prepare ultrafine Rh nanoparticles (~2.2 nm) with large lattice spacings and grain boundaries. Various in-situ and ex-situ characterizations including electrochemical quartz crystal microbalance experiments elucidate the Cs and I extraction and Rh reduction during the electrochemical reduction. These Rh nanoparticles from Cs3Rh2I9 clusters show significantly enhanced mass and area activity toward hydrogen evolution reaction in both alkaline and chlor-alkali electrolyte, superior to liquid-reduced Rh nanoparticles as well as bulk Cs3Rh2I9-derived Rh via top-down electro-reduction transformation. Theoretical calculations demonstrate water activation could be boosted on Cs3Rh2I9 clusters-derived Rh nanoparticles enriched with multiply sites, thus smoothing alkaline hydrogen evolution.


Conflict of interest statement

The authors declare no competing interests.

Figures

Fig. 1
Fig. 1. Schematic illustration of synthesizing perovskite Cs3Rh2I9 bulk crystals and clusters Cs3Rh2I9/NC, and their electrochemical reduction into metallic Rh particles toward alkaline HER.
a Synthesis of Cs3Rh2I9 bulk crystal via a solid reaction using I2, Rh, and CsI at 800 oC. The Cs3Rh2I9 crystal could demonstrate a dissolution-precipitation phenomenon in N, N-dimethylformamide (DMF). b Electrochemical reduction of Cs3Rh2I9 clusters (~1.7 nm) supported on NC (Cs3Rh2I9/NC) to form Cs3Rh2I9/NC-R with a little larger size (~2.2 nm) via a bottom-up evolution route. c Electrochemical reduction of bulk Cs3Rh2I9 to form Cs3Rh2I9-R with vert large particle size via a top-down route. d Liquid reduction of RhCl3 in aqueous to form Rh/NC with average particle size of 2.4 nm as the control catalyst. e HER polarization curves of Cs3Rh2I9/NC-R, Cs3Rh2I9-R, and Rh/NC coated on rotating glassy carbon electrode (GCE, 1600 rpm) in a chlorine-alkali electrolyte. f HER mass activity comparison in a chlorine-alkali electrolyte for Cs3Rh2I9/NC-R, Cs3Rh2I9-R, and Rh/NC electrocatalysts at an overpotential of 50 mV.
Fig. 2
Fig. 2. Structure characterization of bulk Cs3Rh2I9 and nanoclusters Cs3Rh2I9/NC.
a Atomic structure, and (b) powder XRD pattern and simulated pattern of Cs3Rh2I9 crystal. c Diffuse-reflectance UV–Vis spectrum of Cs3Rh2I9. The inset shows the corresponding Tauc plot. d SEM-EDX mapping images of Cs3Rh2I9 single crystal. e HAADF-STEM image of Cs3Rh2I9 crystal. f TEM image of Cs3Rh2I9 clusters supported on NC (Cs3Rh2I9/NC, Rh content: 5.8 wt.%). The insets show the corresponding HAADF image (scale bar: 5 nm, up) and particle size distribution (down). g TEM-EDX mapping of Cs3Rh2I9/NC. h XPS spectra of Rh 3d for Cs3Rh2I9 and Cs3Rh2I9/NC. i Fourier transform EXAFS of Rh K-edge in R-space for Cs3Rh2I9, Cs3Rh2I9/NC, and Rh foil.
Fig. 3
Fig. 3. Reconstruction of clusters Cs3Rh2I9/NC into Rh nanoparticles on NC.
a The CV curves from 1st to 100th cycle at 100 mV s−1 for Cs3Rh2I9/NC in 1.0 M KOH. b Mass change of the Cs3Rh2I9/NC electrode monitored by in situ EQCM experiment. c ICP-MS of the Cs and Rh contents in the electrolyte at different reduction time. d XPS spectra of Rh 3d for Cs3Rh2I9/NC at different reduction time. The results in (bd) were obtained at the potentiostatic measurement at −0.03 V vs. RHE.
Fig. 4
Fig. 4. Characterization of Cs3Rh2I9/NC-R prepared by electrochemical reduction of Cs3Rh2I9/NC.
a TEM image of Cs3Rh2I9/NC-R, showing uniform dispersion of Rh nanoparticles. The inset shows the corresponding HAADF image (scale bar: 5 nm, up) and particle size distribution (down). b The linear electron energy loss spectroscopy of Cs3Rh2I9/NC-R. c Fourier transform EXAFS of the Rh K-edge in R-space for Cs3Rh2I9/NC, Cs3Rh2I9/NC-R and Rh foil. d WT-EXAFS images of Rh for Cs3Rh2I9/NC, Cs3Rh2I9/NC-R and Rh foil. e HAADF-STEM image of Cs3Rh2I9/NC-R, showing a single Rh nanoparticle with larger lattice spacing and twin-GBs. f HRTEM image of Rh nanoparticles (Cs3Rh2I9-R) derived from the top-down electrochemical reduction of bulk Cs3Rh2I9 crystal. g DFT models of Rh with larger lattice spacing and GBs (up panel) and Rh with regular lattice spacing (down panel).
Fig. 5
Fig. 5. HER activity in 1.0 M KOH and chlor-alkali electrolyte.
a LSV curves of various electrocatalysts including commercial Pt/C (Pt content: 20 wt.%) coated on rotating glassy carbon electrode (GCE, 1600 rpm) in 1.0 M KOH. The catalyst loading amount on GCE is 0.764 mg cm−2. For Rh-based samples, the calculated Rh loading amounts on GCE are 0.045, 0.090 and 0.053 mg cm−2 for Cs3Rh2I9/NC-R, Cs3Rh2I9-R, and Rh/NC, respectively. b Comparison of overpotential at 10 mA cm−2 and Tafel slope for various Rh-based catalysts in 1.0 M KOH. c LSV curves of various electrocatalysts coated on rotating GCE (1600 rpm) in chlorine-alkali electrolyte. d Mass activity normalized to the mass of Rh in chlorine-alkali electrolyte. e Comparison of mass activity and area activity at the overpotential of 50 mV in chlorine-alkali electrolyte. All data show the mean and standard deviation through three repeated measurements. f Stability of Cs3Rh2I9/NC-R at 10 mA cm−2 in a chlorine-alkali electrolyte.

References

    1. Oener SZ, Foster MJ, Boettcher SW. Accelerating water dissociation in bipolar membranes and for electrocatalysis. Science. 2020;369:1099–1103. doi: 10.1126/science.aaz1487. - DOI - PubMed
    1. Zhu JQ, et al. Boundary activated hydrogen evolution reaction on monolayer MoS2. Nat. Commun. 2019;10:1348. doi: 10.1038/s41467-019-09269-9. - DOI - PMC - PubMed
    1. McCrum IT, Koper MTM. The role of adsorbed hydroxide in hydrogen evolution reaction kinetics on modified platinum. Nat. Energy. 2020;5:891–899. doi: 10.1038/s41560-020-00710-8. - DOI
    1. Hu C, Zhang L, Gong J. Recent progress made in the mechanism comprehension and design of electrocatalysts for alkaline water splitting. Energy Environ. Sci. 2019;12:2620–2645. doi: 10.1039/C9EE01202H. - DOI
    1. Peugeot A, et al. Benchmarking of oxygen evolution catalysts on porous nickel supports. Joule. 2021;5:1281–1300. doi: 10.1016/j.joule.2021.03.022. - DOI