. 2023 Jan 17;14(1):252.
doi: 10.1038/s41467-023-35880-y.

CRISPR screens reveal genetic determinants of PARP inhibitor sensitivity and resistance in prostate cancer

Affiliations

CRISPR screens reveal genetic determinants of PARP inhibitor sensitivity and resistance in prostate cancer

Takuya Tsujino et al. Nat Commun. .

Abstract

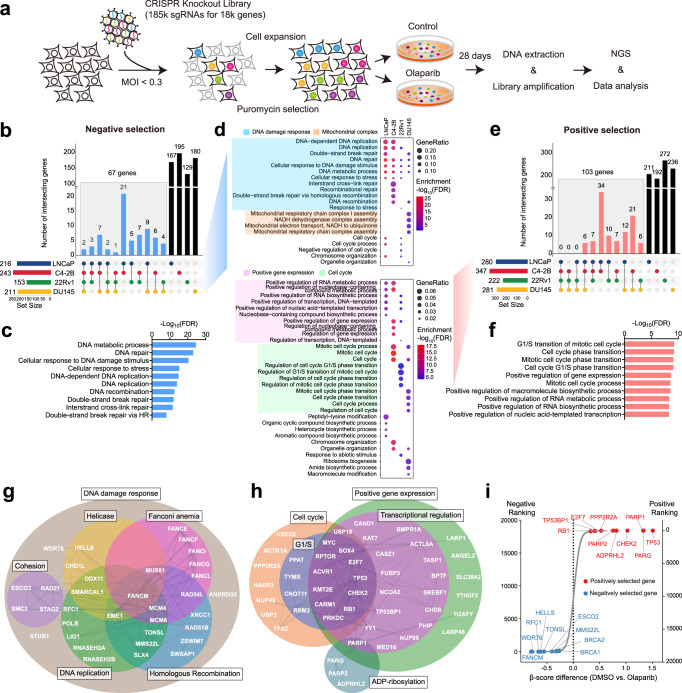
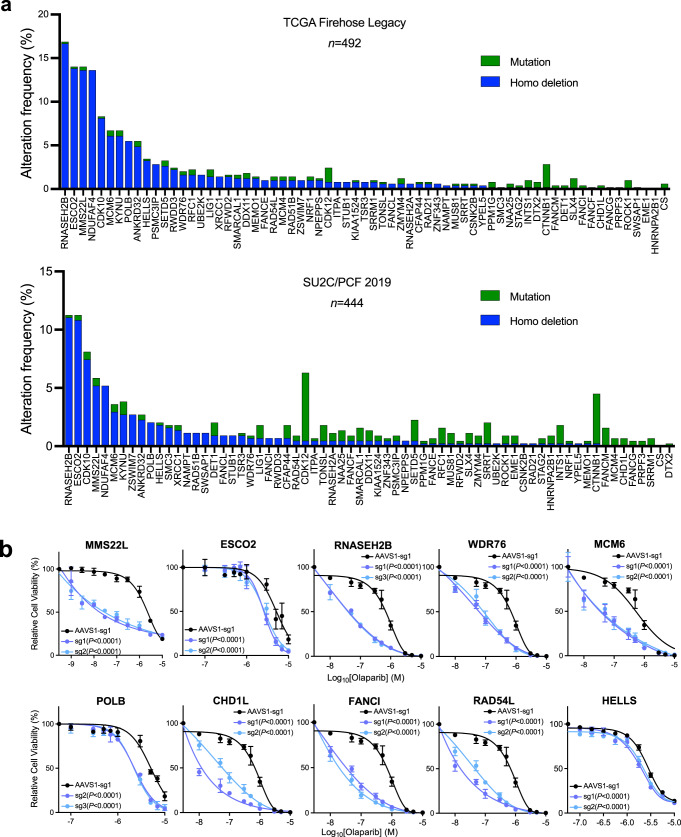
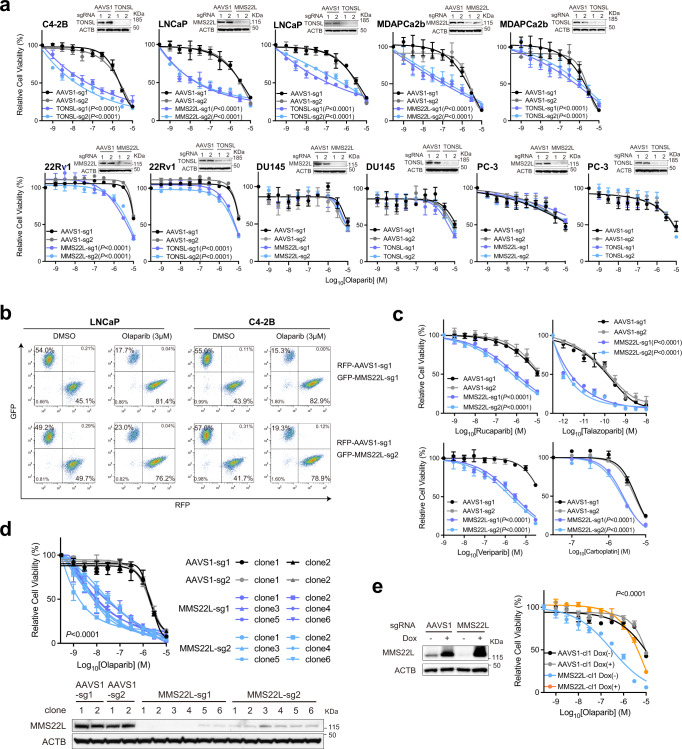
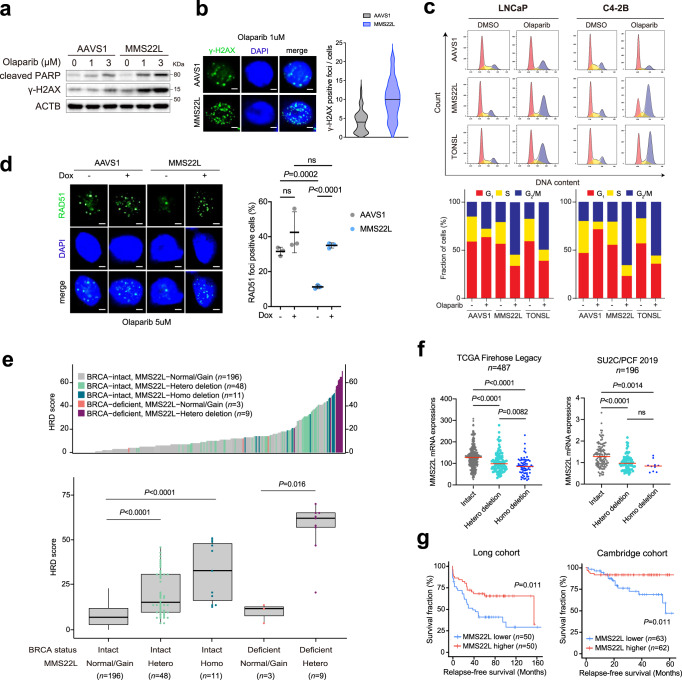
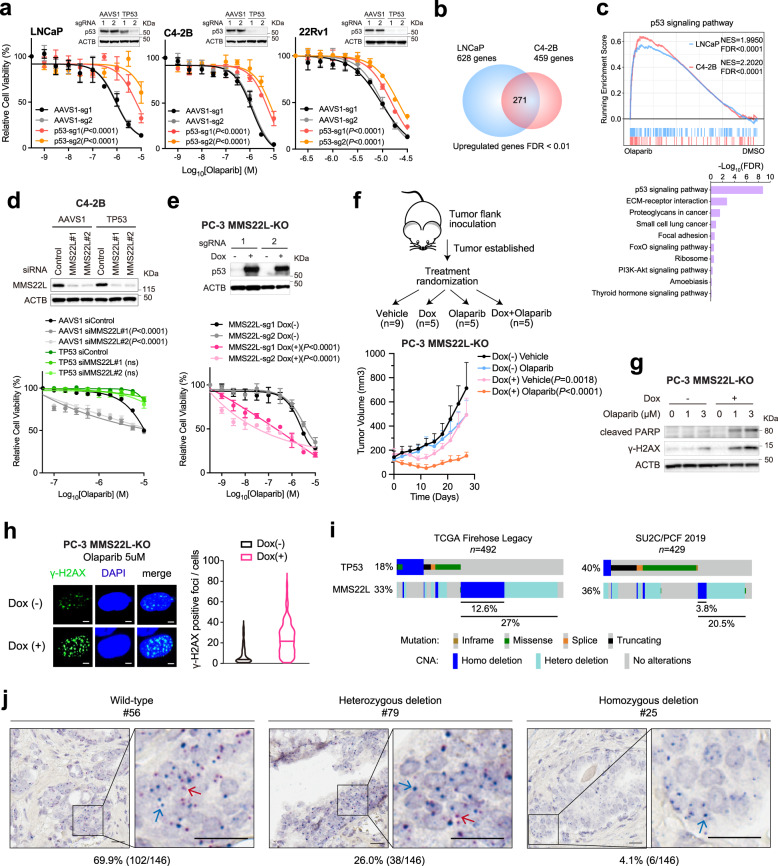
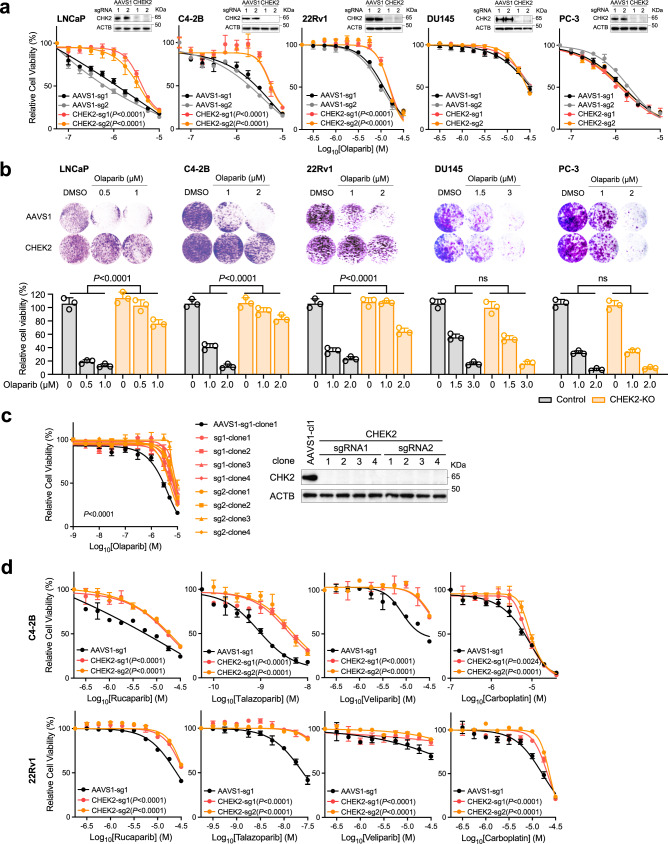
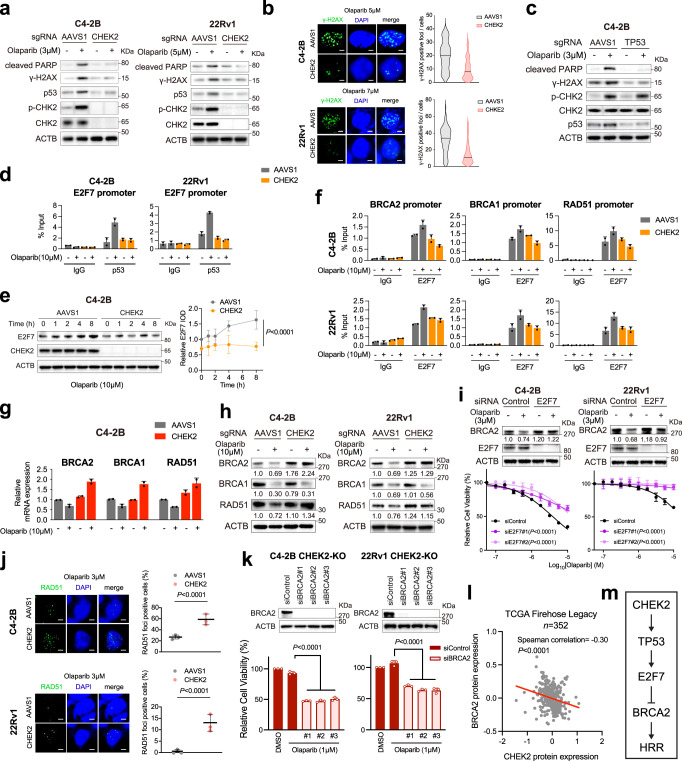
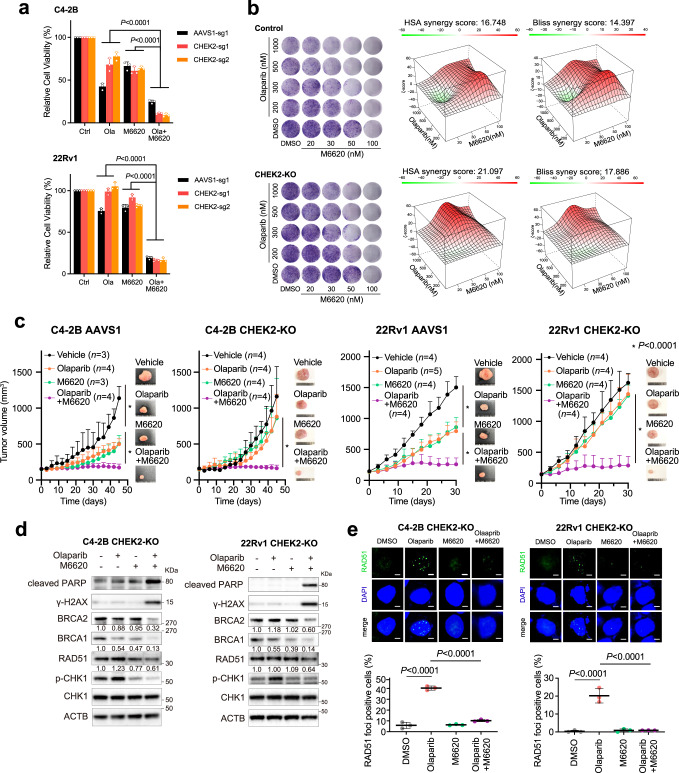
Prostate cancer harboring BRCA1/2 mutations are often exceptionally sensitive to PARP inhibitors. However, genomic alterations in other DNA damage response genes have not been consistently predictive of clinical response to PARP inhibition. Here, we perform genome-wide CRISPR-Cas9 knockout screens in BRCA1/2-proficient prostate cancer cells and identify previously unknown genes whose loss has a profound impact on PARP inhibitor response. Specifically, MMS22L deletion, frequently observed (up to 14%) in prostate cancer, renders cells hypersensitive to PARP inhibitors by disrupting RAD51 loading required for homologous recombination repair, although this response is TP53-dependent. Unexpectedly, loss of CHEK2 confers resistance rather than sensitivity to PARP inhibition through increased expression of BRCA2, a target of CHEK2-TP53-E2F7-mediated transcriptional repression. Combined PARP and ATR inhibition overcomes PARP inhibitor resistance caused by CHEK2 loss. Our findings may inform the use of PARP inhibitors beyond BRCA1/2-deficient tumors and support reevaluation of current biomarkers for PARP inhibition in prostate cancer.


Conflict of interest statement

The authors declare no competing interests.

Figures

Fig. 1
Fig. 1. CRISPR screens identify genes that modulate PARPi response in PCa cells.
a Schematic of genome-wide CRISPR/Cas9 screens. b UpSet plot of negatively selected genes in four PCa cell lines as indicated. Blue bars indicate the number of common hits in at least two screens. c Top GO terms enriched in 67 common hits from negative selection. d Top GO terms enriched in negatively (upper panel) and positively (lower panel) selected genes in each individual cell line. e UpSet plot of positively selected genes in four PCa cell lines as indicated. Red bars indicate the number of common hits in at least two screens. f Top GO terms enriched in 103 common hits from positive selection. g The networks of common hits from negative selection grouped according to their roles in specific pathways and their genetic and physical interactions (gray lines) based on STRING analysis. h The networks of common hits from positive selection, grouped as in (g). i Top-ranked genes from CRISPR screens determined by comparing olaparib to DMSO treatment. Genes are ranked by the average of differential β-scores from all four cell lines. Negatively and positively selected genes are marked in blue and red, respectively.
Fig. 2
Fig. 2. Validation of negatively selected genes with frequent genomic alterations.
a The frequency of mutations and homozygous (Homo) deletions in 67 common negatively selected genes from the TCGA Firehose Legacy cohort (Upper panel, n = 492) and the SU2C/PCF cohort (Lower panel, n = 444),. b Dose-response curves after treatment with olaparib for C4-2B cells with gene knockout (KO) as indicated. Data are presented as mean ± SD (n = 3 biologically independent experiments). The p-values were determined by comparing two gene-specific sgRNAs to a control AAVS1 sgRNA using two-way ANOVA. Source data are provided as a Source Data file.
Fig. 3
Fig. 3. Loss of MMS22L increases PARPi response in PCa cells.
a Dose-response curves after treatment with olaparib for MMS22L- or TONSL-KO cells versus corresponding AAVS1 control cells of C4-2B, LNCaP, MDAPCa2b, 22Rv1, DU145 and PC-3. Upper right panels are immunoblot analysis of MMS22L or TONSL KO efficiency. ACTB (β-actin) is a loading control. The olaparib response of MMS22L-KO C4-2B cells is presented in (2b). b Flow cytometry analysis of GFP and RFP positive cells. MMS22L-KO LNCaP or C4-2B cells (with GFP) were co-cultured with corresponding AAVS1 control cells (with RFP) in a 1:1 ratio in the presence of DMSO or olaparib. Two MMS22L-KO cell lines (sg1 and sg2) and one control cell line (sg1) were used. Cells were collected and analyzed using flow cytometry 7 days after the treatment. The percentage of each cell population is presented in each panel. The experiment was repeated independently twice with similar results. c Dose-response curves after treatment with rucaparib, talazoparib, veliparib, and carboplatin for two MMS22L-KO C4-2B cell lines (sg1 and sg2) versus two AAVS1 control cell lines (sg1 and sg2). d Dose-response curves (upper panel) after treatment with olaparib for AAVS1 control and MMS22L-KO C4-2B cell clones. Immunoblot analysis (lower panel) showing the MMS22L protein level in AAVS1 control and MMS22L-KO cell clones. e Immunoblot analysis (left panel) showing the MMS22L protein level in C4-2B AAVS1 control sg1 clone 1 (cl1) and MMS22L-KO sg1 clone 1 (cl1), stably infected with TET-inducible sgRNA-resistant MMS22L gene, after treatment with or without doxycycline (0.15 μg/ml) for 3 days. Dose-response curves (right panel) after olaparib treatment with or without doxycycline (0.15 μg/ml) treatment for the same C4-2B cell clones. In a and ce data are presented as mean ± SD (n = 3 biologically independent experiments). The immunoblot analyses were repeated independently twice with similar results. The p-values were determined by two-way ANOVA. Source data are provided as a Source Data file.
Fig. 4
Fig. 4. Loss of MMS22L impairs HRR function in PCa cells.
a Immunoblot analysis of cleaved PARP and γ-H2AX in AAVS1 control and MMS22L-KO C4-2B cells after olaparib treatment for 72 h. The experiment was repeated independently three times with similar results. b Representative images of two biologically independent experiments and quantification of γ-H2AX foci in AAVS1 control and MMS22L-KO C4-2B cells after olaparib treatment for 24 h. More than 100 cells were analyzed per condition. Solid lines inside the violin indicate the median. Scale bar = 5 μm. c Cell cycle analysis (upper panel) of AAVS1 control, MMS22L-KO and TONSL-KO LNCaP, and C4-2B cells after treatment with DMSO or olaparib for 72 h. The percentage of cells (lower panel) in each phase of the cell cycle is shown. The experiment was repeated independently twice with similar results. d Representative images and quantification of RAD51 foci in AAVS1 control and MMS22L-KO C4-2B cells stably infected with TET-inducible MMS22L gene after olaparib treatment in the presence or absence of doxycycline (0.15 μg/ml) for 24 h. Dots indicate each replicate with more than 100 cells analyzed. Data are presented as mean ± SD of three biologically independent replicates. Scale bar = 5 μm. e Ranked HRD scores (Upper panel) in PCa tumors with BRCA and/or MMS22L genomic alterations as indicated. Comparison of HRD scores (lower panel) between five patient groups classified based on BRCA and MMS22L status (n = 196, 48, 11, 3, and 9 tumor samples in each group, respectively). Data are presented as boxplot indicating median, 25th-75th percentile (box), and minimum and maximum values (whiskers). f The mRNA level of MMS22L in PCa tumors with Intact MMS22L, heterozygous (Hetero) deletion, and homozygous (Homo) deletion of MMS22L in the TCGA cohort and the SU2C/PCF cohort (n = 487 and 196 tumor samples, respectively),. g Kaplan–Meier survival curves in the Long PCa cohort (n = 50 versus 50 tumor samples) and the Cambridge PCa cohort (n = 63 versus 62 tumor samples) based on the MMS22L mRNA expression level (lower versus higher). A log-rank test was carried out to examine the survival difference. In (b) and (df) the p-values were determined using two-sided t-test. ns = not significant. Source data are provided as a Source Data file.
Fig. 5
Fig. 5. TP53 status impacts PARPi response in MMS22L-depleted PCa cells.
a Dose-response curves after treatment with olaparib for the indicated cells after TP53 deletion. Immunoblot analyses of p53 in TP53-KO versus control cells are shown. b Venn diagram of up-regulated genes in LNCaP and C4-2B cells after olaparib treatment. c GSEA (upper panel) and top enriched KEGG pathways (lower panel) of up-regulated genes. Normalized enrichment score (NES) and false discover rate (FDR) are indicated. d Immunoblot analysis (upper panel) of MMS22L in AAVS1 control and TP53-KO C4-2B cells after siRNA knockdown. Dose-response curves (lower panel) after olaparib treatment for the same cells with or without MMS22L siRNA transfection. e Immunoblot analysis (upper panel) of p53 in AAVS1 control and MMS22L-KO PC-3 cells containing TET-inducible TP53 gene in the presence or absence of doxycycline (0.15 μg/ml) for 3 days. Dose-response curves (lower panel) after olaparib treatment in the presence or absence of doxycycline. f Schematic diagram of the experimental procedure (upper panel). Tumor growth (lower panel) after treatment with olaparib (50 mg/kg) or vehicle with or without doxycycline induction (n = 9, 5, 5, and 5 mice in each group, respectively). Data are presented as mean ± SD. The p-values were determined by comparing between treatment with and without doxycycline using two-way ANOVA. g Immunoblot analysis of cleaved PARP and γ-H2AX in cells after the treatment as described in (e). The experiment was repeated independently three times with similar results. h Representative images of two biologically independent experiments and quantification of γ-H2AX foci after olaparib treatment for 24 h in the presence or absence of doxycycline (0.15 μg/ml). More than 100 cells were analyzed per condition. Solid lines inside the violin indicate the median. Scale bar = 5 μm. i The frequency of TP53 and MMS22L alterations in the TCGA and the SU2C/PCF cohorts,. j Representative images of MMS22L wild-type, heterozygous and homozygous deletion determined by DNAscope assay using a tissue microarray (n = 146 tissue cores). Red signals (red arrow) indicate probes targeting the MMS22L gene on chromosome 6q. Blue signals (blue arrow) indicate control probes targeting the centromeric region. Scale bar = 20 μm. In (a) and (de), data are presented as mean ± SD (n = 3 biologically independent experiments). The immunoblot analyses were repeated independently twice with similar results. The p-values were determined using two-way ANOVA. Source data are provided as a Source Data file.
Fig. 6
Fig. 6. Loss of CHEK2 renders PCa cells resistant to PARP inhibition.
a Dose-response curves after treatment with olaparib for two AAVS1 control (sg1 and sg2) and two CHEK2-KO (sg1 and sg2) LNCaP, C4-2B, 22Rv1, DU145, and PC-3 cell lines. The upper right panel in each cell line is the immunoblot analysis showing the CHK2 protein level in CHEK2-KO versus control cells. b Representative colony growth images (upper panel) and quantification (lower panel) after treatment with olaparib in AAVS1 control and CHEK2-KO PCa cell lines as indicated. Data are presented as mean ± SD of three biologically independent replicates. The p-values were determined using one-way ANOVA. c Dose-response curves (left panel) after treatment with olaparib for AAVS1 control and CHEK2-KO C4-2B cell clones. Immunoblot analysis (right panel) showing the CHK2 protein level in CHEK2-KO and control cell clones. d Dose-response curves after treatment with rucaparib, talazoparib, veliparib, and carboplatin for AAVS1 control and CHEK2-KO C4-2B and 22Rv1 cells. In a, c, and d data are presented as mean ± SD (n = 3 biologically independent experiments). The immunoblot analyses were repeated independently twice with similar results. The p-values were determined by comparing CHEK2-KO to AAVS1 control cells using two-way ANOVA. Source data are provided as a Source Data file.
Fig. 7
Fig. 7. Loss of CHEK2/TP53 enhances HRR function through E2F7-controlled BRCA2 expression.
a Immunoblot analysis of the indicated proteins in AAVS1 control and CHEK2-KO C4-2B and 22Rv1 cells after treatment with and without olaparib for 72 h. The experiment was repeated independently three times with similar results. b Representative images of two biologically independent experiments and quantification of γ-H2AX foci in cells as described in (a) after treatment with olaparib for 24 h. More than 100 cells were analyzed per condition. Solid lines inside the violin indicate the median. The p-values were determined using two-sided t-test. Scale bar = 5 μm. c Immunoblot analysis of the indicated proteins in AAVS1 control and TP53-KO C4-2B cells after treatment with and without olaparib for 72 h. d p53 ChIP-qPCR at the E2F7 promoter in AAVS1 control and CHEK2-KO C4-2B and 22Rv1 cells after treatment with or without olaparib for 24 h. e Immunoblot analysis (left panel) of E2F7 in AAVS1 control and CHEK2-KO C4-2B cells after treatment with olaparib for the indicated time. The expression of E2F7 is defined by ACTB normalized integrated optical density (IOD) (right panel). Data are presented as mean ± SD of three biologically independent experiments. f E2F7 ChIP-qPCR at the promoter regions of BRCA1/2 and RAD51 genes in cells as described in (d). g The mRNA expression of BRCA1/2 and RAD51 genes determined by RT-qPCR in cells as described in (d) after treatment with and without olaparib for 8 h. h Immunoblot analysis of the indicated proteins in cells as described in (d) after treatment with and without olaparib for 72 h. Normalized IOD values are indicated. i Immunoblot analysis (upper panel) of BRCA2 in C4-2B and 22Rv1 cells after E2F7 siRNA knockdown with or without olaparib treatment for 72 h. Dose-response curves (lower panel) after treatment with olaparib for C4-2B and 22Rv1 cells transfected with siRNAs against E2F7 or control. Data are presented as mean ± SD (n = 3 biologically independent experiments). j Representative images and quantification of RAD51 foci in AAVS1 control and CHEK2-KO C4-2B and 22Rv1 cells after treatment with olaparib for 24 h. Data are presented as mean ± SD of three biologically independent replicates with more than 100 cells analyzed each replicate. Scale bar = 5 μm. k Cell viability after treatment with olaparib for CHEK2-KO C4-2B and 22Rv1 cells transfected with siRNAs against BRCA2 or control. Data are presented as mean ± SD (n = 3 biologically independent experiments). Immunoblot analysis of BRCA2 after siRNA knockdown (upper panel) is shown. l Scatter plot showing the correlation between CHK2 and BRCA2 protein levels in the TCGA cohort. Spearman correlation coefficient and p-value are indicated. m Schematic model of HRR function regulated by the CHEK2-TP53-E2F7-BRCA2 pathway. In a, c, h, and i, the immunoblot analyses were repeated independently three times with similar results. In d, f, and g, data are presented as mean ± SD of two biologically independent experiments. In e and i, the p-values were determined using two-way ANOVA. In j and k, the p-values were determined using two-sided t-test. Source data are provided as a Source Data file.
Fig. 8
Fig. 8. ATR inhibition overcomes PARPi resistance caused by CHEK2 loss in PCa cells.
a Cell viability of AAVS1 control and CHEK2-KO C4-2B and 22Rv1 cells after treatment with DMSO, olaparib (3 μM), M6620 (100 nM) or combination of olaparib and M6620. Data are presented as mean ± SD (n = 3 biologically independent experiments). The p-values were determined using one-way ANOVA. b Representative colony growth images (left panel) of AAVS1 control and CHEK2-KO C4-2B cells after combination treatment of olaparib and M6620 as indicated. 3D synergy maps (right panel) of HSA and Bliss scores between olaparib and M6620 are shown. The experiments were repeated independently twice with similar results. c Xenograft mouse models using AAVS1 control and CHEK2-KO C4-2B and 22Rv1 cells. After tumors developed to a volume of around 150 mm3, mice were randomized into 4 treatment groups as vehicle, olaparib (50 mg/kg), M6620 (25 mg/kg), and olaparib plus M6620. The single agent was administered 5 days/week, while the combination treatment was given 5 days/week for olaparib plus 4 days/week for M6620. Tumor growth is shown with representative images. Data are presented as mean ± SD (n = 3, 4, 3, 4 in each group for C4-2B AAVS1; n = 4, 5, 4, 4 in each group for 22Rv1 AAVS1; n = 4, 4, 4, 4 in each group for C4-2B CHEK2-KO; n = 4, 4, 4, 4 in each group for 22Rv1 CHEK2-KO). The p-values were determined using two-way ANOVA. Tumor growth of each individual mouse is presented in Supplementary Fig. 19. d Immunoblot analysis of the indicated proteins in CHEK2-KO C4-2B and 22Rv1 cells after treatment with DMSO, olaparib (3 μM) and/or M6620 (100 nM) for 72 h. The normalized IOD values of the indicated proteins are shown. The experiments were repeated independently three times with similar results. e Representative images (upper panel) and quantification (lower panel) of RAD51 foci in CHEK2-KO C4-2B and 22Rv1 cells after treatment with DMSO, olaparib (10 μM) and/or M6620 (200 nM) for 24 h. Dots indicate each replicate with more than 100 cells analyzed. Data are presented as mean ± SD of three biologically independent experiments. The p-values were determined using two-sided t-test. Scale bar = 5 μm. Source data are provided as a Source Data file.

Comment in

References

    1. Robinson D, et al. Integrative clinical genomics of advanced prostate cancer. Cell. 2015;162:454. doi: 10.1016/j.cell.2015.06.053. - DOI - PubMed
    1. Armenia J, et al. The long tail of oncogenic drivers in prostate cancer. Nat. Genet. 2018;50:645–651. doi: 10.1038/s41588-018-0078-z. - DOI - PMC - PubMed
    1. Murai J, et al. Trapping of PARP1 and PARP2 by Clinical PARP Inhibitors. Cancer Res. 2012;72:5588–5599. doi: 10.1158/0008-5472.CAN-12-2753. - DOI - PMC - PubMed
    1. Farmer H, et al. Targeting the DNA repair defect in BRCA mutant cells as a therapeutic strategy. Nature. 2005;434:917–921. doi: 10.1038/nature03445. - DOI - PubMed
    1. Bryant HE, et al. Specific killing of BRCA2-deficient tumours with inhibitors of poly(ADP-ribose) polymerase. Nature. 2005;434:913–917. doi: 10.1038/nature03443. - DOI - PubMed

Publication types

MeSH terms

Substances

LinkOut - more resources