. 2023 Jan 17;13(1):909.
doi: 10.1038/s41598-023-28092-3.

Myosin light chain phosphorylation exhibits a gradient across the wall of cerebellar arteries under sustained ex vivo vascular tone

Affiliations

Myosin light chain phosphorylation exhibits a gradient across the wall of cerebellar arteries under sustained ex vivo vascular tone

Zhe Sun et al. Sci Rep. .

Abstract

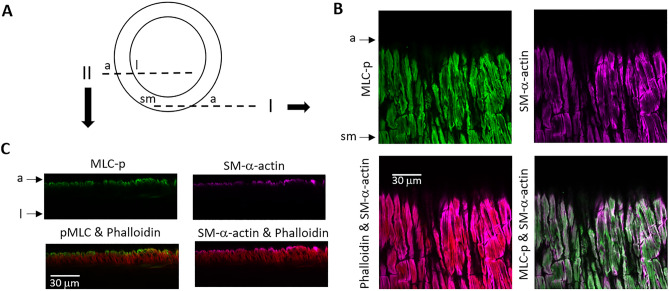
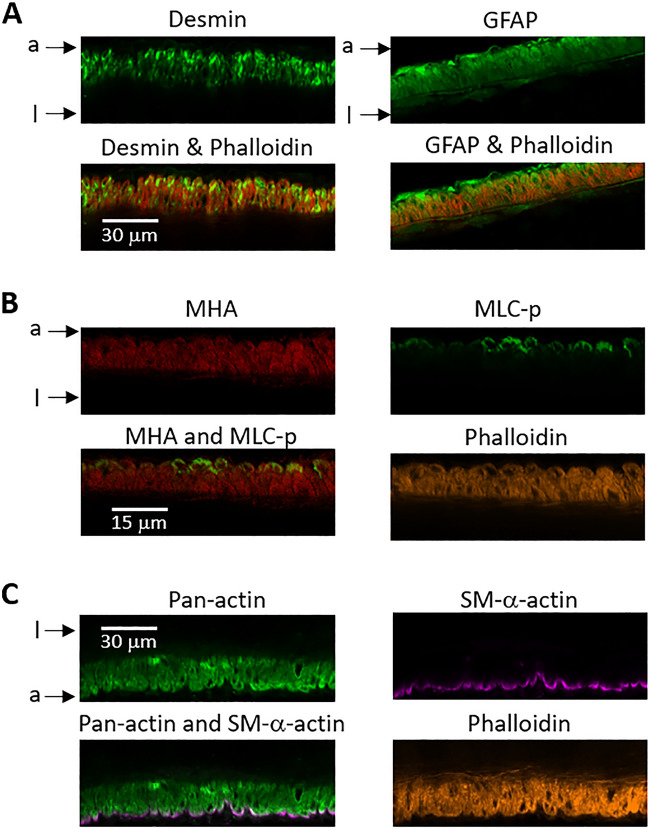
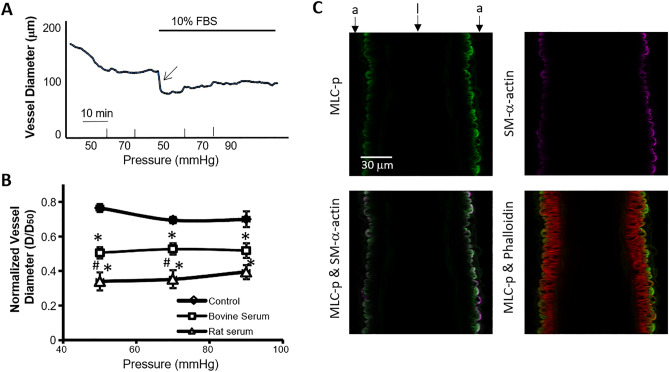
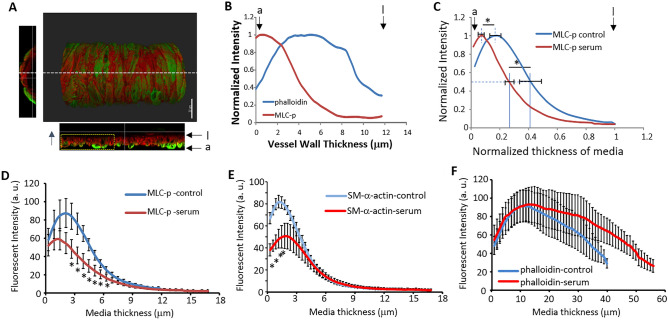
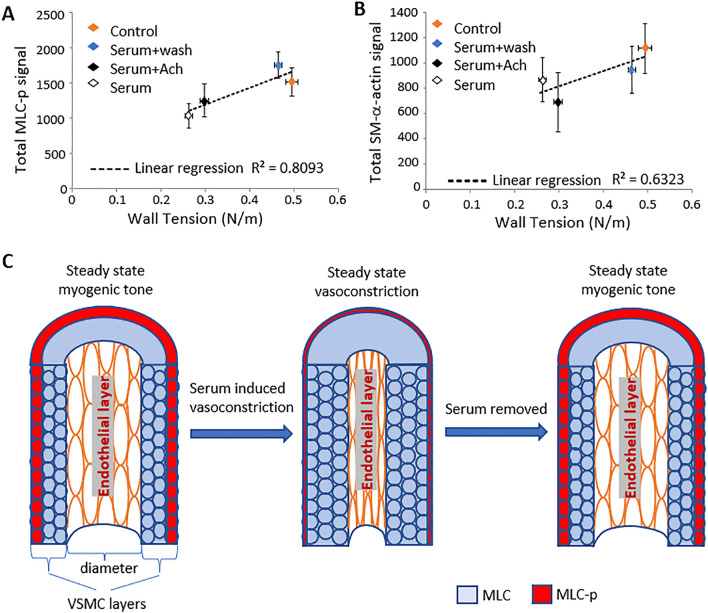
Small blood vessel diseases are often associated with impaired regulation of vascular tone. The current understanding of resistance arteries often focuses on how a level of vascular tone is achieved in the acute phase, while less emphasis is placed on mechanisms that maintain vascular tone. In this study, cannulated rat superior cerebellar arteries (SCA) developed spontaneous myogenic tone and showed a marked and sustained constriction in the presence of diluted serum (10%), a stimulus relevant to cerebrovascular disease. Both phosphorylated myosin light chain (MLC-p) and smooth muscle alpha actin (SM-α-actin) aligned with phalloidin-stained actin filaments in the vessel wall, while exhibiting a 'high to low' gradient across the layers of vascular smooth muscle cells (VSMC), peaking in the outer layer. The MLC-p distribution profile shifted towards the adventitia in serum treated vessels, while removal of the serum reversed it. Furthermore, a positive correlation between the MLC-p signal and vessel wall tension was also evident. The gradients of phosphorylated MLC and SM-α-actin are consistent with a spatial regulation of the myosin-actin apparatus in the vessel wall during the maintenance of vascular tone. Further, the changing profiles of MLC-p and SM-α-actin are consistent with SCA vasoconstriction being accompanied by VSMC cytoskeletal reorganization.


Conflict of interest statement

The author(s) declare no competing interests, including both financial and non-financial interests.

Figures

Figure 1
Figure 1
Gradient distribution of MLC-p and SM-α-actin in the vessel wall of SCA. (A) Illustration of the longitudinal circumferential view (I) and the longitudinal sectional view (II) of the vessel wall. (B) Longitudinal circumferential view showed good correlation among MLC-p, SM-α-actin and phalloidin-labeled actin fiber in SCA that was fixed while maintaining a stable myogenic tone. The vessel was labeled for phosphorylated myosin light chain (MLC-p, green), SM-α-actin (purple) and phalloidin (red). Phalloidin staining was used to identify the smooth muscle layer. Arrows: a: depicts adventitia side of vessel wall; sm: smooth muscle. (C) The gradient distribution of MLC-p and SM-α-actin in the vessel wall is evident in the longitudinal sectional view of the SCA, i.e. strong signal in the outer layer, but less intense signal in the inner layer, with phalloidin-labeled actin filaments distributed across the thickness of the vessel wall. a: depicts adventitia side of vessel wall; l: depicts intra-luminal side of vessel wall.
Figure 2
Figure 2
The pattern of MLC-p and SMA-α-actin staining is not due to limited antibody diffusion across the vessel wall. (A) Immuno-staining of desmin (green) and GFAP (green) in the vessel wall of rat SCA. Vessel was fixed while maintaining a stable myogenic tone at 70 mmHg. (B) Triple staining of myosin heavy chain type A (MHA, red), MLC-p (green) and phalloidin (yellow) in the vessel wall of SCA. (C) Triple-staining of pan-actin (green), SM-α-actin (purple) and phalloidin (yellow) in the vessel wall of SCA. a: depicts adventitia side of vessel wall; l: depicts intra-luminal side of vessel wall.
Figure 3
Figure 3
Serum (10%) induced vasoconstriction of SCA. (A) A typical recording of SCA diameter at indicated intraluminal pressures before (control) and after exposure to 10% serum. Arrow depicts the robust vessel constriction after serum treatment. Bar shows time scale. (B) Effect of exposure to 10% serum on SCA myogenic tone. D: vessel diameter 10 min after pressure elevation; D50: passive vessel diameter at 50 mmHg. *p < 0.05 compared to control. Control: n = 6; bovine serum: n = 4; rat serum: n = 6. #p < 0.05 compared to Bovine serum. (C) Representative longitudinal sectional view of SCA maintaining a steady state vasoconstriction after exposure to 10% rat serum. The gradient distribution of MLC-p (green) and SM-α-actin (purple) in the vessel wall is evident in the wall of serum treated SCA, as compared to the phalloidin staining (red). a: depicts adventitia side of vessel wall; l: depicts intra-luminal side of vessel wall.
Figure 4
Figure 4
Comparison of the staining patterns for MLC-p, SM-α-actin and phalloidin between control and serum constricted SCA. (A) 3D longitudinal view of an immuno-labeled SCA vessel, green-MLC-p, red-phalloidin. White dashed line depicts the plane where a longitudinal orthogonal section was taken, the normal view of the longitudinal section is shown in the bottom image. The section of vessel outlined by the yellow box was used to analyze the intensity profile of MLC-p and phalloidin-labeling across the vessel wall in the direction depicted by the blue arrow , Scale bar = 30 μm. (B) The graph depicts the normalized intensity profile of MLC-p and phalloidin of the vessel orthogonal section shown in (A), a: depicts adventitia side of vessel wall; l: depicts intra-luminal side of vessel wall. (C) At 70 mmHg, the vasoconstriction induced by 10% rat serum is accompanied by a shift of the MLC-p profile to the left (e.g. towards the adventitial edge) of the smooth muscle layer. Dashed line indicates the level of half-maximum intensity; the mean ± SEM of N vessels is indicated by the horizontal bar for each curve. a: depicts adventitia side of vessel wall; l: depicts intra-luminal side of vessel wall. (D) Comparison of fluorescence intensity of MLC-p in the smooth muscle layer. Data are presented as Mean ± SEM. (E) Comparison of fluorescence intensity of SM-α-actin in the smooth muscle layer of control and serum treated SCA. Mean ± SEM. (F) Comparison of fluorescence intensity of phalloidin labeled actin filaments in the smooth muscle layer of control and serum treated SCA. Mean ± SEM. *p < 0.05, n = 6 for control and serum treated arteries respectively. a.u.: arbitrary unit.
Figure 5
Figure 5
Comparison of total regulatory MLC and MLC-p labeling in control and serum constricted SCA. (A) Typical confocal fluorescence images of control and serum-treated rat SCAs immunolabeled for MLC-p, total regulatory MLC, and phalloidin-labeled actin filaments. (B) Comparison of total regulatory MLC fluorescent intensity in the vessel wall of control and serum treated rat SCAs. Mean ± SEM. (C) Comparison of MLC-p/total MLC ratio in the smooth muscle layer of control and serum treated SCAs. Mean ± SEM. *p < 0.05 between control and serum treated vessels. N = 6 vessels for control and serum treated groups respectively.
Figure 6
Figure 6
Reversal of serum induced SCA vasoconstriction. (A) Serum induced vasoconstriction of SCA was modestly inhibited by Ach (10^-7 M), but was largely reversed following washout of the added serum. D: vessel diameter 10 min after pressure elevation or after treatment; D50: passive vessel diameter at 50 mmHg. Data are presented as Mean ± SEM. *: p < 0.05 compared to vessel diameter at 70 mmHg + 10% serum, **p < 0.05 compared to 70 mmHg intraluminal pressure alone; n = 7 vessels for Ach treated group, and n = 5 for serum + wash group. (B) Normalized transmural distribution profile of MLC-p in contracted SCAs at 70 mmHg pressure under basal conditions, in the presence of 10% serum, serum + 0.1 μM ACh or following serum washout. The MLC-p profile shifted back to the distribution observed under control conditions after serum washout; while treatment with Ach induced no significant shift of MLC-p profile compared with treatment by serum alone. Data are presented as Mean ± SEM. *p < 0.05 compared to control; **p < 0.05 compared to serum washout. (C) The absolute intensity of MLC-p fluorescence across the arterial wall decreased in the presence of either 10% serum alone or serum + 0.1 μM ACh, and recovered to control levels following treatment washout. Data are displayed as Mean ± SEM. n = 6 vessels for control and serum-treated group respectively; n = 7 for serum + Ach and n = 4 for serum washout group. #p < 0.05, serum + Ach vs. control group; *p < 0.05, serum vs. control group; $p < 0.05, serum vs. serum washout group. (D) Normalized transmural distribution of SM-α-actin in SCAs at 70 mmHg pressure under basal conditions, and in the presence of 10% serum alone or serum + 0.1 μM ACh. Addition of Ach led to a further shift of the SM-α-actin profile to the left compared with serum constricted vessels. Serum washout reversed these observed shifts in SM-α-actin distribution to the control profile. *p < 0.05, serum + Ach vs. control; **p < 0.05 serum + Ach vs. serum washout. (E) The addition of either 10% serum alone or serum + 0.1 μM ACh decreased the intensity profile of SM-α-actin fluorescence across the arterial wall, which remained altered following treatment washout. Data are displayed as Mean ± SEM. *p < 0.05, serum vs. control group; #p < 0.05, serum + Ach vs. control group. n = 5 vessels for control, serum, serum washout and serum + Ach group respectively.
Figure 7
Figure 7
Pretreatment with ML-7 inhibited serum induced SCA vasoconstriction. (A) Serum induced vasoconstriction of SCA was abolished by ML-7 (15 μM) treatment. D50: passive vessel diameter at 50 mmHg, D: vessel diameter 10 min after pressure elevation or after treatment. *p < 0.05 compared to vessel diameter at 70 mmHg + 10% serum, n = 7 vessels for each group. (B) Comparison of MLC-p and SM-α-actin distribution in SCA dilated in the presence of ML-7 + serum vs. SCA constricted by serum. (C) The fluorescence intensity of MLC-p across the vessel wall of SCAs in the presence of ML-7 + serum vs. that of SCAs constricted by 10% serum. *p < 0.05 compared to serum treated SCA, n = 5 vessels for each group respectively. (D). The fluorescence intensity of SM-α-actin across the vessel wall of SCAs in the presence of ML-7 + serum vs. SCAs constricted with serum. Data are displayed as Mean ± SEM. *p < 0.05 compared to serum treated SCA, n = 5 vessels for each group respectively.
Figure 8
Figure 8
Correlation of wall tension vs. total MLC-p and total SM-α-actin among the four treatment groups of SCAs. Wall tension was calculated following LaPlace’s law, T = p*r, where T is wall tension, intraluminal pressure (p) is 70 mmHg, and r is the vessel radius measured before fixation. (A) Plot of wall tension vs. total MLC-p fluorescence intensity. (B) Plot of wall tension vs. total SM-α-actin fluorescence intensity. Data are presented as Mean ± SEM; Wall tension: n = 12 vessels each for control and serum-treated groups; n = 7 for the serum + Ach group and n = 5 for the serum washout group. Total MLC-p: n = 6 vessels each for the control and serum-treated groups; n = 7 for the serum + Ach group and n = 4 for the serum washout group. Total SM-α-actin: n = 5 vessels each for control, serum, serum washout and serum + Ach groups. (C) Schematic showing the observed changes of MLC phosphorylation during stable myogenic tone, serum induced vasoconstriction and re-established stable tone after serum washout.

References

    1. Pavlovic AM, et al. Increased risk of cognitive impairment and more severe brain lesions in hypertensive compared to non-hypertensive patients with cerebral small vessel disease. J. Clin. Hypertens. (Greenwich) 2018;20:1260–1265. doi: 10.1111/jch.13357. - DOI - PMC - PubMed
    1. Tan R, Traylor M, Rutten-Jacobs L, Markus H. New insights into mechanisms of small vessel disease stroke from genetics. Clin. Sci. (Lond) 2017;131:515–531. doi: 10.1042/CS20160825. - DOI - PubMed
    1. Jarajapu YP, Knot HJ. Relative contribution of Rho kinase and protein kinase C to myogenic tone in rat cerebral arteries in hypertension. Am. J. Physiol. Heart Circ. Physiol. 2005;289:H1917–1922. doi: 10.1152/ajpheart.01012.2004. - DOI - PubMed
    1. Hong K, Li M, Nourian Z, Meininger GA, Hill MA. Angiotensin II type 1 receptor mechanoactivation involves RGS5 (Regulator of G protein signaling 5) in skeletal muscle arteries: Impaired trafficking of RGS5 in hypertension. Hypertension. 2017;70:1264–1272. doi: 10.1161/HYPERTENSIONAHA.117.09757. - DOI - PMC - PubMed
    1. Schiffrin EL, Park JB, Intengan HD, Touyz RM. Correction of arterial structure and endothelial dysfunction in human essential hypertension by the angiotensin receptor antagonist losartan. Circulation. 2000;101:1653–1659. doi: 10.1161/01.CIR.101.14.1653. - DOI - PubMed