. 2023 Jan;25(1):30-41.
doi: 10.1038/s41556-022-01053-0. Epub 2023 Jan 17.

Stromal niche inflammation mediated by IL-1 signalling is a targetable driver of haematopoietic ageing

Affiliations

Stromal niche inflammation mediated by IL-1 signalling is a targetable driver of haematopoietic ageing

Carl A Mitchell et al. Nat Cell Biol. 2023 Jan.

Abstract

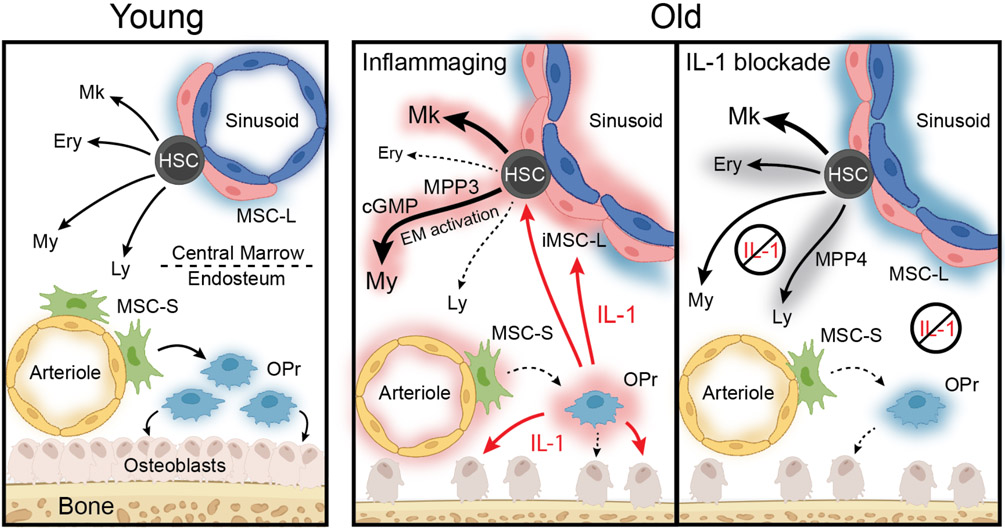
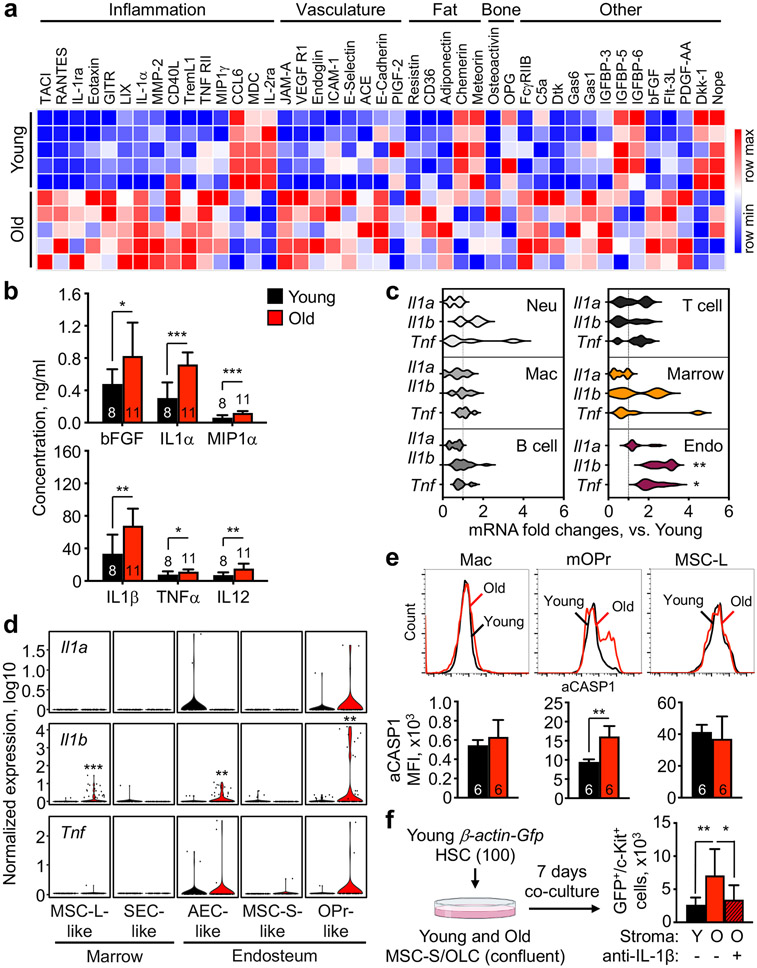
Haematopoietic ageing is marked by a loss of regenerative capacity and skewed differentiation from haematopoietic stem cells (HSCs), leading to impaired blood production. Signals from the bone marrow niche tailor blood production, but the contribution of the old niche to haematopoietic ageing remains unclear. Here we characterize the inflammatory milieu that drives both niche and haematopoietic remodelling. We find decreased numbers and functionality of osteoprogenitors at the endosteum and expansion of central marrow LepR+ mesenchymal stromal cells associated with deterioration of the sinusoidal vasculature. Together, they create a degraded and inflamed old bone marrow niche. Niche inflammation in turn drives the chronic activation of emergency myelopoiesis pathways in old HSCs and multipotent progenitors, which promotes myeloid differentiation and hinders haematopoietic regeneration. Moreover, we show how production of interleukin-1β (IL-1β) by the damaged endosteum acts in trans to drive the proinflammatory nature of the central marrow, with damaging consequences for the old blood system. Notably, niche deterioration, HSC dysfunction and defective regeneration can all be ameliorated by blocking IL-1 signalling. Our results demonstrate that targeting IL-1 as a key mediator of niche inflammation is a tractable strategy to improve blood production during ageing.


Figures

Extended Data Figure 1 ∣
Extended Data Figure 1 ∣. Gross analysis of the remodeled old BM cavity.
a, H&E staining of humeri and sterna of 2 individual young and old mice. Scale bar, 100 μm. b, TPO and TGF-β levels in young and old BM fluids. Results are from 2 independent cohorts. c, μCT analyses of young and old tibias with representative images of cortical and trabecular regions (left) and quantification of bone volume/total volume (BV/TV) and connectivity density (right). d, Representative image of bone lining ALCAM+ osteoblasts immunofluorescence staining in young and old mice. Scale bar, 100 μm. e, Representative images and quantification of immunofluorescence staining of vascular volume (laminin) and vascular leakage by dragon-green beads (DGB) diffusion assay in young and old BM. Scale bar, 50 μm. f, Representative images and quantification by flow cytometry of DGB endocytosis in young and old marrow SEC; scale bar, 5 μm. Results are from 3 independent cohorts. g, Representative images of Von Kossa staining in young and old endosteal MSC-S. h, Experimental scheme for the indicated co-culture experiments showing the effects of young or old BM cells on young MSC-S (top right), and young BM cells on young and old MSC-S (bottom). i, Frequency of endosteal and marrow mesenchymal populations in young and middle age (13-month-old) mice with changes in CFU-F from endosteal OLCs (bottom right). Data are means ± S.D; *p ≤ 0.05, **p ≤ 0.01, ***p ≤ 0.001.
Extended Data Figure 2 ∣
Extended Data Figure 2 ∣. Molecular features of old mesenchymal populations.
a, UMAP visualization of the entire plate-based scRNAseq dataset of niche populations of mesenchymal and endothelial populations shown in Fig. 2a. b, Global changes in MSC-L gene identity in clusters M2 vs. M1 (***padj ≤ 0.001). c, Representative flow cytometry staining (top) and quantification of LepR and PDGF-Rα levels (bottom) in young and old MSC-L. Results are from 6 independently analyzed groups of 1 or 2 young or old mice. d, HSC niche factors with violin plots representation of Kitl and Cxcl12 expression in the indicated young and old mesenchymal populations (left) and SCF and SDF1α levels in young and old BM fluids (right). e, GSEA results for Hallmark biological processes significantly affected in old MSC-L-like, OPr-like and MSC-S-like groups (FDR < 0.05). Data are means ± S.D. except for (b) and (d); **p ≤ 0.01.
Extended Data Figure 3 ∣
Extended Data Figure 3 ∣. Molecular features of old endothelial populations and further characteristics of the old niche.
a, ICGS output of young and old endothelial populations from the plate-based scRNAseq dataset shown in Fig. 2a with 7 clusters of cells (E1 to E7, horizontal) defined according to the expressing pattern of the 7 clusters of genes (a to g, vertical). Examples included in gene clusters a to g are shown. Star, contaminating mesenchymal/endothelial doublets; P, pericytes; A, arterioles; T, transition vessels. b, Ingenuity Pathway Analysis (IPA) canonical pathways enriched in old AEC-like and SEC-like groups (Z-score > 1; p < 0.01). c, Characteristic expression patterns for the indicated genes in the droplet-based scRNAseq dataset of young and old endosteal and central marrow stromal fractions shown in Fig. 2c. Cells in the UMAP were colored according to the expression levels of the indicated genes. Color scheme is based on ln scale of normalized counts from 0 (gray) to the indicated maximum value in the scale (red).
Extended Data Figure 4 ∣
Extended Data Figure 4 ∣. Age-related changes in blood and BM populations and altered lineage bias in old MPPs.
a, Overlap between cytokines upregulated in old BM fluids and published SASP profile. b, Representative SA-β-gal staining in control irradiated mouse embryonic fibroblasts (MEF) and isolated young and old MSC-S and OBC. Scale bar, 20 μm. c, Absolute expression of Il1b in different mature hematopoietic cell types and unfractionated (CD45/Ter119) endosteal and central marrow stroma from pooled young and old samples. Results are expressed as −log(dCt) relative to gapdh. d, Complete blood count (CBC) parameters in young and old mice. Results are from 7 independent cohorts. WBC, white blood cell; My, myeloid (neutrophil + basophil + eosinophil); Ly, lymphocyte; RBC, red blood cell; Pt, platelet. e, Cellularity and quantification of mature populations in young and old BM. Results are from 3 independent cohorts. Gr, Mac-1+/Gr-1+ granulocyte; B cell, B220+ B cell; T cell, CD3+ T cell. f, Quantification of progenitor populations in young and old BM. Results are from 3 independent cohorts. CMP, common myeloid progenitor; GMP, granulocyte-macrophage progenitor; MEP, megakaryocyte-erythrocyte progenitor; CLP, common lymphoid progenitor; CFU-E, erythroid colony-forming unit; Pre-GM, pre-granulocyte/macrophage; Pre-MegE, pre-megakaryocyte/erythrocyte; MkP, megakaryocyte progenitor. g, Representative staining and quantification of CD34, CD41, CD62P and vWF levels on young and old HSCs. Results are from 2 independent cohorts, with data represented as box and whiskers (min to max) and expressed as fold changes in mean fluorescence intensity (MFI) relative to young HSCs. h, Characteristic expression patterns of lineage determinant genes in the droplet-based scRNAseq young and old LK/LSK dataset shown in Fig. 4b. Cells in the UMAP were colored according to the expression levels of the indicated genes. Color scheme is based on ln scale of normalized counts from the indicated minimum (gray) to maximum (red) value in the scale. i, IPA Upstream Regulators analysis of young and old populations from the droplet-based scRNAseq young and old LK/LSK dataset shown in Fig. 4b filtered on cytokines and growth factors. Data are means ± S.D. except when indicated; *p ≤ 0.05, **p ≤ 0.01, ***p ≤ 0.001.
Extended Data Figure 5 ∣
Extended Data Figure 5 ∣. Altered functionality of old HSCs and MPPs.
a, Colony formation in methylcellulose for young (Y) and old (O) HSCs, MPP3 and MPP4. Results are from 2 independent experiments. Mix: all lineages; GM: granulocyte/macrophage; G(or)M: granulocyte (or) macrophage; MegE: megakaryocyte/erythrocyte; CFU: colony-forming units. b, Myeloid differentiation in liquid culture for young and old MPP3 with quantification (right) of immature Sca-1+/c-Kit+ cells (left) and mature Mac-1+/FcgR+ macrophage (right). c, Representative flow cytometry staining of CD19+ lymphoid vs. Mac-1+ myeloid differentiation in OP9+IL7 culture conditions for young and old HSCs, MPP3 and MPP4. Results are representative of 3 independent experiments. d, Representative histograms of CFSE staining of cultured young and old HSCs, MPP3 and MPP4. Results are representative of 3 independent experiments. e, Cleaved caspase 3/7 (CC3/7) activity in cultured young and old HSCs, MPP3 and MPP4. f, Short-term lineage tracking following transplantations of young and old HSCs, MPP3 and MPP4 in sub-lethally irradiated recipients with experimental scheme (left) and quantification of overall blood donor chimerism (top graphs) and myeloid chimerism among donor cells (bottom graphs). Results are from 3 independent cohorts. Data are means ± S.D. except for (f) (± S.E.M.); *p ≤ 0.05, **p ≤ 0.01, ***p ≤ 0.001.
Extended Data Figure 6 ∣
Extended Data Figure 6 ∣. Improved aging features with IL-1 signaling blockade.
a-c, Short-term blockade of IL-1 signaling upon Anakinra (Ana) treatment in young (Y) and old (O) mice with: (a) experimental scheme; (b) changes in HPSC frequency; and (c) engraftment over time (left) and lineage reconstitution (right) at 4 months (4 mo) post-transplantation (Tplx) of the indicated HSC populations. Results are from 3 independent cohorts of young and old mice injected with either PBS or Anakinra, with HSCs isolated from the pooled BM of mice from the same treatment group and transplanted into 3 to 5 recipients, each. d-e, Additional characterization of the effects of Anakinra blockade of IL-1 signaling during 5FU-mediated regeneration in young and old mice with: (d) changes in IL-1α, IL-1β and MIP1α levels in BM fluids; and (e) platelet (Plt) levels in peripheral blood. Results are from 3 independent cohorts started with 15 young and 11 old mice treated once with 5FU, injected daily with either PBS or Anakinra, and analyzed at day 12 post-5FU treatment. f, GSEA results for Hallmark biological processes significantly enriched in MSC-L2 vs. MSC-L1 groups (FDR < 0.05). Data are from the droplet-based scRNAseq analyses of endosteal and central marrow stromal fractions in young (n = 2) and old (n = 2) Il1r1+/+ wild type (WT) mice and old (n = 1) Il1r1−/− mice shown in Fig. 7b. g-h, Droplet-based scRNAseq analyses of Lin/c-Kit+ (LK) and Lin/Sca-1+/c-Kit+ (LSK) BM fractions isolated from young (n = 2) and old (n = 2) Il1r1+/+ wild type (WT) and old (n = 1) Il1r1−/− mice with (g) UMAP visualization and (h) quantification of percent of HSPCs and progenitors. Data are means ± S.D. except for engraftment results shown in (c) (± S.E.M.); *p ≤ 0.05, **p ≤ 0.01, ***p ≤ 0.001.
Extended Data Figure 7 ∣
Extended Data Figure 7 ∣. Key role of IL-1 in the aging of both BM niche and blood system.
a-b, GSEA results in old Il1r1−/− HSPC population for the Gene Ontology pathways affected in either old WT HSPCs (a) or young WT HSPCs (b) identified by droplet-based scRNAseq analyses. n/a, non-available; ns, non-significant; *nominal p value ≤ 0.05, ** nominal p value ≤ 0.01, *** nominal p value ≤ 0.001. c, Peripheral blood CD45.1+ donor chimerism (left) and number of donor-derived GMPs (right) in young or old WT and Il1r1−/− CD45.2+ recipient mice at 4 months (mo) after lethal irradiation and transplantation (Tplx) with 2x10⁶ young WT CD45.1+ donor BM cells. d, Il1r1 expression in the droplet-based scRNAseq of young and old WT stroma and LK/LSK datasets. Cells in the UMAP were colored according to the expression levels of the indicated genes. Color scheme is based on ln scale of normalized counts from the indicated minimum (gray) to maximum (red) value in the scale. e-i, Unchanged aging features in old Tnf−/− mice with: (e) color scheme; (f) blood parameters; (g) endosteal (left) and central marrow (right) mesenchymal population frequencies; (h) BM hematopoietic population frequencies; and (i) engraftment over time (left) and lineage reconstitution (right) at 4 mo post-Tplx of the indicated HSC populations. Results are from 3 independent cohorts of young and old WT and age-matched Tnf−/− mice, with HSCs isolated from the pooled BM of mice of the same genotype and transplanted into 3 to 5 recipients, each. Data are means ± S.D. except for engraftment results shown in (i) (± S.E.M.); *p ≤ 0.05, **p ≤ 0.01, ***p ≤ 0.001.
Extended Data Figure 8 ∣
Extended Data Figure 8 ∣. Schematic of the crosstalk between the BM niche and hematopoietic system during physiological aging.
In youth, HSCs reside primarily in the central marrow where they are maintained by peri-sinusoidal MSC-L and produce a balanced output of all mature cell lineages (Mk, megakaryocytes; Ery, erythrocytes, My, myeloid cells; Ly, lymphoid cell). Abundant peri-arteriolar MSC-S at the endosteum efficiently produce OPr cells that support osteoblast development, ECM deposition and bone formation. With age, numerical loss and functional decline of MSC-S and OPr leads to bone thinning, with the remaining OPr constitutively producing IL-1. Chronic IL-1, in turn, reinforces niche degradation at the endosteum and contributes to dysfunction of the sinusoidal vasculature. Chronic IL-1 also acts in trans on central marrow MSC-L and HSPCs, driving the appearance of an inflammatory iMSC-L subset and steady-state engagement of emergency myelopoiesis (EM) programs with GMP cluster (cGMP) formation. Strikingly, acute IL-1 blockade with Anakinra enables more youthful blood production during 5FU-mediated regeneration, and life-long removal of IL-1 signaling in Il1r1−/− mice maintains MSC-L in a more youthful cell state associated with improved blood production and HSC function.
Figure 1 ∣
Figure 1 ∣. Remodeled BM microenvironment with age.
a, Experimental scheme to investigate endosteal (Endo) and central marrow (Marrow) stromal populations in young (~ 8 week of age) and old (~ 24 months of age) C57BL/6 wild type (WT) mice. Results are from 6 independently analyzed groups of 1 or 2 young or old mice. Cellularity data per mouse are for 1 BM plug for marrow populations and bone chips from 10 bones for endosteal populations. b, Changes in endosteal and marrow endothelial cell (EC) populations with age showing frequency (top) and total cell numbers (bottom). AEC, arteriolar endothelial cell; SEC, sinusoidal endothelial cell. c, Whole mount staining of the BM vasculature in young and old mice. Scale bar, 100 μm. d, Changes in endosteal and marrow mesenchymal populations with age showing frequency (top) and total cell numbers (bottom). MSC, Sca-1+ peri-arteriolar mesenchymal stroma cell; mOPr, PDGFRα+ multipotent osteoprogenitor; OPr, PDGFRα osteoprogenitor; MSC-L, LepR+ peri-sinusoidal mesenchymal stroma cell; iMSC-L, Sca-1low inflammatory MSC-L. e, Representative image of MSC-L immunofluorescence staining in young and old BM. Scale bar, 38 μm. f, Representative pictures and quantification of fibroblast colony-forming units (CFU-F) from young and old MSC-S, osteoblastic lineage cell (OLC) and MSC-L. Results are from 5 independent cohorts. Data are means ± S.D.; P-values were obtained by two-tailed Welch’s t-test without adjustment for multiple comparisons.
Figure 2 ∣
Figure 2 ∣. Molecular characterization of the old BM niche.
a, UMAP visualization of plate-based scRNAseq analyses of mesenchymal (left) and endothelial (right) populations isolated from young (n = 3) and old (n = 4) mice. b, ICGS output of young and old mesenchymal populations with 16 clusters of cells (M1 to M16, horizontal) defined according to the expressing pattern of the 6 clusters of genes (A to F, vertical). Examples included in gene clusters A to F are shown. c, UMAP visualization of droplet-based scRNAseq analyses of endosteal and central marrow stroma fractions isolated from young (n = 2) and old (n = 1) mice. OLC, osteolineage cell; OPr(cart), cartilagenic osteoprogenitor; OPr(fibr), fibrogenic osteoprogenitor; Prc, pericyte.
Figure 3 ∣
Figure 3 ∣. Inflammatory nature of the old BM niche.
a, Differentially secreted cytokines in young and old BM fluid measured by 200-plex array and clustered based on biological functions (n = 5). b, Changes in pro-inflammatory cytokines in young and old BM fluids. Results are from 3 independent cohorts. c, qRT-PCR-based analyses of Il1a, Il1b and Tnf expression in old BM cells and stromal fractions (n = 6). Results are represented as violin plots and are expressed as fold change compared to their respective young counterpart. Neu, Mac-1+/Ly-6G+/Ly-6Cmid neutrophil; Mac, Mac-1+/Ly-6G/Ly-6C macrophage; B cell, B220+/CD19+ B cell; T cell, CD4+/TCRβ+ T cell; Marrow, Ter119/CD45 central marrow fraction; Endo, Ter119/CD45 endosteal fraction. d, Violin plots representation of Il1a, Il1b, and Il1rn expression in the indicated young and old mesenchymal and endothelial like groups. Results are from the plate-based scRNAseq dataset; *padj ≤ 0.05, ** padj ≤ 0.01, *** padj ≤ 0.001. e, Caspase 1 activity (aCASP1) in the indicated young and old BM and stromal populations with representative FACS plots (top) and quantification (bottom). f, Experimental scheme for the indicated co-culture experiments showing the effects of young and old stroma on young HSC expansion as dependent on IL-1β. Data are means ± S.D.; P-values were obtained by two-tailed Welch’s t-test without adjustment for multiple comparisons (b) (c) (e), by two-tailed Student’s t-test adjusted for multiple comparisons using the Benjamini-Hochberg method (d), or by one-way Anova adjusted for multiple comparisons using Tukey’s method (f).
Figure 4 ∣
Figure 4 ∣. Activation of emergency myelopoiesis pathways in the old blood system.
a, Representative flow cytometry plots (top) and quantification (bottom) of HSCs and MPP populations in young and old mice. Results are from 4 independent cohorts with data expressed are means ± S.D; **p ≤ 0.01, ***p ≤ 0.001. b, UMAP visualization of droplet-based scRNAseq analyses of Lin/c-Kit+ (LK) and Lin/Sca-1+/c-Kit+ (LSK) BM fractions isolated from young (n = 2) and old (n = 1) mice. stHSC, short-term HSC; MPP(my), myeloid-primed MPP; GMP, granulocyte/macrophage progenitor; EryP, erythroid progenitor; MkP, megakaryocyte progenitor; CLP, common lymphoid progenitor; BcP, B cell progenitor. c, Quantification of the HSPCs and progenitors (Prog.) identified by droplet-based scRNAseq analyses. Results are expressed as percent LSK and LK, respectively. d, GSEA results for Reactome pathway analyses of isolated young and old MPP3 and MPP4 analyzed by microarray (FDR < 0.05; n = 3 per population). e, Pearson correlation of Fluidigm gene expression data comparing old and regenerative HSCs, MPP3 and MPP4 (n = 4 per population). Regenerating populations were isolated 2 and 3 weeks following young HSC transplantation (Tplx). f, GMP immunofluorescence staining in young and old BM. Representative of 2 independent experiments. Stars indicate self-renewing GMP patches. Scale bar, 60 μm. g, GSEA results for Gene Ontology analyses of affected pathways in old populations identified by droplet-based scRNAseq analyses. Data are means ± S.D.; P-values were obtained by two-tailed Welch’s t-test without adjustment for multiple comparisons (a) or Kolmogorov-Smirnov test (g); nd, not detected; ns, non-significant.
Figure 5 ∣
Figure 5 ∣. Impaired hematopoietic regeneration in old mice.
a-b, Summary of (a) survival and (b) blood regeneration in young and old mice following one 5FU injection. Results are from 3 independent cohorts started with 20 individual young and old mice injected with 5FU per group. c-d, Regeneration of (c) myeloid and (d) B cell populations post-5FU treatment of young and old mice with quantification of changes in the blood (left) and BM (right). e, Regeneration of the indicated BM progenitor populations post-5FU treatment of young and old mice. f, Representative image of GMP immunofluorescence staining at 12 days (D12) post-5FU treatment of young and old mice. Dotted lines indicate differentiating GMP clusters and stars self-renewing GMP patches. Representative of 3 independent experiments. Scale bar, 60 μm. g, Changes in IL-1α and IL-1β levels in BM fluids post-5FU treatment of young and old mice. Data are means ± S.D. except for CBC data shown in (b), (c) and (d) (± S.E.M.); P-values were obtained by log-rank test (a) or by two-tailed Student’s t-test without adjustment for multiple comparisons (b-g); *p ≤ 0.05.
Figure 6 ∣
Figure 6 ∣. Modulating IL-1 levels affects aging parameters.
a-g, Pro-aging effects of chronic IL-1β exposure in young mice with: (a) experimental scheme (left) and CBC values (right); (b) representative staining of the BM vasculature (scale bar, 100 μm); (c) changes in SEC frequency (left) and dragon green beads (DGB) retention (right); (d) changes in the indicated endosteal mesenchymal populations; (e) representative μCT images of trabecular bone; (f) quantification of μCT parameters; and (g) results of CFU-F assays. Results are from 4 independent cohorts of young and old mice injected daily with either PBS or IL-1β for 20 days. h-k, Pro-regenerative effects of acute IL-1 signaling blockade with Anakinra (Ana) in 5FU-treated old mice with: (h) experimental scheme; (i) representative H&E staining of sternum (scale bar, 100 μm); (j) quantification of the indicated BM HSPCs; and (k) quantification of the indicated BM mature populations and blood parameters. Results are from 3 independent cohorts started with 15 young and 11 old mice treated once with 5FU, injected daily with either PBS or Anakinra, and analyzed at day 12 post-5FU treatment. Data are means ± S.D.; P-values were obtained by two-tailed Student’s t-test without correction for multiple comparisons.
Figure 7 ]
Figure 7 ]. Blocking IL-1 signaling delays niche aging and improves old blood parameters.
a-b, Improved stromal aging features in old Il1r1−/− mice with: (a) color scheme (left) as well as endosteal (right) and central marrow (bottom) mesenchymal population frequencies; and (b) UMAP visualization of droplet-based scRNAseq analyses of endosteal and central marrow stromal fractions in young (n = 2) and old (n = 2) Il1r1+/+ wild type (WT) mice and old (n = 1) Il1r1−/− mice with quantification of percent of the different mesenchymal and endothelial populations (right). c-e, Delayed blood aging and improved HSC function in old Il1r1−/− mice with: (c) blood (top) and BM (bottom) parameters, (d) Rps29 expression in the droplet-based scRNAseq of old WT/Il1r1−/− LK/LSK dataset; and (e) engraftment over time (left) and lineage reconstitution (right) at 4 months (4mo) post-transplantation (Tplx) of the indicated HSC populations. Results are from 3 independent cohorts of young and old WT and age-matched Il1r1−/−, with HSCs isolated from the pooled BM of mice of the same genotype and transplanted into 3 to 5 recipients, each. f, Experimental scheme and donor myeloid cell output in young and old WT and Il1r1−/− recipients transplanted with young BM at 4 mo post-Tplx. Data are means ± S.D. except for engraftment results shown in (e) (± S.E.M.); P-values were obtained by two-tailed Student’s t-test without adjustment for multiple comparisons (a) and (c) or by one-way Anova followed by uncorrected Fisher’s LSD test (e) and (f).

References

    1. Rossi DJ, Jamieson CHM & Weissman IL Stems cells and the pathways to aging and cancer. Cell 132, 681–696 (2008). - PubMed
    1. Morrison SJ & Scadden DT The bone marrow niche for haematopoietic stem cells. Nature 505, 327–334 (2014). - PMC - PubMed
    1. Pinho S & Frenette PS Haematopoietic stem cell activity and interactions with the niche. Nat. Rev. Mol. Cell Biol 20, 303–320 (2019). - PMC - PubMed
    1. Verovskaya EV, Dellorusso PV & Passegué E Losing sense of self and surroundings: hematopoietic stem cell aging and leukemic transformation. Trends Mol. Med 25, 494–515 (2019). - PMC - PubMed
    1. Ho Y-H & Méndez-Ferrer S Microenvironmental contributions to hematopoietic stem cell aging. Haematologica 105, 38–46 (2020). - PMC - PubMed

Methods-only References

    1. Zhou BO, Yue R, Murphy MM, Peyer JG & Morrison SJ Leptin-receptor-expressing mesenchymal stromal cells represent the main source of bone formed by adult bone marrow. Cell Stem Cell 15, 154–168 (2014). - PMC - PubMed
    1. Picelli S et al. Full-length RNA-seq from single cells using Smart-seq2. Nat. Protoc 9, 171–181 (2014). - PubMed
    1. Bagnoli JW et al. Sensitive and powerful single-cell RNA sequencing using mcSCRB-seq. Nat. Commun 9, 2937 (2018). - PMC - PubMed
    1. Anders S, Pyl PT & Huber W HTSeq--a Python framework to work with high-throughput sequencing data. Bioinformatics 31, 166–169 (2015). - PMC - PubMed
    1. Brennecke P et al. Accounting for technical noise in single-cell RNA-seq experiments. Nat. Methods 10, 1093–1095 (2013). - PubMed

Publication types