. 2023 Jan 17;21(1):32.
doi: 10.1186/s12967-023-03874-5.

FASN multi-omic characterization reveals metabolic heterogeneity in pancreatic and prostate adenocarcinoma

Affiliations

FASN multi-omic characterization reveals metabolic heterogeneity in pancreatic and prostate adenocarcinoma

Ugo Chianese et al. J Transl Med. .

Abstract

Background: Pancreatic ductal adenocarcinoma (PDAC) and prostate cancer (PCa) are among the most prevalent malignant tumors worldwide. There is now a comprehensive understanding of metabolic reprogramming as a hallmark of cancer. Fatty acid synthase (FASN) is a key regulator of the lipid metabolic network, providing energy to favor tumor proliferation and development. Whereas the biological role of FASN is known, its response and sensitivity to inhibition have not yet been fully established in these two cancer settings.

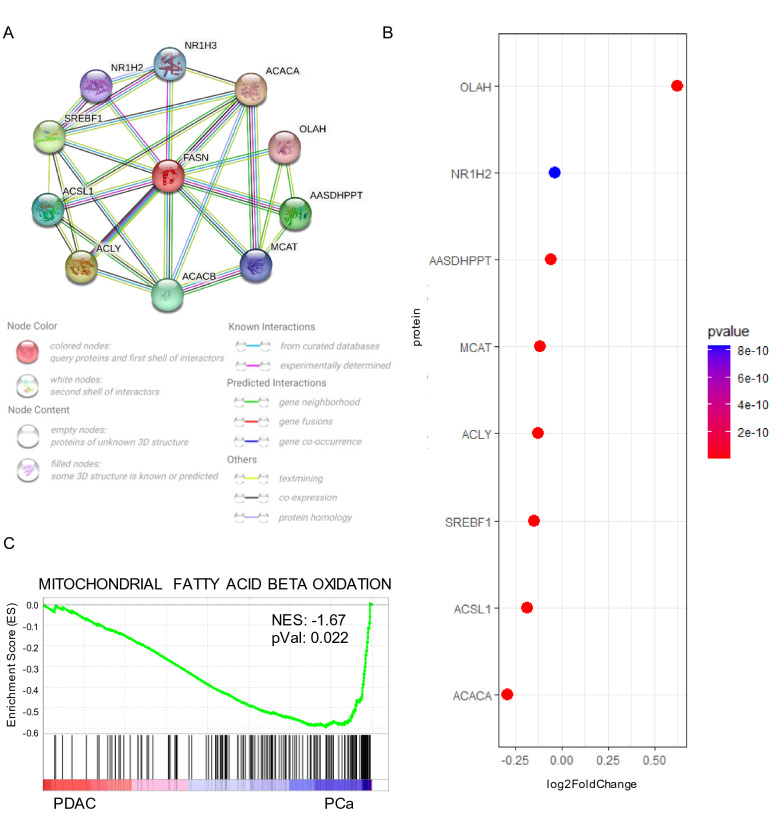
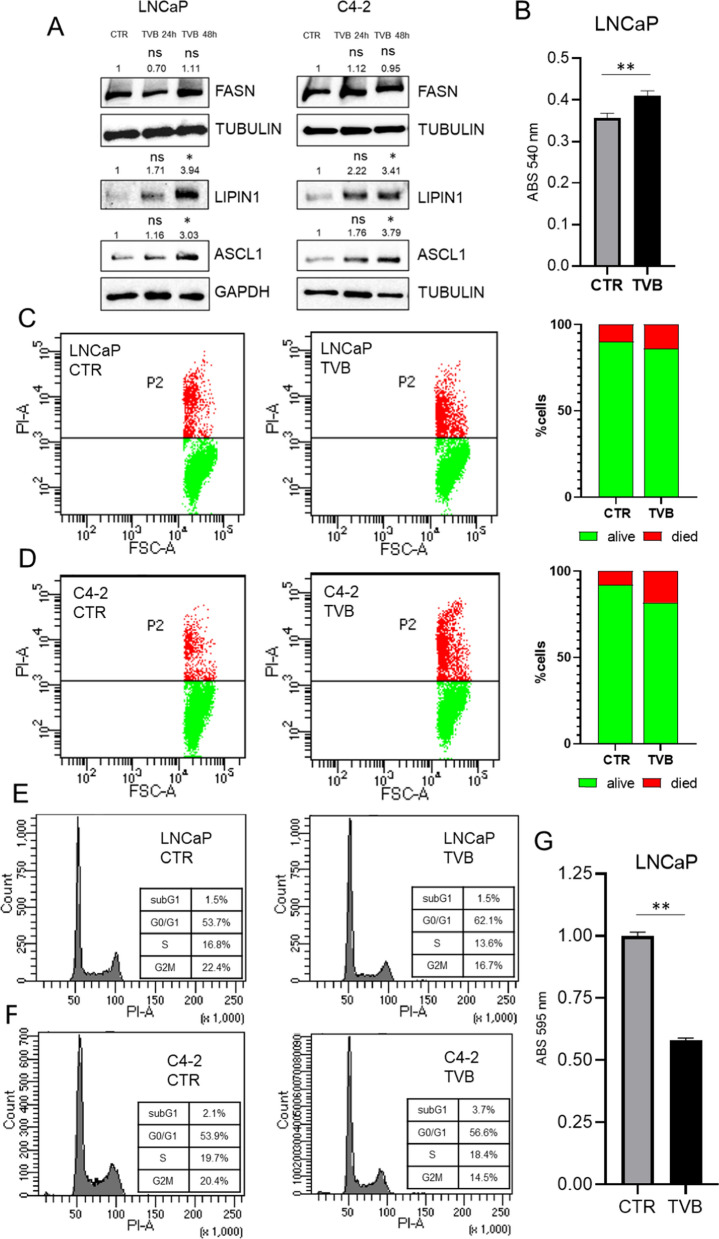
Methods: To evaluate the association between FASN expression, methylation, prognosis, and mutational profile in PDAC and PCa, we interrogated public databases and surveyed online platforms using TCGA data. The STRING database was used to investigate FASN interactors, and the Gene Set Enrichment Analysis platform Reactome database was used to perform an enrichment analysis using data from RNA sequencing public databases of PDAC and PCa. In vitro models using PDAC and PCa cell lines were used to corroborate the expression of FASN, as shown by Western blot, and the effects of FASN inhibition on cell proliferation/cell cycle progression and mitochondrial respiration were investigated with MTT, colony formation assay, cell cycle analysis and MitoStress Test.

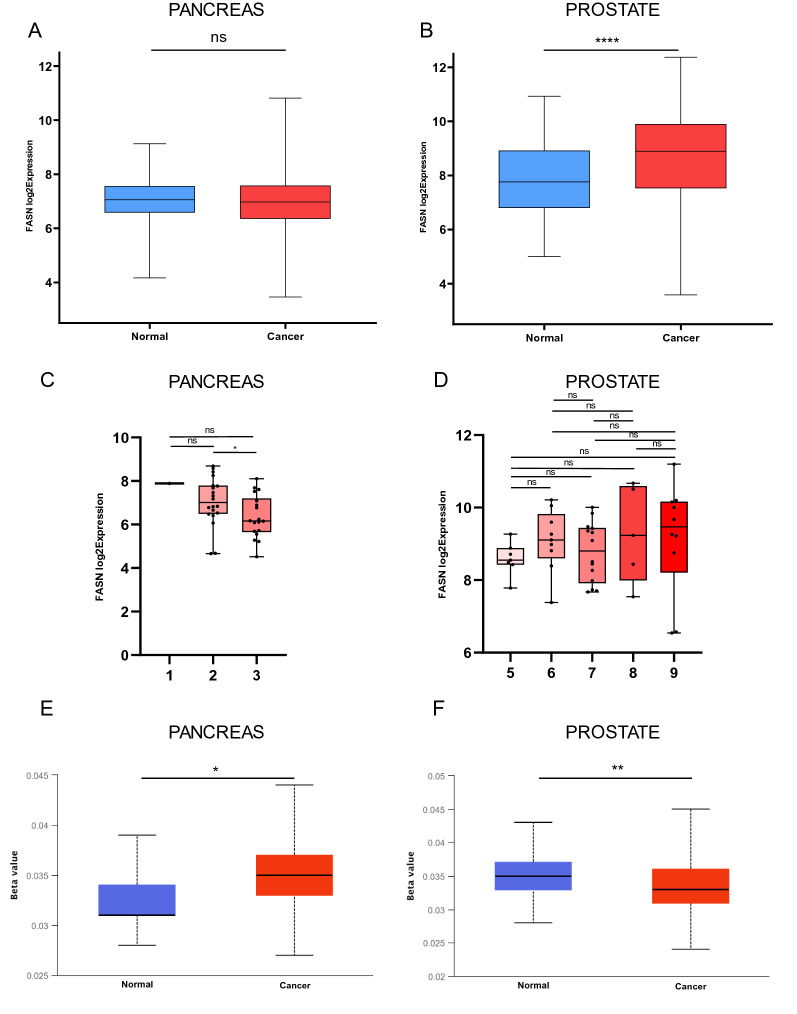
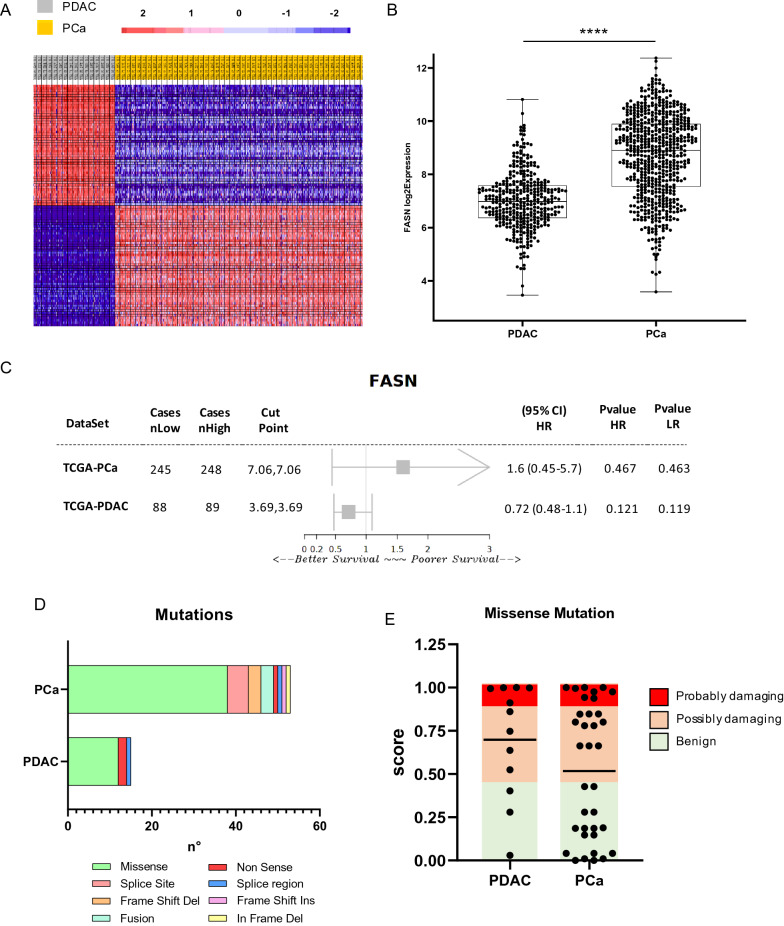
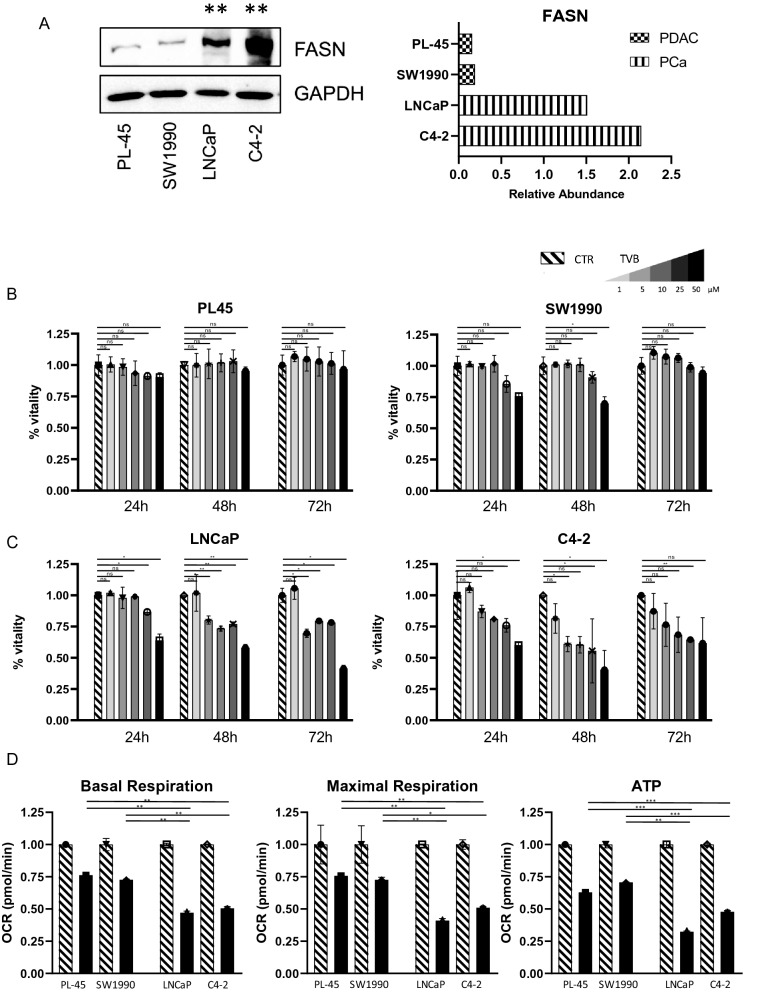
Results: The expression of FASN was not modulated in PDAC compared to normal pancreatic tissues, while it was overexpressed in PCa, which also displayed a different level of promoter methylation. Based on tumor grade, FASN expression decreased in advanced stages of PDAC, but increased in PCa. A low incidence of FASN mutations was found for both tumors. FASN was overexpressed in PCa, despite not reaching statistical significance, and was associated with a worse prognosis than in PDAC. The biological role of FASN interactors correlated with lipid metabolism, and GSEA indicated that lipid-mediated mitochondrial respiration was enriched in PCa. Following validation of FASN overexpression in PCa compared to PDAC in vitro, we tested TVB-2640 as a FASN inhibitor. PCa proliferation arrest was modulated by FASN inhibition in a dose- and time-dependent manner, whereas PDAC proliferation was not altered. In line with this finding, mitochondrial respiration was found to be more affected in PCa than in PDAC. FASN inhibition interfered with metabolic signaling causing lipid accumulation and affecting cell viability with an impact on the replicative processes.

Conclusions: FASN exhibited differential expression patterns in PDAC and PCa, suggesting a different evolution during cancer progression. This was corroborated by the fact that both tumors responded differently to FASN inhibition in terms of proliferative potential and mitochondrial respiration, indicating that its use should reflect context specificity.

Keywords: FASN; Metabolism; Pancreatic adenocarcinoma; Proliferation; Prostate adenocarcinoma.


Conflict of interest statement

The authors declare no competing interest.

Figures

Fig. 1
Fig. 1
A Fatty acid synthase (FASN) transcription levels in normal pancreatic tissue and PDAC tissue from GLP96 and GLP570 databases. Statistically significant cal culated with paired t-test. B Statistically significant FASN transcription levels in normal prostate tissue and PCa tissue from GLP96 and GLP570 (**** < 0.0001) calculated with paired t-test. C FASN expression based on grade in PDAC samples. Statistical significance has been calculated as two-sample test across each tumor grade, (*p < 0.05) (ns not significance). D FASN expression based on grade in PCa tissue. Statistical significance has been calculated as two-sample test across each tumor grade (ns not significance). E Statistically significant FASN methylation levels in normal pancreatic tissue and PDAC tissue p < 0.05) calculated with paired t-test. F Statistically significant FASN methylation levels in normal prostate tissue and PCa tissue (**p < 0.01) calculated with paired t-test. Boxes indicate the median, and 25th and 75th percentiles. Red boxes indicate tumor tissues; blue boxes indicate normal tissues
Fig. 2
Fig. 2
A Heatmap showing DEGs from an RNA-s eq data comparison between PDAC and PCa. B Box plot showing fold-change of FASN expression in PDAC and PCa FASN expression was derived from RNA-seq data (****p < 0.0001) calculated with paired t-test. C Forest plot showing survival index in PDAC and PCa for FASN from the web plat form Survival Genie. D FASNmutations in PDAC and PCa based on data obtained from cBioPortal. E Predictive score associated with protein damaging related to missensemutations PDAC and PCa based on data obtained from cBioPortal and Polyphen-2
Fig. 3
Fig. 3
A predicted structural proteins essential for the functioning of FASN generated from STRING. Circles indicate nodes. Predicted functional interactors are shown as Top 10 based on score. B Expression of Top 10 FASN interactors in PDAC and Pca. C GSEA performed with Reactome gene set database matching pCA against PDAC
Fig. 4
Fig. 4
A FASN expression by Western blot analysis in PL-45, SW1990, LNCaP, and C4-2 cells with relative abundance. Statistical significance with two sample t-test between PDAC and PCa cell lines reported as **p < 0.01. B Viability assay in PDAC systems (PL-45 and SW1990). TVB-2640 was used at a final concentration of 1 μM, 5 μM, 10 μM, 25 μM, and 50 μM for 24 h, 48 h, and 72 h. C Proliferation assay in PCa systems (LNCaP and C4-2). TVB-2640 was used at a final concentration of 1 μM, 5 μM, 10 μM, 25 μM, and 50 μM for 24 h, 48 h, and 72 h. D Oxygen consumption rate (OCR) for basal respiration, maximal respiration, and ATP production in PL-45, SW1990, LNCaP, and C4-2 cells after TVB-2640 treatment at 50 μM for 6 h. Statistical significance with two sample t-test reported as *,**,*** p < 0.05, < 0.01, < 0.001
Fig. 5
Fig. 5
A Western blot analysis of FASN expression in LNCaP and C4-2 cells before and after treatment with TVB-2640 50 μM for 24 h and 48 h. Data were normalized based on control relative abundance. Statistical significance has been calculated with two saples t-test (treated and control) and reported as p** < 0.01. B Histograms reporting absorbance values of red oil assay in LNCaP cells before and after treatment with TVB-2640 50 μM for 72 h. Statistical significance calculated with two saples t-test and reported as p** < 0.01. CD Effects of TVB-2640-related on propidium iodide (PI) incorporation, LNCaP and C4-2 cells were treated with TVB-2640 at 50 μM for 24 h. Graphs of PI distribution show the alive cells (green) and death cells (red). EF Effects of TVB-2640-related on cell cycle regulation. LNCaP and C4-2 were treated with TVB-2640 at 50 μM for 24 h. Graphs show subG1, G0/G1, S and G2M phases. G Histograms reporting absorbance values of colony formation assay on LNCaP cells before and after treatment with TVB-2640 50 μM for 72 h. Statistical significance has been calculated with two saples t-test and reported as p** < 0.01

References

    1. Faubert B, Solmonson A, DeBerardinis RJ. Metabolic reprogramming and cancer progression. Science. 2020 doi: 10.1126/science.aaw5473. - DOI - PMC - PubMed
    1. Gentric G, Mieulet V, Mechta-Grigoriou F. Heterogeneity in cancer metabolism: new concepts in an old field. Antioxid Redox Signal. 2017;26(9):462–485. doi: 10.1089/ars.2016.6750. - DOI - PMC - PubMed
    1. Park JH, Pyun WY, Park HW. Cancer metabolism: phenotype, signaling and therapeutic targets. Cells. 2020;9(10):2308. doi: 10.3390/cells9102308. - DOI - PMC - PubMed
    1. Kim J, DeBerardinis RJ. Mechanisms and implications of metabolic heterogeneity in cancer. Cell Metab. 2019;30(3):434–446. doi: 10.1016/j.cmet.2019.08.013. - DOI - PMC - PubMed
    1. Liberti MV, Locasale JW. The warburg effect: how does it benefit cancer cells? Trends Biochem Sci. 2016;41(3):211–218. doi: 10.1016/j.tibs.2015.12.001. - DOI - PMC - PubMed

Publication types

MeSH terms