

Review
doi: 10.1098/rsif.2022.0406.
Epub 2023 Jan 18.
Neurodegenerative disease of the brain: a survey of interdisciplinary approaches
Affiliations
- PMID: 36651180
- PMCID: PMC9846433
- DOI: 10.1098/rsif.2022.0406
Item in Clipboard
Review
Neurodegenerative disease of the brain: a survey of interdisciplinary approaches
J R Soc Interface.
2023 Jan.
Abstract
Neurodegenerative diseases of the brain pose a major and increasing global health challenge, with only limited progress made in developing effective therapies over the last decade. Interdisciplinary research is improving understanding of these diseases and this article reviews such approaches, with particular emphasis on tools and techniques drawn from physics, chemistry, artificial intelligence and psychology.
Keywords: brain; data; imaging; models; neurodegenerative diseases; physics.
Figures
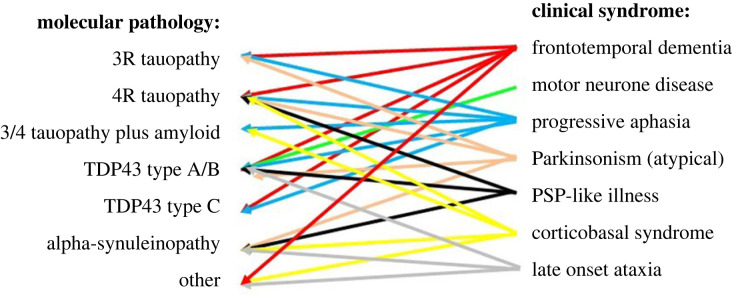
Molecular versus phenotypic precision. The classical presentations of neurodegenerative disease led to identification of their underlying molecular pathology. However, those pathologies in turn have been associated with diverse clinical phenotypes. Although some clinico-pathological correlations are strong, none are wholly exclusive. Even where autosomal dominant genetic disease gives molecular precision, pleiotropy leads to diverse clinical manifestations of the disease. (Figure prepared by Rowe.)
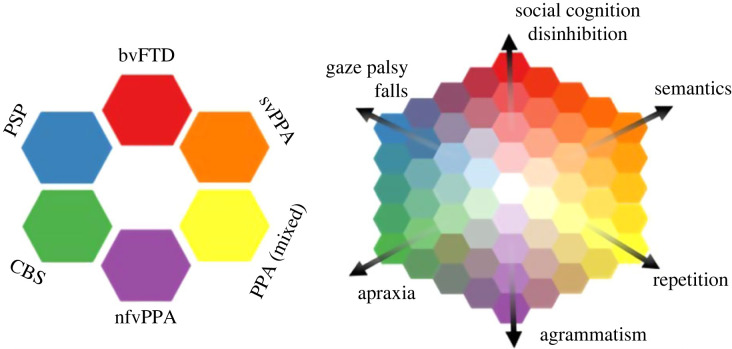
The left panel illustrates a classical approach to diagnosis, with each diagnostic group being distinct from the others, represented by a distinct colour. However, detailed characterization of clinical cohorts (for example, [10]) has shown that intermediate phenotypes are common, and syndromes are not discrete. The right panel illustrates an alternative trans-diagnostic approach, with phenotypic precision along principal dimensions of disease expression. Classical phenotypes exist, but an individual my lie at any point in a continuous ‘colour space’ of clinical phenotypes, and move across the ‘colour map’ as their disease progresses. The anatomical, neurochemical or genetic determinants of the dimensions of disease can be identified, and symptomatic treatments applied according to presence of a clinical feature rather than diagnostic label. Adapted with kind permission from figure published in Rowe [21].
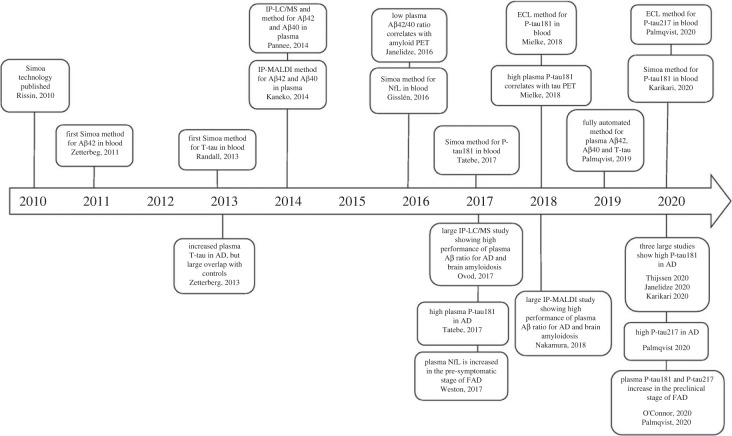
Timeline for blood biomarker developments during the last decade (figure reproduced from from [34] by kind permission of the publishers under Creative Commons licence https://creativecommons.org/licenses/by/4.0/ ). Abbreviations: Simoa, single molecule array; Aβ42, the 42 amino acid form of amyloid β; T-tau, total-tau; IP-LC/MS, immunoprecipitation liquid chromatography-mass spectrometry; IP-MALDI, immunoprecipitation matrix-assisted laser desorption/ionization; Aβ40, the 40 amino acid form of amyloid β; NfL, neurofilament light; P-tau181, tau phosphorylated at amino acid 181; P-tau217, tau phosphorylated at amino acid 217; ECL, electrochemiluminescence [34].
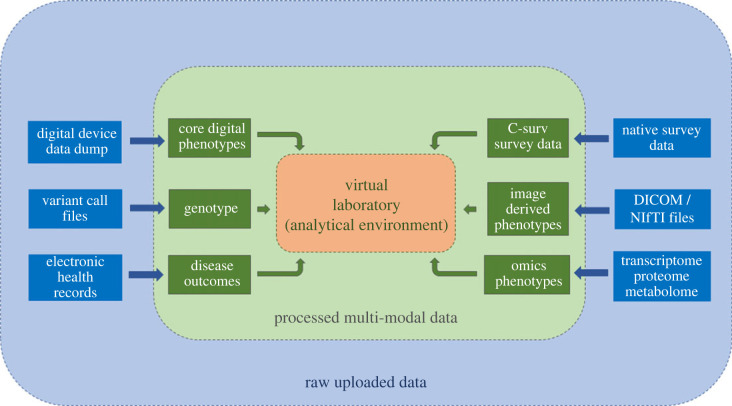
Multi-modal data analysis pipelines (DPUK Spring Academy 2022).
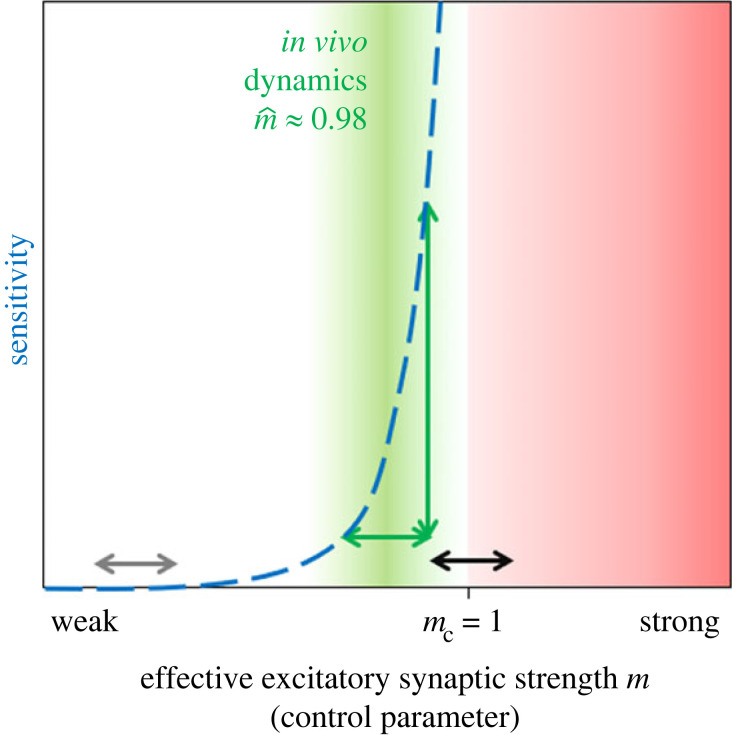
Network properties, like sensitivity to input (blue dashed line), diverge in the vicinity of a critical point (transition at m = mc = 1). Recordings of various mammals suggest consistently that cortical areas operate in a regime close to a critical transition (green area), with a safety margin to supercriticality (red), where activity may become instable (‘bursty’ or highly correlated). In the regime close to criticality (green), small changes in the control parameter m lead to major changes of the sensitivity (green arrows). Thereby, computational properties like the sensitivity can be tuned to task performance. The same amount of change in m hardly incurs any change when the network is far from the transition (grey arrow), but risks tipping over to instability if the network is too close to the transition (black arrow). Hence, in the vicinity of the critical point, the network may profit from sensitive tuning of its network properties to task performance without tipping over to instability. Figure prepared by Priesemann.
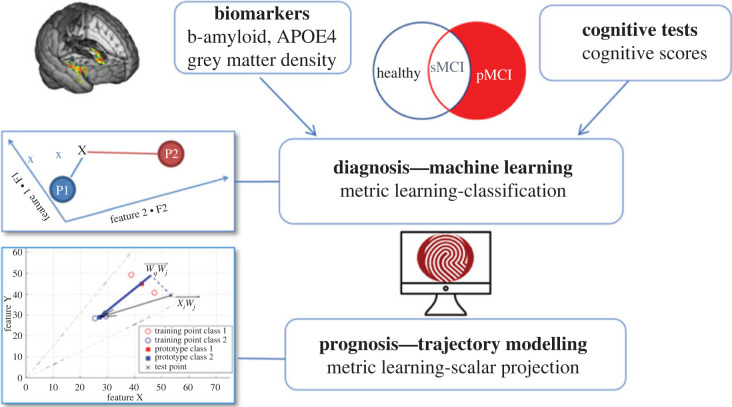
Predictive prognostic modelling approach involving feature extraction, metric learning classification (sMCI: stable mild cognitive impairment. pMCI: progressive mild cognitive impairment) and trajectory modelling. Figure prepared by Kourtzi.
References
-
- Alzheimer's Research UK. 2020. Delivering the Dementia Moonshot. https://www.alzheimersresearchuk.org/wp-content/uploads/2020/01/Deliveri....
-
- HM Government. 2021. Life Sciences Vision—Build Back Better: our plan for growth 2021. See https://assets.publishing.service.gov.uk/government/uploads/system/uploa...
Publication types
MeSH terms
Grants and funding
- MR/T046422/1/MRC_/Medical Research Council/United Kingdom
- MR/T033371/1/MRC_/Medical Research Council/United Kingdom
- MC_UU_00030/14/MRC_/Medical Research Council/United Kingdom
- MR/M008983/1/MRC_/Medical Research Council/United Kingdom
- 220258/WT_/Wellcome Trust/United Kingdom
- BRC-1215-20014/DH_/Department of Health/United Kingdom
- WT_/Wellcome Trust/United Kingdom
- SUAG/051 G101400/MRC_/Medical Research Council/United Kingdom
- MR/S03546X/1/MRC_/Medical Research Council/United Kingdom
- MC_U105597119/MRC_/Medical Research Council/United Kingdom
- MR/P01271X/1/MRC_/Medical Research Council/United Kingdom
- MR/L023784/2/MRC_/Medical Research Council/United Kingdom
- MC_UU_00005/12/MRC_/Medical Research Council/United Kingdom
LinkOut - more resources
Full Text Sources
Medical
