. 2023 Feb 28;51(4):1803-1822.
doi: 10.1093/nar/gkac1266.

Dynamic states of eIF6 and SDS variants modulate interactions with uL14 of the 60S ribosomal subunit

Affiliations

Dynamic states of eIF6 and SDS variants modulate interactions with uL14 of the 60S ribosomal subunit

Jonah Elliff et al. Nucleic Acids Res. .

Abstract

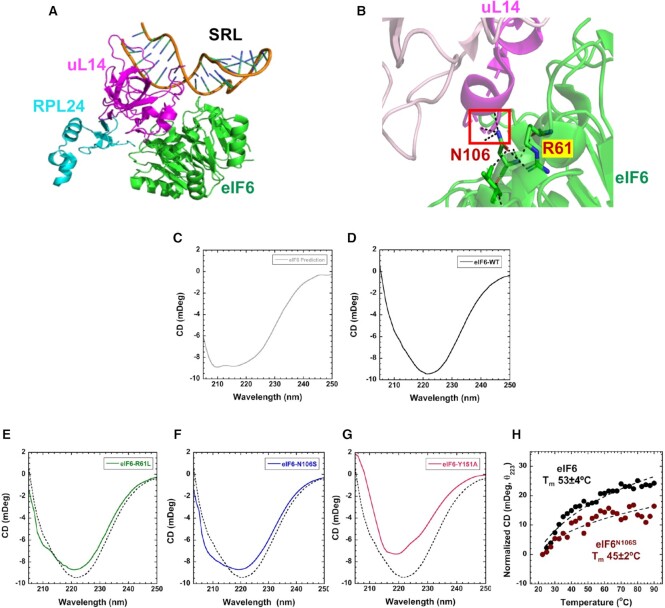
Assembly of ribosomal subunits into active ribosomal complexes is integral to protein synthesis. Release of eIF6 from the 60S ribosomal subunit primes 60S to associate with the 40S subunit and engage in translation. The dynamics of eIF6 interaction with the uL14 (RPL23) interface of 60S and its perturbation by somatic mutations acquired in Shwachman-Diamond Syndrome (SDS) is yet to be clearly understood. Here, by using a modified strategy to obtain high yields of recombinant human eIF6 we have uncovered the critical interface entailing eight key residues in the C-tail of uL14 that is essential for physical interactions between 60S and eIF6. Disruption of the complementary binding interface by conformational changes in eIF6 disease variants provide a mechanism for weakened interactions of variants with the 60S. Hydrogen-deuterium exchange mass spectrometry (HDX-MS) analyses uncovered dynamic configurational rearrangements in eIF6 induced by binding to uL14 and exposed an allosteric interface regulated by the C-tail of eIF6. Disrupting key residues in the eIF6-60S binding interface markedly limits proliferation of cancer cells, which highlights the significance of therapeutically targeting this interface. Establishing these key interfaces thus provide a therapeutic framework for targeting eIF6 in cancers and SDS.


Figures

Figure 1.
Figure 1.
Purification of recombinant human eIF6. (A) Cryo-EM structure of human eIF6 bound to 60S (PBD code: 5AN9). eIF6 (green), uL14 (RPL23) (magenta), RPL24 (blue) and sarcin-ricin loop (SRL) (orange) are highlighted. (B) Representative Coomassie-stained gel shows induction and solubility of full-length (FL) and C-terminal deletion mutant of eIF6 (eIF6-ΔC). (C) Representative Coomassie-stained gel shows eIF6 protein at various stages of protein purification process using affinity chromatography. (D) Western blot analysis of purified eIF6. Recombinantly purified human eIF6 has intact N- and C-termini as protein is detected by anti-His antibody (Santa Cruz Biotechnology) targeted to the N-terminus and anti-eIF6 antibody (Cell Signaling) targeted to the C-terminus. (E) Ribosome profile (top) shows 60S peak and the western blot (below) shows proteins extracted from the 60S fractions. Data is representative of three independent replicates. Lanes 1 and 2 depict two different concentrations of 60S fraction. Blots were stained with Ponceau S to detect 60S ribosomal proteins and probed with anti-eIF6 antibody to determine co-elution of eIF6 with the 60S fraction. (F) Negative EM (magnified) images depict 60S and 40S subunits incubated in low Mg2+ buffer. (G) Negative EM (magnified) images depict the association of 60S and 40S subunits incubated in high Mg2+ buffer. (H) Negative EM (magnified) images depict 60S and 40S subunits incubated with eIF6 in high Mg2+ buffer.
Figure 2.
Figure 2.
Residues in interface 1 contribute differentially to interactions between eIF6 and uL14. (A and B) Structures highlight the location of interface 1 and the contacts between eIF6 and uL14 (RPL23) (PDB code: 6LU8). (C) Analysis of the uL14 sequences (last 21 residues) from various eukarya show a high degree of conservation in the C-terminus of uL14. The terminal 8 residues in uL14 (bold) and the N135 (blue) and S138 (orange) residues are highlighted in the sequence. Sequences were aligned using Clustal Omega. Asterisk (*), colon (:) and dot (.) indicate identical residues, conserved and semi-conserved residues respectively. (D) Surface plasmon resonance experiments were performed by attaching eIF6 onto the CM5 chip and sequentially injecting increasing concentrations of uL14 peptide. Proportional binding and dissociation are observed as a function of peptide concentration. Experiments were performed with peptides carrying various mutations as denoted. The mutations result in loss of interaction of eIF6 to varying degrees, with the most severe loss of binding observed for the S138 to A substitution. (E) In SPR analysis, deletion of the last eight amino acids in the uL14 peptide results in complete loss of eIF6 binding.
Figure 3.
Figure 3.
Terminal 8 residues in the C-tail of uL14 are critical for cellular interactions with eIF6. (A) Western blot shows expression of Myc-tagged uL14 lacking terminal 8 (ΔC-8) residues or 20 (ΔC-20) residues relative to the full-length (FL) uL14 in HCT116 cells. Blots were probed with anti-Myc antibody and Tubulin was used as loading control. Data is representative of three independent experiments. (B) Myc-tagged uL14 or Myc-empty vector control was immunoprecipitated from HCT116 cells. Western blot on the right (lanes 3 and 4) shows that immunoprecipitation with Myc-uL14 captures interactions with endogenous eIF6. Blots were probed with anti-Myc or anti-eIF6 antibodies. Blots on the left (lanes 1 and 2) represent the corresponding input. Tubulin was used as loading control. Data is representative of three independent experiments. (C) Myc-tagged uL14-FL or uL14-ΔC-8 was immunoprecipitated from HCT116 cells. Western blot (lanes 3 and 4) shows that only uL14-FL interacts with endogenous eIF6. Blots on the left (lanes 1 and 2) represent the corresponding input. Blots were probed with anti-Myc or anti-eIF6 antibodies. Tubulin was used as loading control. Data is representative of three independent experiments.
Figure 4.
Figure 4.
HDX-MS reveals dynamic changes in eIF6 upon uL14 binding. (A and B) are ΔHDX data mapped onto the structure of eIF6 from PDB ID 6LU8. ΔHDX denotes the scale of deuterium uptake or loss measured in the absence or presence of the uL14 peptide. The uL14 peptide bound in the structure is shown for reference (black). Numbers 1 to 9 denote the positions of the respective peptides shown in C to K. ΔHDX changes are seen in multiple regions in eIF6 including the C-terminal helix. (C–K) eIF6 peptides identified in HDX-MS analysis are shown. Data were collected as a function of time and deuterium uptake was measured in the absence or presence of the uL14 peptide. Sequence of the individual peptides are noted in each panel. Residues noted in cyan are SDS-patient associated mutations except for residue marked with an asterisk.
Figure 5.
Figure 5.
Secondary structure changes in SDS disease variants. (A) Positions of uL14 (magenta), RPL24 (blue), and the SRL in relation to eIF6. (B) Interactions mediated by N106 and R61 in eIF6 are depicted. (C) Predicted CD spectra from the structure of human eIF6 bound to 60S (PDB code 5AN9). In solution CD measurements of (D) eIF6-WT, (E) eIF6R61L, (F) eIF6N106S and (G) eIF6Y151A compared to eIF6-WT (dotted lines). Data represents three independent replicates. (H) Changes in CD signal at 223 nm were recorded as a function of temperature and yield Tm = 53 ± 4 and 45 ± 2 for eIF6 and eIF6N106S, respectively. Data is representative of three independent replicates.
Figure 6.
Figure 6.
eIF6-Y151A mutation inhibits colonic cancer cell proliferation. (A) Western blot shows eIF6 expression in the isogenic eIF6-WT and eIF6Y151A/Y151Ahomozygous mutant HCT116 cells. Blots were probed with anti-eIF6 and anti-Tubulin (loading control) antibodies. Western blot is representative of three independent experiments. (B) Plot depicts the fold change in cell proliferation at 24, 48 and 72 h relative to 0 h as determined by MTS assay in serum-fed cells. Values represent standard error of the mean of three independent replicates. Asterisks indicate significant differences between eIF6-WT and eIF6-Y151A mutant at respective time points with P = 0.0019 at 24 h, P< 0.0001 at 48 and 72 h as determined by an unpaired two-tailed t test. (C) Plot depicts the fold change in cell proliferation at 24, 48 and 72 h relative to 0 hrs as determined by MTS assay in serum-starved cells. Values indicate standard error of the mean of at least three independent replicates. Asterisks indicate significant differences between eIF6-WT and eIF6-Y151A mutant at respective time points with P = 0.025 at 24 h, P = 0.0012 at 48 h and P< 0.0001 at 72 h as determined by an unpaired two-tailed t test. (D) Bar graph depicts percent change in cell viability of eIF6-Y151A mutant relative to eIF6-WT in serum-fed cells as determined by trypan blue exclusion test.
Figure 7.
Figure 7.
eIF6-N106S mutation disrupts interactions with uL14 and delays colonic cancer cell proliferation. (A) Immunoprecipitation of endogenous eIF6 using anti-eIF6 antibody or control mouse IgG from HCT116 cells. Lanes 2 and 3 in western blot show that immunoprecipitation of eIF6 captures interactions with endogenous uL14. (Note: uL14 and eIF6 migrate very close to the light chain IgG background seen for immunoprecipitation). Lane 1 represents the corresponding input assayed in lanes 2 and 3. Blots were probed with anti-uL14 and anti-eIF6 antibodies. Tubulin was used as loading control. Blots are representative of three independent experiments. (B) Homozygous knock-in of eIF6-N106S mutant was generated using CRISPR-genome editing of HCT116 cells. Western blot represents immunoprecipitation of endogenous eIF6 from eIF6-WT, eIF6-Y151A and eIF6-N106S expressing HCT116 cells. Lanes 4, 5 and 6 in western blot show that both eIF6-N106S and Y151A mutations disrupt binding to uL14. Lanes 1, 2 and 3 represent the input. Blots were probed with anti-uL14 and anti-eIF6 antibodies. Tubulin was used as loading control. Blots are representative of three independent experiments. (C) Plot depicts the fold change in cell proliferation at 24, 48 and 72 h relative to 0 hrs as determined by MTS assay in serum-fed cells. Values were corrected for background absorbance. Values represent standard error of the mean of three independent replicates and triplicate wells were assayed per experiment. Asterisks indicate significant differences between eIF6-WT and eIF6-N106S mutant at respective time points with P = 0.0001 at 48hrs and P< 0.0001 at 72 h as determined by an unpaired two-tailed t test. (D) Caspase3/7 activity was determined using Caspase3/7 glo assay. Bar graph displays data corrected for background absorbance. Error = SEM. Mean of three independent experiments with triplicate wells assayed per experiment were plotted. Asterisks indicate significant differences between eIF6-WT and eIF6-N106S with P = 0.0016 as determined by an unpaired two-tailed t test.
Figure 8.
Figure 8.
Phosphomimetic substitutions induce secondary structure changes in eIF6. (A) Positions of known sites of phosphorylation in eIF6 are shown in red (PDB code 5AN9). (B) In solution CD measurements of eIF6S239E, (C) eIF6S235E, (D) eIF6S243E, (E) eIF6ΔC and (F) eIF6S243A compared to eIF6-WT (dotted lines). Changes in secondary structure are observed for all the phosphomimetic substitutions. eIF6ΔC shows a shift in the CD spectrum due to deletion but maintains the overall profile. eIF6S243A shows minimal changes in secondary structure compared to wild type eIF6. Data represents three independent replicates.
Figure 9.
Figure 9.
Model depicts the influence of interface 1 and 2 of eIF6 on 60S association. The key residues of interaction in interface 1 between eIF6 (PDB code 6LU8) and the terminal 8 amino acids in the C-tail of uL14 and conformational changes in disease variants influence the direct association of eIF6 with 60S and could influence the kinetics of eIF6 release from 60S. Phosphorylation of the C-tail of eIF6 in interface 2 and associated conformational changes of phosphomimetic mutants could also influence eIF6 interactions with 60S.

References

    1. Panse V.G., Johnson A.W.. Maturation of eukaryotic ribosomes: acquisition of functionality. Trends Biochem. Sci. 2010; 35:260–266. - PMC - PubMed
    1. Nerurkar P., Altvater M., Gerhardy S., Schutz S., Fischer U., Weirich C., Panse V.G.. Eukaryotic ribosome assembly and nuclear export. Int. Rev. Cell Mol. Biol. 2015; 319:107–140. - PubMed
    1. Kater L., Thoms M., Barrio-Garcia C., Cheng J., Ismail S., Ahmed Y.L., Bange G., Kressler D., Berninghausen O., Sinning I.et al. .. Visualizing the assembly pathway of nucleolar pre-60S ribosomes. Cell. 2017; 171:1599–1610. - PMC - PubMed
    1. Sulima S.O., Hofman I.J.F., De Keersmaecker K., Dinman J.D.. How ribosomes translate cancer. Cancer Discov. 2017; 7:1069–1087. - PMC - PubMed
    1. Brina D., Miluzio A., Ricciardi S., Biffo S.. eIF6 anti-association activity is required for ribosome biogenesis, translational control and tumor progression. Biochim. Biophys. Acta. 2015; 1849:830–835. - PubMed

Publication types

MeSH terms