. 2023 Feb 22;51(3):1154-1172.
doi: 10.1093/nar/gkac1269.

Phosphorylation of TRF2 promotes its interaction with TIN2 and regulates DNA damage response at telomeres

Affiliations

Phosphorylation of TRF2 promotes its interaction with TIN2 and regulates DNA damage response at telomeres

Radka Storchova et al. Nucleic Acids Res. .

Abstract

Protein phosphatase magnesium-dependent 1 delta (PPM1D) terminates the cell cycle checkpoint by dephosphorylating the tumour suppressor protein p53. By targeting additional substrates at chromatin, PPM1D contributes to the control of DNA damage response and DNA repair. Using proximity biotinylation followed by proteomic analysis, we identified a novel interaction between PPM1D and the shelterin complex that protects telomeric DNA. In addition, confocal microscopy revealed that endogenous PPM1D localises at telomeres. Further, we found that ATR phosphorylated TRF2 at S410 after induction of DNA double strand breaks at telomeres and this modification increased after inhibition or loss of PPM1D. TRF2 phosphorylation stimulated its interaction with TIN2 both in vitro and at telomeres. Conversely, induced expression of PPM1D impaired localisation of TIN2 and TPP1 at telomeres. Finally, recruitment of the DNA repair factor 53BP1 to the telomeric breaks was strongly reduced after inhibition of PPM1D and was rescued by the expression of TRF2-S410A mutant. Our results suggest that TRF2 phosphorylation promotes the association of TIN2 within the shelterin complex and regulates DNA repair at telomeres.


Figures

Figure 1.
Figure 1.
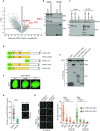
PPM1D interacts with component of the shelterin complex. (A) HEK293 cells stably expressing PPM1D-D314A-BioID2 or empty BioID2 were lysed 5h after treatment with biotin. Biotinylated proteins were pulled down by streptavidin beads and bound proteins were analyzed by MS (n = 3). Volcano plot shows –log P values for proteins enriched or reduced in PPM1D-BioID2 sample. Line delineates the statistical significance (FDR < 0.05). (B) HEK293 cells were lysed 24 h after transfection with plasmids expressing EGFP or EGFP-PPM1D and cell extracts supplemented with bensonase were incubated with GFP trap. Bound proteins were analyzed by immunoblotting. (C) MCF7 cells were transfected with plasmids expressing EGFP, EGFP-TRF1, or EGFP-TRF2. Cell extracts supplemented with bensonase were incubated with GFP trap. Binding of PPM1D was probed by immunoblotting. (D) Scheme of EGFP-tagged PPM1D constructs used in the study. Shown are the catalytic domain in yellow, the basic loop in magenta, the Proline-rich loop in cyan and the NLS in grey. Note that an additional NLS is located within the B loop. (E) HEK293 cells were transfected with plasmids expressing EGFP, the wild type EGFP-PPM1D, EGFP-PPM1D-A380 corresponding to the catalytic domain, or EGFP-PPM1D-CT corresponding to the unstructured C-terminal tail of PPM1D. Cell extracts were incubated with GFP trap and binding of TRF2 was evaluated by immunoblotting. (F) U2OS were transfected with plasmids coding for EGFP-PPM1D variants. Cells were fixed and visualized by wide-field microscopy, the scale bar represents 10 μm. Representative images are shown. (G) MCF7 cells were fixed and probed for interaction of PPM1D with RAP1 by PLA assay. Where indicated, cells were treated with PPM1D inhibitor for 24 h. Mean count on nuclear PLA foci is plotted ± SD, n = 300. Statistical significance was evaluated using Mann–Whitney test, (****P < 0.0001). Representative experiment is shown from two independent repeats. The scale bar in representative images corresponds to 10 μm. (H) MCF7 cells were transfected twice with control siRNA (siNC) or siRNA to TRF2. After 6 days, cells were fixed and probed for interaction of PPM1D with TRF2 by PLA assay using two different pairs of antibodies (rabbit rb-PPM1D/mouse m-TRF2, mouse m-PPM1D/rabbit rb-TRF2). Where indicated, cells were treated with PPM1D inhibitor for 18 h prior fixation. Mean count of the nuclear PLA foci is plotted ± SD, n = 500. Statistical significance was evaluated using Mann–Whitney test (****P < 0.0001). Representative experiment is shown from two independent repeats. The scale bar in representative images corresponds to 10 μm.
Figure 2.
Figure 2.
PPM1D is present at telomeres. (A) U2OS cells were co-transfected with plasmids coding for mCherry-dCas9 and telomeric repeat-targeting sgRNA. After 24h, cells were fixed and stained for PPM1D and TRF2. Images show a single confocal plane processed with deconvolution. The scale bars represent 10 μm or 2 μm, respectively. (B) Quantification of A. Area of the overlapping PPM1D and TRF2 signal was determined using Interaction Factor package in ImageJ. Subsequently, PPM1D signal was randomized for each image. Means of 20 randomizations are plotted together with experimentally observed values (left). Shown is also a fraction of telomeres that contain PPM1D signal (right). Values for 46 cells form two independent experiments are plotted with means ± SD. Statistical significance was evaluated using paired t-test (****P < 0.0001). (C) MCF7 cells were stained for PPM1D and TRF2 and imaged by confocal microscopy. A representative single deconvolved planes are shown. The scale bar represents 10 μm or 2 μm respectively. (D) PPM1D and TRF2 signals from (C) were analyzed as in (B). Values for 51 cells form two independent experiments are plotted with means ± SD. Statistical significance was evaluated using paired t-test (****P < 0.0001). (E) U2OS cells were transfected with plasmids coding for individual EGFP-PPM1D variants. Cells were fixed, stained for TRF2 and imaged by confocal microscopy. A representative single deconvolved planes are shown. The scale bar represents 10 or 2 μm, respectively.
Figure 3.
Figure 3.
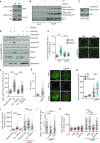
TRF2 is phosphorylated at S410 by ATR and dephosphorylated by PPM1D. (A) HEK293 cells were transfected with the wild-type EGFP-TRF2 (WT) or EGFP-TRF2-S410A (SA) mutant and incubated with PPM1Di for 18 h prior harvesting. Cell extracts were incubated with GFP trap and bound proteins were analyzed by immunoblotting. (B) HEK293 stably expressing EGFP-TRF2 were treated with DMSO, HU (2 mM), PPM1Di (1 μM) or combination of both for 18 h. Cell extracts were incubated with GFP trap and bound proteins were analyzed by immunoblotting. (C) In vitro phosphatase assay. EGFP-TRF2 was isolated from cells by GFP Trap in a buffer containing 1 M NaCl. Beads were washed with a phosphatase buffer and incubated with mock or with the purified His-PPM1D for 20 min at 37°C. Level of TRF2-S410 phosphorylation was analyzed by immunoblotting. (D) HeLa cells stably transfected with inducible TRF2 shRNA were treated with mock or with doxycycline (2 μg/ml) for 7 days and were exposed or not to IR (60 Gy). Where indicated, cells were incubated with PPM1Di for the last 12 h. Nuclear extracts were separated on 4–20% SDS-PAGE gel and analyzed by immunoblotting. (E) U2OS cells after two consecutive transfections of control or TRF2 siRNA were treated or not with PPM1D inhibitor (2 μM, 4 h), fixed and co-stained for TIN2 (telomeric marker) and pTRF2-S410. Plotted is the mean pTRF2-S410 intensity in TIN2-positive foci, each dot represents a single cell (n = 500). Bars indicate mean ± SD, statistical significance was evaluated using Mann–Whitney test (****P < 0.0001). Representative experiment is shown from two independent repeats. The scale bar in representative images corresponds to 10 μm. (F) Parental U2OS, U2OS-PPM1D-KO and U2OS-PPM1D-KO cells stably expressing FLAG-PPM1D were treated or not with PPM1D inhibitor for 24 h. Cells were pre-extracted, fixed and stained for TRF2 and pTRF2-S410. Plotted is the mean pTRF2-S410 intensity in TRF2-positive foci, each dot represents a single cell (n = 300). Bar indicates mean ± SD, statistical significance was evaluated using Mann–Whitney test (****P < 0.0001). Representative experiment is shown from two independent repeats. (G) U2OS cells were transfected with plasmids coding for Cas9-EGFP with or without the telomeric repeat-targeting sgRNA. After 24 h, cells were fixed, hybridized with telomeric FISH probe, and stained for 53BP1 (TIF marker). The scale bar represent 10 μm). Bar indicates mean ± SD, n = 300. (H) Parental U2OS or U2OS-PPM1D-KO cells were transfected with plasmids coding for Cas9-EGFP with or without telomeric repeat-targeting sgRNA. After 24 h, cells were fixed and stained for γH2AX. Mean nuclear intensity is plotted ± SD, n ≥ 208. Statistical significance was evaluated using Mann–Whitney test (****P < 0.0001). Representative experiment is shown from three independent repeats. (I) U2OS cells were transfected as in H and were stained for TRF2 and pTRF2-S410. Plotted is the mean pTRF2-S410 intensity in TRF2-positive foci. Bars indicate mean ± SD, n ≥ 150. Statistical significance was evaluated using Mann–Whitney test (****P < 0.0001). Representative experiment is shown from two independent repeats. (J) U2OS cells were transfected with plasmids coding for Cas9-EGFP with or without the telomeric repeat-targeting sgRNA and were treated with indicated inhibitors for 20 h. After fixation, the intensity of γH2AX signal in TRF2 foci was determined by ScanR microscopy. Bars indicate median ± SD, n ≥ 161. Statistical significance was evaluated using Mann–Whitney test (****P < 0.0001). Representative experiment is shown from two independent repeats. (K) U2OS cells were treated as in (J) and were probed with TRF2 and pTRF2-S410 antibodies. Plotted is the mean pTRF2-S410 intensity in TRF2 foci. Bars indicate median ± SD, n ≥ 249. Statistical significance was evaluated using Mann–Whitney test (****P < 0.0001). Representative experiment is shown from two independent repeats.
Figure 4.
Figure 4.
TRF2 phosphorylation at S410 increases its binding to TIN2. (A) Biotin-Ahx-ISRLVLEEDpSQSTEPSAGLN (TRF2-pS410) and Biotin-Ahx–SRLVLEEDSQSTEPSAGLN (TRF-CTRL) peptides were incubated with nuclear extracts and pulled down by streptavidin beads. Bound proteins were identified by mass spectrometry (n = 3). Plotted are –log P values of proteins enriched or reduced in condition with TRF2-pS410 peptide. The line delineates the statistical significance (FDR < 0.1). (B) Fluorescently-labelled TRF2-pS410 and TRF2-CTRL peptides were titrated with purified TIN2 to a final concentration of 500 nM. Fluorescence anisotropy change was measured and dissociation constant values for unmodified and modified oligopeptides were calculated as described in Methods. (C) HEK293 cells stably expressing EGFP-TRF2 were treated with DMSO or with PPM1D inhibitor for 4 h. EGFP-TRF2 was immunoprecipitated from cell extracts with GFP Trap. Proteins were separated by SDS-PAGE and binding of TIN2 was determined by immunoblotting. Numbers at the bottom indicate the TIN2 signal relative to the total immunoprecipitated TRF2 and normalized to the wild-type TRF2. Representative result from three experiments is shown. (D) TRF2:TIN2 interaction was determined in parental U2OS and U2OS-PPM1D-KO cells by PLA. Mean PLA foci count is plotted ± SD, n = 500. Statistical significance was evaluated using Mann–Whitney test (****P < 0.0001). Representative experiment is shown from two independent repeats. (E) TRF2:TIN2 interaction was determined in U2OS cells treated with DMSO or PPM1Di by PLA. Mean PLA foci count is plotted ± SD, n = 500. Statistical significance was evaluated using Mann–Whitney test (****P < 0.0001). Representative experiment is shown from two independent repeats. (F) U2OS cells were treated or not with PPM1Di for 24 h, pre-extracted, fixed and stained with TRF2 (m-Santa Cruz) and TIN2 (Rb-Novus) antibodies. Mean TIN2 intensity in TRF2 foci is plotted ± SD, n = 300. Statistical significance was evaluated using Mann–Whitney test (****P < 0.0001). Representative experiment is shown from two independent repeats. The scale bar represents 10 μm. (G) Parental U2OS, U2OS-PPM1D-KO and U2OS-PPM1D-KO stably expressing FLAG-PPM1D cells were treated or not with PPM1Di for 24 h. Cells were pre-extracted, fixed and stained for TIN2 and TRF2. Mean TIN2 intensity in TRF2 foci ± SD is plotted, n = 300. Statistical significance was evaluated using Mann–Whitney test (****P < 0.0001). Representative experiment is shown from two independent repeats. (H) Levels of TRF2 and TIN2 were analyzed in whole cell extracts from the parental U2OS and U2OS-PPM1D-KO cells by immunoblotting. Importin staining was used as a loading control. (I) Cells from G were analysed for TRF2 intensity in TRF2 foci. Plotted is mean ± SD, n = 300. (J) U2OS cells were treated or not with PPM1Di for 24 h, pre-extracted, fixed and stained with TRF2 and TPP1 antibodies. Mean TPP1 intensity in TRF2 foci normalized to the mean nuclear TPP1 intensity ± SD is plotted, n > 300. Statistical significance was evaluated using Mann–Whitney test (****P < 0.0001). The scale bars in representative images corresponds to 10 μm and 1 μm respectively. (K) Parental U2OS, U2OS-PPM1D-KO cells and U2OS-PPM1D-KO stably expressing FLAG-PPM1D cells were pre-extracted, fixed and stained for TPP1 and TRF2. Mean TPP1 intensity in TRF2 foci normalized to the mean nuclear TPP1 intensity ± SD is plotted, n > 300. Statistical significance was evaluated using Mann–Whitney test (****P < 0.0001, ***P < 0.001). (L) Chromosome spreads from parental U2OS and U2OS-PPM1D-KO cells were hybridized with TAACCC FISH-probe and imaged by 3D-SIM. Plotted is a fraction of telomeres that formed t-loops. More than 203 telomeres were quantified per condition in each experiment (n = 3). Significance was determined by unpaired t-test.
Figure 5.
Figure 5.
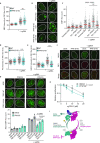
Increased PPM1D activity at telomere impairs shelterin function. (A) U2OS cells were fixed 24 h after transfection with the wild type or A380 mutant of PPM1D, and were stained with TRF2 and TIN2 antibodies. Relative TIN2 intensity in TRF2 foci is plotted ± SD, n ≥ 286. Statistical significance was evaluated using Mann–Whitney test (****P < 0.0001). (B) Plotted is the mean intensity of TRF2 staining in nuclear foci ± SD in cells from K. Statistical significance was evaluated using Mann–Whitney test (*P < 0.05, ****P < 0.0001), n ≥ 286. The scale bar in representative images corresponds to 10 μm. (C) Expression of the catalytic domain of PPM1D was induced or not in RPE1-PPM1D-A380 cells by addition of doxycycline for 10 days and where indicated, PPM1D inhibitor was added to the media 1 h prior fixation. Cells were hybridized with TAACCC FISH-probe, stained for 53BP1, and formation of TIFs was quantified by ScanR microscopy. Plotted is a fraction of cells with more than three TIFs. Mean ± SD is shown, statistical significance was evaluated by unpaired t-test (n = 4). Whole cell lysates were evaluated by immunoblotting, phosphorylation of KAP1 at S824 is a marker of ATM activity, TurboGFP is a marker of PPM1D-A380 expression, the asterisk indicates a non-specific band. Note that PPM1D (Santa Cruz) recognizes only the endogenous full length PPM1D. (D) Quantification of chromosome fusions in RPE1-PPM1D-A380 cells treated or not with doxycycline for 10 days. More than 1246 chromosomes per condition was analyzed in each of the three independent experiments. Mean ± SD is shown, statistical significance was evaluated by paired t-test. The scale bars in the representative images corresponds to 10 or 2 μm, respectively. (E) HeLa cells with tetracycline-inducible knock down of endogenous TRF2 were stably reconstituted with the wild type or S410A mutant GFP-TRF2 and single cell clones were cultured in the absence or presence of doxycycline for 5 days. Whole cell lysates were analyzed by immunoblotting. (F) Cells from E were seeded into 96 wells at 100 cells/well, and cultured for additional 7 days. Relative cell proliferation was determined by resazurin assay. Statistical significance was determined by unpaired t-test, n = 3.
Figure 6.
Figure 6.
Loss of PPM1D affects recruitment of DNA repair factors to telomeric breaks. (A) Parental and U2OS-PPM1D-KO cells were transfected with plasmids coding for Cas9-EGFP with or without the telomere-targeting sgRNA. After 24 h, cells were fixed and stained for NBS1 and TRF2. Plotted is the mean NBS1 signal in TRF2 foci ± SD, n ≥ 171. Statistical significance was evaluated using Mann–Whitney test. Representative experiment is shown from two independent repeats. (B) Parental, U2OS-PPM1D-KO cells and U2OS-PPM1D-KO cells stably expressing FLAG-PPM1D variants were transfected with plasmids coding for Cas9-EGFP with or without the telomere-targeting sgRNA. After 24 h, cells were fixed and stained for 53BP1, the scale bar represents 10 μm. (C) Quantification of (B). Plotted is the mean of 53BP1 foci count ± SD, n ≥ 221. Statistical significance was evaluated using Mann–Whitney test (****P < 0.0001). Representative experiment is shown. (D) Cells were treated as in A and were stained for TRF2 and conjugated ubiquitin using Fk2 antibody. Plotted is the mean FK2 signal in TRF2 foci ± SD, n ≥ 205. Statistical significance was evaluated using Mann–Whitney test (****P < 0.0001). Representative experiment is shown from two independent repeats. (E) Parental and U2OS-PPM1D-KO cells were transfected as in (A), fixed, and stained for RAD51 and TRF2. Plotted is mean RAD51 intensity in TRF2 foci ± SD, n ≥ 161. Statistical significance was evaluated using Mann–Whitney test (****P < 0.0001). Representative experiment is shown from two independent repeats. (F) Representative images for (E), the scale bar represents 10 μm. (G) Parental and U2OS-PPM1D-KO cells were co-transfected with plasmids coding for GFP or GFP-TRF2 variants, and FLAG-Cas9 with or without the telomere-targeting sgRNA, and treated or not with PPM1Di for 24 h. Cells were fixed and stained for 53BP1 and FLAG. Only FLAG and GFP double positive cells were analyzed. Means of three independent experiments are plotted ± SD. Statistical significance was evaluated using unpaired t-test. Representative images are shown, the scale bar represents 10 μm. (H) RPE1-iCut cells were treated overnight with doxycycline and Shield-1 and telomeric DNA damage was induced by transfection of indicated amounts of telomeric sgRNA. Cells were incubated with DMSO or PPM1D inhibitor for 7 days. Relative proliferation was determined by resazurin assay and was normalized to non-treated cells (n = 3). (I) Model of pTRF2-S410 function at telomere. Under basal conditions, non-phosphorylated TRF2 interacts with TIN2 through its TRFH domain and with telomeric DNA through its Myb domain. Induction of DSBs at telomeres leads to recruitment of DNA repair factors including 53BP1. Upon activation of ATR, TRF2 is phosphorylated at S410, which promotes tight binding of TIN2 and protects the broken telomere from recruitment of 53BP1. Loss of PPM1D activity leads to hyper-phosphorylation of TRF2 and prevents recruitment of 53BP1 to the telomeric DSBs, possibly decreasing the risk of the telomere fusion.

References

    1. Hanahan D., Weinberg RobertA.. Hallmarks of cancer: the next generation. Cell. 2011; 144:646–674. - PubMed
    1. Jackson S.P., Bartek J.. The DNA-damage response in human biology and disease. Nature. 2009; 461:1071–1078. - PMC - PubMed
    1. Ciccia A., Elledge S.J.. The DNA damage response: making it safe to play with knives. Mol. Cell. 2010; 40:179–204. - PMC - PubMed
    1. Bartek J., Lukas J.. DNA damage checkpoints: from initiation to recovery or adaptation. Curr. Opin. Cell. Biol. 2007; 19:238–245. - PubMed
    1. Lindqvist A., de Bruijn M., Macurek L., Bras A., Mensinga A., Bruinsma W.. Wip1 confers G2 checkpoint recovery competence by counteracting p53-dependent transcriptional repression. EMBO J. 2009; 28:3196–3206. - PMC - PubMed

Publication types

Substances