. 2023 Mar;10(3):408-425.
doi: 10.1002/acn3.51731. Epub 2023 Jan 18.

Common pathophysiology for ANXA11 disorders caused by aspartate 40 variants

Affiliations

Common pathophysiology for ANXA11 disorders caused by aspartate 40 variants

Daniel Natera-de Benito et al. Ann Clin Transl Neurol. 2023 Mar.

Abstract

Objective: Mutations in ANXA11 cause amyotrophic lateral sclerosis (ALS) and have recently been identified as a cause of multisystem proteinopathy and adult-onset muscular dystrophy. These conditions are adult-onset diseases and result from the substitution of Aspartate 40 (Asp40) for an apolar residue in the intrinsically disordered domain (IDD) of ANXA11. Some ALS-related variants are known to affect ANXA11 IDD; however, the mechanism by which the myopathy occurs is unknown.

Methods: Genetic analysis was performed using WES-trio. For the study of variant pathogenicity, we used recombinant proteins, muscle biopsy, and fibroblasts.

Results: Here we describe an individual with severe and rapidly progressive childhood-onset oculopharyngeal muscular dystrophy who carries a new ANXA11 variant at position Asp40 (p.Asp40Ile; c.118_119delGAinsAT). p.Asp40Ile is predicted to enhance the aggregation propensity of ANXA11 to a greater extent than other changes affecting this residue. In vitro studies using recombinant ANXA11p.Asp40Ile showed abnormal phase separation and confirmed this variant is more aggregation-prone than the ALS-associated variant ANXA11p.Asp40Gly . The study of the patient's fibroblasts revealed defects in stress granules dynamics and clearance, and muscle histopathology showed a myopathic pattern with ANXA11 protein aggregates. Super-resolution imaging showed aggregates expressed as pearl strips or large complex structures in the sarcoplasm, and as layered subsarcolemmal chains probably reflecting ANXA11 multifunctionality.

Interpretation: We demonstrate common pathophysiology for disorders associated with ANXA11 Asp40 allelic variants. Clinical phenotypes may result from different deleterious impacts of variants upon ANXA11 stability against aggregation, and differential muscle or motor neuron dysfunction expressed as a temporal and tissue-specific continuum.


Conflict of interest statement

Xavier Salvatella is a founder and board member of Nuage Therapeutics. The other authors report no disclosures.

Figures

Figure 1
Figure 1
Clinical features of the index case and pattern of muscles weakness. Pictures of the index case show the absence of ptosis at preschool years (A,B); evident ptosis at middle childhood (C) and early adolescence (D) respectively; facial weakness and scapular winging in late adolescence (E,F). Heat map showing the evolution of the pattern of muscle weakness from childhood to late adolescence (G). Radar chart showing the evolution of forced vital capacity and weakness over the years: 16 years in light red and 21 years in dark red (H). The patient gave informed consent to use photographs showing his face. The Medical Research Council (MRC) Scale for Muscle Strength was used to assess muscle strength from Grade 5 (normal; in white) to Grade 0 (no visible contraction; in dark gray).
Figure 2
Figure 2
Whole‐body muscle MRI findings of the index case in adolescence. T1‐weighted MRI sequences of lower limb muscles in middle (A–C) and late (D–F) adolescence showed striking progression of fatty infiltration in all muscles. In middle adolescence the fatty infiltration on thighs (A) was observed on adductor magnus; while on calves (B) was more marked on tibialis anterior, extensor digitorum longus, tibialis posterior, and medial gastrocnemius. Muscles of the pelvis (C) were spared. At his 20 sec (D–F) the fatty infiltration and muscle atrophy have significantly progressed on pelvic musculature (psoas, gluteus) and anterior and posterior compartments of both thighs and legs, but also in erector spinae, paravertebral, latissimus dorsi, serratus, abdominal wall muscles, pectoralis, rotator cuff muscles, and biceps. The popliteus muscle (E) was among the very few relatively spared muscles.
Figure 3
Figure 3
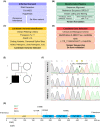
WES‐trio study and bioinformatics pipeline identified a novel disease mutation in ANXA11. (A) Initial process of family recruiting, WES‐trio, and hypothesis development. (B) Bioinformatics pipeline for genetic raw data analysis. (C) Filtering criteria for candidate variants analysis and identification. (D) Identified candidate variant was selected for further analysis. (E) Pedigree of the family. (F) Electropherogram showing the ANXA11 c.118_119delGAinsAT de novo variant in the index case, and the absence in their parents. (G) ANXA11 protein structure and domains showing ANXA11 gene variants associated with ALS (black), adult‐onset inclusion body myopathy (green) and early‐onset oculopharyngeal muscular dystrophy (red). ACMG, American College of Medical Genetics; CADD, Combined Annotation Dependent Depletion; MAF, Minor Allele Frequency; MNV, Multiple Nucleotide Variant; SNV, Single Nucleotide Variant; VUS, Variant of Uncertain Significance.
Figure 4
Figure 4
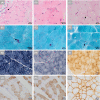
Muscle biopsy findings of the proband in early adolescence. Light microscopy studies. (A–C) The muscular biopsy showed a myopathic pattern with fiber size variability, occasionally internal myonuclei and basophilic fibers (arrow). No necrotic fibers or increased connective tissue was seen (A). Occasional muscle fibers presented dense sarcoplasmic eosinophilic aggregates with variable sizes (B). Scale bar: 20 μm. (D–F) Gomori's modified trichrome. These aggregates with Gomori's modified trichrome staining showed an intense red coloration similar to that observed in the cytoplasmic bodies. Scale bar: 20 μm. Presence of subsarcolemmal and sarcoplasmic rimmed vacuoles (C,F black arrows). These vacuoles were sometimes membrane‐lined (L, immunostaining against dystrophin). Scale bar: 20 μm. (G) NADH, (H) SDH, (I) COX. Presence of isolated angulated fibers (G, white arrow) and staining defects of the moth‐eaten intermyofibrillar pattern were identified (H and I). Scale bar: 50 μm. (J) immunostaining slow myosin, (K) immunostaining fast myosin). Pattern of distribution by types of mosaic fibers was evidenced without grouping by types of fibers. Hypotrophic fibers were of both types. Scale bar: 50 μm.
Figure 5
Figure 5
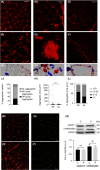
Muscle biopsy shows that ANXA11Asp40Ile aggregates in muscle fibers. (A–C) Immunostaining with α‐ANXA11 revealed three different types of aggregates in muscle fibers. (A) small aggregates located in the sarcoplasm with or without relation to the sarcolemma (SP small aggregates), (B) large aggregates related or not to vacuoles (SP gross aggregates), (C) aggregates located only in the sarcolemma (SL aggregates). Scale bar: 50 μm. (D–F) Representative super‐resolution fluorescence images of ANXA11+ aggregates. (D) pearl strips with varied size and fibrillary‐shaped structures in sarcoplasm, (E) large complex structures in sarcoplasm, (F) fibrillary shapes layered as subsarcolemmal chains. Scale bar: 2 μm. (G–I) Representative confocal super‐resolution 3D images of ANXA11 aggregates showing differences in area and distribution. (J–L) Quantification of aggregates according to their pattern, area and localization. (M–P) Immunostaining with α‐ANXA11, α‐hnRNPA2B1, and DAPI stain in the pediatric healthy control (M,N) and patient (O,P). (Q) Western blot analysis and quantification of the soluble fraction of muscle protein extracts using α‐ANXA11, α‐hnRNPA2B1, and α‐GAPDH [Values are means ± SEM: ANXA11 control (C) vs. patient (P): 0.79 ± 0.07 vs. 0.72 ± 0.04, p: 0.441; hnRNPA2B1 C vs. P: 1.03 ± 0.16 vs. 0.92 ± 0.12, p: 0.598]. Two‐tailed Student's t‐test was used for comparisons against control (ns: not significant). SL, sarcolemma; SP, sarcoplasm.
Figure 6
Figure 6
Ultrastructural findings associated with the ANXA11 variant p.Asp40Ile. Longitudinal section of muscle fibers. (A) Subsarcolemmal electrodense structures in small vacuoles (arrow). Scale bar: 10 μm. (B,C) These osmophilic structures were as well identified inside the sarcomere forming part of the autophagic vacuole with other debris elements. Scale bar: 2 and 1 μm respectively. (D) Normal mitochondria and unspecific lipid droplets are identified in the periphery. Isolated nerve fillets with similar electrodense structures were observed (arrow). Scale bar: 5 μm.
Figure 7
Figure 7
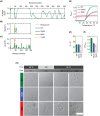
ANXA11Asp40Ile has a higher aggregation propensity and does not undergo in vitro LLPS. (A–C) In silico sequence analysis of four different ANXA11 constructs (WT, Gly40, Ile40, and Tyr40). (A) Disorder size prediction of the full‐length protein using the PONDR VL‐XT algorithm. (B) Percentage helicity prediction of the intrinsically disordered domain (IDD) according to Agadir. (C) Aggregation propensity of the IDD calculated using Aggrescan (a4vAHS). The vertical gray line indicates the mutated amino acid position (Asp40 in WT). (D–F) In vitro LLPS separation study of the three ANXA11 constructs (WT, Gly40, and Ile40). All samples contain 15 μM of protein in 20 mM HEPES buffer, with 500 mM NaCl, 1 mM TCEP, 0.05% NaN3 at pH 7.4. (D) Apparent absorbance measurements at 350 nm in function of temperature as the average and standard deviation of three independent measurements for each construct. (E) Calculated cloud temperatures (Tc/°C). (F) Increase in apparent absorbance upon LLPS. For E and F, values could not be calculated for the Ile40 mutant because it did not undergo LLPS in the tested conditions. (G) Differential interference contrast microscopy images of in vitro LLPS of WT, Gly40, and Ile40 upon a temperature (Temp) cycle from 35°C to ice and back to 35°C. The time (min) since sample preparation is also indicated at the top. Scale bar: 20 μm.
Figure 8
Figure 8
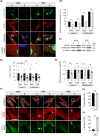
ANXA11Asp40Ile and hnRNPA2B1 levels are decreased in patient fibroblasts and affect the stress granule dynamics impairing the disassembly process. (A) Immunostaining of endogenous ANXA11 (red) and hnRNPA2B1 (green) in control and patient fibroblasts in basal and after stress (0.5 mM sodium arsenite for 1 h) conditions. Nuclei were stained with DAPI. Scale bar: 25 μm. White arrows indicate the stress granules SGs. (B) Quantification of endogenous ANXA11 and hnRNPA2B1 fluorescence intensity (50 cells per condition were quantified for signal intensity from two independent experiments). (C,D) Western blot analysis (n = 6) and quantification of ANXA11 and hnRNPA2B1 using α‐Tubulin for data normalization in control and patient fibroblasts [Baseline: ANXA11 mean ± SEM, control (C) vs. patient (P), 1.0 ± 0.24 vs. 0.55 ± 0.05 p: 0.065; Stress: 1.0 ± 0.31 vs. 0.42 ± 0.05 p: 0.164; hnRNPA2B1 C vs. P basal 1.0 ± 0.21 vs. 0.49 ± 0.06 p: 0.023, stress 1.0 ± 0.28 vs. 0.51 ± 0.07 p: 0.041]. (E) ANXA11 and HNRNPA2B1 mRNA quantification by RT‐qPCR to GAPDH in basal and stress conditions. The samples are triplicates from three independent experiments. (F) Fluorescence images of endogenous ANXA11 (red) and G3BP1 (green) of control and patient fibroblasts in basal, stress, and recovery conditions. Nuclei were stained with DAPI. White arrows show SGs. (G) Percentage of assembled positive ANXA11+ and G3BP1+ SGs in control and patient fibroblasts. (H) Percentage of remaining positive ANXA11+ and G3BP1+ SGs after recovery in control and patient fibroblasts (100 cells per condition were quantified for SGs quantification from three independent experiments). BAS, Basal; REC, Recovery; STR, Stress. Values are means ± SEM. Mann–Whitney test was used for comparisons against control in each condition (*p < 0.05, ***p < 0.001, ns: not significant). Scale bars: 25 μm.

References

    1. Liemann S, Huber R. Three‐dimensional structure of annexins. Cell Mol Life Sci. 1997;53:516‐521. - PMC - PubMed
    1. Moss SE, Morgan RO. The annexins. Genome Biol. 2004;5:219. - PMC - PubMed
    1. Gerke V, Creutz CE, Moss SE. Annexins: linking Ca2+ signalling to membrane dynamics. Nat Rev Mol Cell Biol. 2005;6:449‐461. - PubMed
    1. Wang J, Guo C, Liu S, et al. Annexin A11 in disease. Clin Chim Acta. 2014;431:164‐168. - PubMed
    1. Liao YC, Fernandopulle MS, Wang G, et al. RNA granules hitchhike on lysosomes for long‐distance transport, using annexin A11 as a molecular tether. Cell. 2019;179:147‐164. - PMC - PubMed

Publication types