. 2023 Feb 14;11(1):e0395022.
doi: 10.1128/spectrum.03950-22. Epub 2023 Jan 18.

Identification of a Rho-Dependent Termination Site In Vivo Using Synthetic Small RNA

Affiliations

Identification of a Rho-Dependent Termination Site In Vivo Using Synthetic Small RNA

Xun Wang et al. Microbiol Spectr. .

Abstract

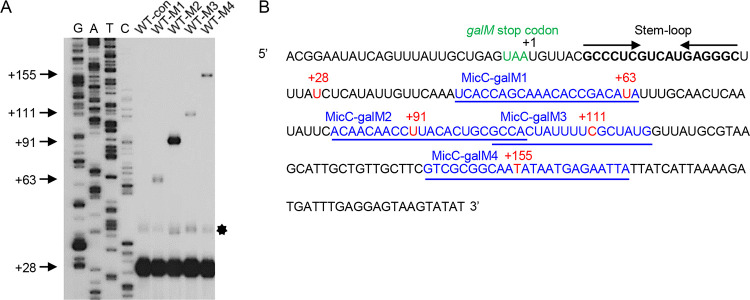
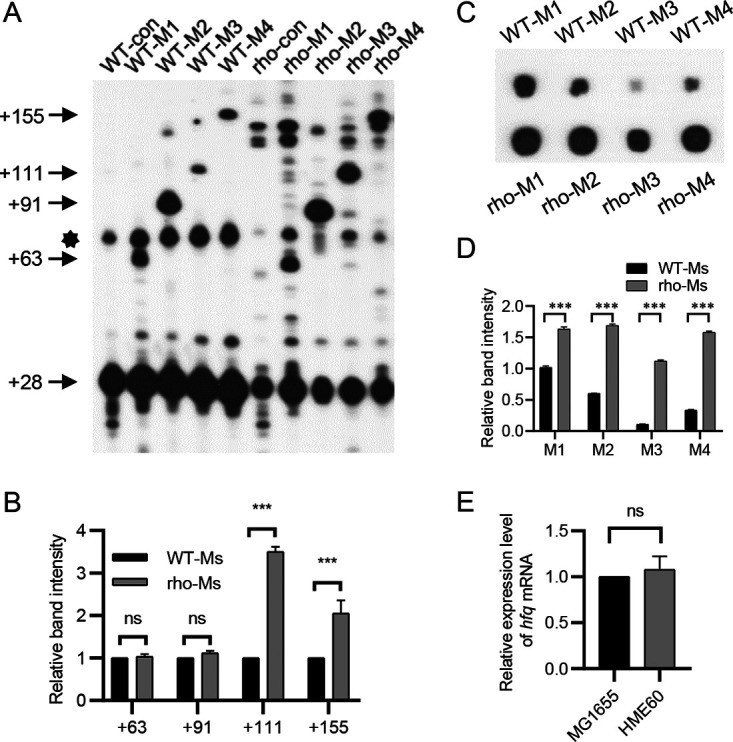
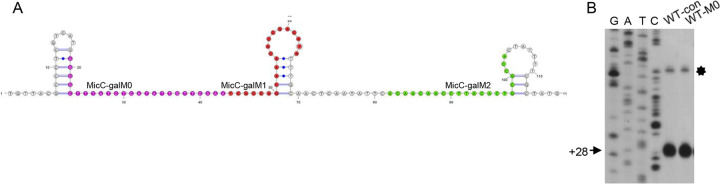
Rho promotes Rho-dependent termination (RDT) at the Rho-dependent terminator, producing a variable-length region without secondary structure at the 3' end of mRNA. Determining the exact RDT site in vivo is challenging, because the 3' end of mRNA is rapidly removed after RDT by 3'-to-5' exonuclease processing. Here, we applied synthetic small RNA (sysRNA) to identify the RDT region in vivo by exploiting its complementary base-pairing ability to target mRNA. Through the combined analyses of rapid amplification of cDNA 3' ends, primer extension, and capillary electrophoresis, we could precisely map and quantify mRNA 3' ends. We found that complementary double-stranded RNA (dsRNA) formed between sysRNA and mRNA was efficiently cleaved by RNase III in the middle of the dsRNA region. The formation of dsRNA appeared to protect the cleaved RNA 3' ends from rapid degradation by 3'-to-5' exonuclease, thereby stabilizing the mRNA 3' end. We further verified that the signal intensity at the 3' end was positively correlated with the amount of mRNA. By constructing a series of sysRNAs with close target sites and comparing the difference in signal intensity at the 3' end of wild-type and Rho-impaired strains, we finally identified a region of increased mRNA expression within the 21-bp range, which was determined as the RDT region. Our results demonstrated the ability to use sysRNA as a novel tool to identify RDT regions in vivo and expand the range of applications of sysRNA. IMPORTANCE sysRNA, which was formerly widely employed, has steadily lost popularity as more novel techniques for suppressing gene expression come into existence because of issues such as unstable inhibition effect and low inhibition efficiency. However, it remains an interesting topic as a regulatory tool due to its ease of design and low metabolic burden on cells. Here, for the first time, we discovered a new method to identify RDT regions in vivo using sysRNA. This new feature is important because since the discovery of the Rho protein in 1969, specific identification of RDT sites in vivo has been difficult due to the rapid processing of RNA 3' ends by exonucleases, and sysRNA might provide a new approach to address this challenge.

Keywords: RNA processing; RNase III; Rho-dependent termination; exonuclease; synthetic sRNA.


Conflict of interest statement

The authors declare no conflict of interest.

Figures

FIG 1
FIG 1
Schematic representation of overall design principles and sysRNA construction. (A) Schematic representation of the binding of four sysRNAs to pre-galETKM mRNA. (B) sysRNA was expressed under the control of the lac promoter. The coding region of the target binding sequence was inserted upstream of the coding region of the MicC scaffold. (C) In wild-type strains, RDT produces abundant terminated transcripts that are further processed by exonuclease to generate a stable 3′ end in the stem-loop structure, whereas the number of read-through transcripts is increased in Rho-impaired strains. Green dotted lines represent sequences that have been digested by exonucleases. Green solid lines represent read-through sequences.
FIG 2
FIG 2
sysRNAs enabled visualization of the 3′ fragment of pre-galETKM and beyond. (A) 3′ RACE and primer extension assays of gal transcripts generated in vivo in WT-con and WT-Ms strains. Numbers on the left indicate the positions of the 3′ ends of the gal mRNA generated from sysRNA binding (the first base downstream of the galM translation termination site is set as +1). The DNA sequencing ladders in the four lanes are marked G, A, T and C. The bands indicated by the star are the +28 3′ end bands for which persistence of residual RNA secondary structures resulted in slower migration. (B) Sequence downstream of the galM stop codon. The mRNA sequences to which each sysRNA can base pair are indicated in blue and underlined. The 3′ ends of the RNA generated by synthetic sRNAs are shown in red. The galM stop codon is in green.
FIG 3
FIG 3
3′ RACE and primer extension assays of gal transcripts in IIIcon-con, IIIcon-Ms, III-con, and III-Ms strains. The numbers on the left indicate the positions of the 3′ ends of gal mRNA generated from sysRNA binding. The bands indicated by the star are the +28 3′ end bands for which persistence of residual RNA secondary structure resulted in slower migration.
FIG 4
FIG 4
Factors affecting the 3′ end generation. (A) Expression of MicC-galM2 in WT-M2 strain at 0, 2, 4, and 8 min after IPTG induction. (B) Quantification of signal intensity of each band using ImageJ. The relative expression of MicC-galM2 after induction was normalized with the internal control, 16S rRNA, and is presented as a histogram. (C) Expression of the +91 3′ end in WT-M2 strain at 0, 2, 4, and 8 min after IPTG induction. (D) Quantification of signal intensity of each band using ImageJ. The relative expression of the +91 3′ end after induction is presented as a histogram. (E) Graph showing galM mRNA with primers (double arrow) amplifying the region upstream of the galM translation stop codon. The RNA stem-loop structure indicates a Rho-independent terminator. (F) The relative expression level of galM in the WT-M2 strain grown in LB after galactose induction was measured by RT-qPCR. (G) Expression of the +91 3′ end in the WT-M2 strain at 0, 2, 4, and 8 min after galactose induction. (H) The signal intensity of each band was quantified using ImageJ. The relative expression of the +91 3′ end after induction is presented as a histogram. (I) 3′ RACE and primer extension assays of gal mRNAs in the WT-con, WT-Ms, hfq-con, and hfq-Ms strains. The numbers on the left represent the positions of the 3′ ends. The bands indicated by the star are the +28 3′ end bands for which the persistence of residual RNA secondary structure resulted in slower migration. (J) Relative expression levels of galM in WT and Δhfq strains grown in LB after galactose induction were measured by RT-qPCR. Data are means and standard deviations (SD) for 3 biological replicates. ns, not significant (P > 0.05); *, 0.01 < P < 0.05; ***, P < 0.001.
FIG 5
FIG 5
Determination of the galM RDT region using WT-Ms and rho-Ms strains. (A) 3′ RACE and primer extension assays of gal transcripts in the WT-con, WT-Ms, rho-con, and rho-Ms strains. The bands indicated by the star are the +28 bands for which the persistence of residual RNA secondary structure resulted in slower migration. (B) Quantification of signal intensity of the 3′ ends at positions +63, +91, +111, and +155 in panel A using ImageJ. The relative density of each band is presented as a histogram. (C) Expression of four sysRNAs in the WT-Ms and rho-Ms strains. (D) Quantification of signal intensity of each band using ImageJ. Relative band intensities were normalized to that of the internal control, 16S rRNA, and are presented in histograms. (E) Relative expression levels of hfq mRNA measured by RT-qPCR in strains MG1655 and HME60. Data are means and SD for 3 biological replicates. ns, not significant (P > 0.05); ***, P < 0.001.
FIG 6
FIG 6
Determination of the galM RDT region using Gal-Ms and RDTo-Ms strains. (A) Sequence downstream of the galM stop codon in the pRDTo plasmid. Lowercase “g” represents mutated cytosines. Those cytosines in the pGal plasmid were mutated to guanines. (B) 3′ RACE and primer extension assays of gal transcripts in the Gal-Ms and RDTo-Ms strains. The bands indicated by the star are the +28 bands for which the persistence of residual RNA secondary structure resulted in slower migration. Green arrows indicate new 3′ ends that may arise from changes in secondary structure due to changes in the RNA sequence. (C) The signal intensities of +111 and +155 3′ ends in panel B were quantified using ImageJ. The relative density of each band is presented as a histogram. (D) Expression of MicC-galM3 and MicC-galM4 in Gal-M3, Gal-M4, RDTo-M3 and RDTo-M4 strains. (E) The signal intensity of each dot in panel D was quantified using ImageJ. Relative band intensities were normalized with the internal control, 16S rRNA, and are presented in a histogram. (F) Relative expression levels of hfq mRNA measured in the Δgal-pGal and Δgal-pRDTo strains. Data are means and SD for 3 biological replicates. ns, not significant (P > 0.05); **, 0.001 < P < 0.01; ***, P < 0.001.
FIG 7
FIG 7
mRNA secondary-structure analysis and 3′ end visualization. (A) Secondary-structure prediction of galM mRNA extending from +1 to +117 at the 3′ end. Strong stem-loop structure in the Rho-independent terminator of galM and two weak stem-loop structures in the C-rich region. Target-binding sequence for MicC-galM0 (purple), MicC-galM1 (red), and MicC-galM2 (green). (B) 3′ RACE and primer extension assays for gal transcripts in the WT-con and WT-M0 strains. The DNA sequencing ladders in the four lanes are labeled G, A, T, and C. The bands indicated by the star are the +28 bands for which the persistence of residual RNA secondary structure resulted in slower migration.

References

    1. Ray-Soni A, Bellecourt MJ, Landick R. 2016. Mechanisms of bacterial transcription termination: all good things must end. Annu Rev Biochem 85:319–347. doi:10.1146/annurev-biochem-060815-014844. - DOI - PubMed
    1. Gusarov I, Nudler E. 1999. The mechanism of intrinsic transcription termination. Mol Cell 3:495–504. doi:10.1016/s1097-2765(00)80477-3. - DOI - PubMed
    1. Epshtein V, Cardinale CJ, Ruckenstein AE, Borukhov S, Nudler E. 2007. An allosteric path to transcription termination. Mol Cell 28:991–1001. doi:10.1016/j.molcel.2007.10.011. - DOI - PubMed
    1. Yarnell WS, Roberts JW. 1999. Mechanism of intrinsic transcription termination and antitermination. Science 284:611–615. doi:10.1126/science.284.5414.611. - DOI - PubMed
    1. Lesnik EA, Sampath R, Levene HB, Henderson TJ, McNeil JA, Ecker DJ. 2001. Prediction of rho-independent transcriptional terminators in Escherichia coli. Nucleic Acids Res 29:3583–3594. doi:10.1093/nar/29.17.3583. - DOI - PMC - PubMed

Publication types

LinkOut - more resources