A progeroid syndrome caused by a deep intronic variant in TAPT1 is revealed by RNA/SI-NET sequencing
- PMID: 36652330
- PMCID: PMC9906387
- DOI: 10.15252/emmm.202216478
A progeroid syndrome caused by a deep intronic variant in TAPT1 is revealed by RNA/SI-NET sequencing
Abstract
Exome sequencing has introduced a paradigm shift for the identification of germline variations responsible for Mendelian diseases. However, non-coding regions, which make up 98% of the genome, cannot be captured. The lack of functional annotation for intronic and intergenic variants makes RNA-seq a powerful companion diagnostic. Here, we illustrate this point by identifying six patients with a recessive Osteogenesis Imperfecta (OI) and neonatal progeria syndrome. By integrating homozygosity mapping and RNA-seq, we delineated a deep intronic TAPT1 mutation (c.1237-52 G>A) that segregated with the disease. Using SI-NET-seq, we document that TAPT1's nascent transcription was not affected in patients' fibroblasts, indicating instead that this variant leads to an alteration of pre-mRNA processing. Predicted to serve as an alternative splicing branchpoint, this mutation enhances TAPT1 exon 12 skipping, creating a protein-null allele. Additionally, our study reveals dysregulation of pathways involved in collagen and extracellular matrix biology in disease-relevant cells. Overall, our work highlights the power of transcriptomic approaches in deciphering the repercussions of non-coding variants, as well as in illuminating the molecular mechanisms of human diseases.
Keywords: TAPT1; Osteogenesis Imperfecta; RNA-seq; SI-NET-seq; non-coding variant.
© 2023 The Authors. Published under the terms of the CC BY 4.0 license.
Figures
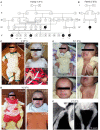
- A, B
Pedigrees of two distantly related consanguineous families from Jordan, showing an autosomal recessive mode of inheritance of the disease. Black symbols and crossed symbols represent affected and deceased individuals, respectively.
- C–E
Pictures of investigated patients showing severe bone deformities and fractures, neonatal progeria, wrinkled skin, prominent forehead and pectus excavatum.
- F
Radiographs of affected V.1 (F1) showing several deficits in the bones including deformity, dysplasia, spared joints and evidence of previous fractures. Severe calcification defects can also be noticed, involving premature atherosclerotic vascular calcification, periarticular soft tissue calcification and irregular calcification of carpal bones.

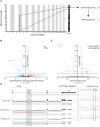
Schematic representation of the shared IBD region between both Jordanian families, located on Chromosome 4 (4p16.1–p15.31) with a size of ~ 12 cM. Although WES analysis did not reveal any mutations in the coding sequences located in the IBD region, RNA‐seq analysis helped us to identify the disease causative gene from this locus.
Volcano plot showing differentially expressed genes between WT (WT1 and WT2) and patient (V.1 (F1), V.5 (F1)) primary dermal fibroblasts. The vertical axis (y‐axis) shows the −log10 P‐value, whereas the horizontal axis (x‐axis) displays the log2 fold change value. The red dots represent the upregulated transcripts; the blue dots represent the downregulated transcripts. A total of 172 genes were found significantly dysregulated. TAPT1, a gene located in the IBD region, appeared among the most significantly downregulated genes in the patients.
Plot showing the alternative splicing analysis results from WT (WT1 and WT2) and patient (V.1 (F1), V.5 (F1)) primary dermal fibroblasts. The vertical axis (y‐axis) shows the −log10 FDR (False Discovery Rate), whereas the horizontal axis (x‐axis) represents the exon inclusion level (value ranging from −1 to 1). The red dots represent transcripts with exon inclusion events; the blue dots represent transcripts affected by exon skipping. A total of 63 aberrantly spliced genes were found in the patient cells, being TAPT1 the most significant exon skipping event.
(Left) Schematic representation showing the complete loss of exon 12 from TAPT1 transcript in patient cells, as defined by our splicing analysis data. (Right) Chromatogram showing the novel intronic mutation (c.1237‐52 G>A) we found entirely segregating with the disease in all available family members. For display purposes, results from the targeted Sanger sequencing in WT, IV.3 (F1) and V.5 (F1) individuals are shown. The mutation is present in heterozygosis in IV.3 (F1) (unaffected mother) and in homozygosis in V.5 (F1) (affected patient).
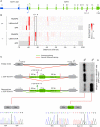
Schematic representation of TAPT1 and TAPT1‐AS1, indicating the causative intronic mutation (c.1237‐52 G>A). The transcription start sites and the direction of transcription are indicated by arrows. Scale bar represents 2 kb.
Diagram showing the branchpoint scores for the target c.1237‐52 position and flanking nucleotides in TAPT1 intron 11 in both WT (+/+) and patient cells (−/−), as obtained from the RNABPS (Nazari et al, 2018), LaBranchoR (Paggi & Bejerano, 2018) and BPP (Zhang et al, 2017a) softwares. High branchpoint scores were predicted for the G>A transition in the patient cells using the RNABPS and LaBranchoR methods. The x‐axis represents the nucleotide distance to the 3′ splice site (3´SS).
Schematic illustration of minigene constructs and RT–PCR analysis of splicing products. The pSPL3 vector contains SDv and SAv exons (gray boxes) and functional intron (black line) in its backbone. SDv: splice donor vector; SAv: splice acceptor vector. TAPT1 c.1237‐52 G>A mutant fragments containing 200 bps of intron 11, exon 12 and 500 bps of intron 12 (green) were cloned into the EcoRI and BamH1 cloning sites (pink) of the pSPL3 vector. Using site directed mutagenesis, the TAPT1 c.1237‐52 G>A mutant construct was rescued into c.1237‐52 A>G (Purple arrow: c.1237‐52 G>A; green arrow: rescued into c.1237‐52 A>G). Green and red lines show canonical and internal/aberrant splicing, respectively. Two TAPT1 minigene constructs and an empty pSPL3 vector were transfected into HEK293T cells for 24 h. Following RNA extraction and cDNA synthesis, RT–PCR was done using vector specific primers (F: SD6 forward; R: SA2 reverse). The 263 bp PCR product in the empty vector showed internal splicing between SDv and SA2 exons. In c.1237‐52 G>A mutant minigene construct, the majority of splicing products had a size of 263 bp due to the aberrant exon 12 skipping while in the rescued construct, most of the transcripts had the expected size of 340 bps. Direct Sanger sequencing confirmed the identity of the normal and exon‐12 skipped products.
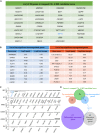
List of the 39 candidate genes located in the mapped Chr. 4 IBD locus.
Lists of the top 10 significantly downregulated (left, blue) and upregulated (right, red) genes obtained from our RNA‐seq differential expression analysis.
Expression changes (x‐axis, log2FC) for genes with at least one alternative splicing event (skipped exon (SE), retained exon (RE), mutually exclusive exon (MXE), alternative 3′ or 5′ splice site (A3SS and A5SS) and retained intron (RI)).
(Top) Venn diagram displaying overlapping genes between the Chr. 4 IBD candidate locus, and the top 10 upregulated and downregulated genes from our RNA‐seq data analysis. (Bottom) Venn diagram showing the overlapping genes between the differentially expressed set and the alternative spliced set from our RNA‐seq data analysis. TAPT1 appears as the only overlapping gene in both diagrams.

- A
RT–PCR analysis of endogenous TAPT1 splicing products. To check exon 12 skipping, RT–PCR was performed using primers targeting exon 10 and exon 13 in one WT (WT1), one heterozygous carrier (IV.3 (F1)) and 3 patients (V.1 (F1), V.5 (F1), IV.1 (F2)). The data showed the presence of normal (234 bps) and exon 12‐skipped (157 bps) products in all tested samples. However, the truncated transcripts constitute the majority of products in the patient cells. Interestingly, the intensity of 2 bands is rather same in the heterozygous (IV.3 (F1)) sample. Sanger sequencing confirmed the accuracy of RT–PCR products.
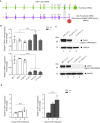
Schematic representation showing that the complete loss of exon 12 in TAPT1 results in a premature stop codon, which targets the transcript for nonsense‐mediated mRNA decay.
qPCR results using specific primers for TAPT1 and TAPT1‐AS1 in 3 WT (WT1, WT2, V.2 (F1)) and 3 affected (V.1 (F1), V.5 (F1), IV.1 (F2)) primary fibroblasts. TAPT1 mRNA is significantly reduced in all patients compared with WTs, whereas TAPT1‐AS1 transcript levels are unaffected. Fold change relative to V.2 (F1) is plotted as mean ± SD. Asterisks indicate conventional statistical significance (Student's t‐test; n.s. P‐value > 0.05, ****P‐value < 0.0001).
Western blot analysis of endogenous TAPT1 protein (~ 60 kDa) using whole protein extracts from primary dermal fibroblasts from WT (WT1 and WT2), heterozygous (IV.3 (F1)) and homozygous (V.1 (F1), V.5 (F1) and IV.1 (F2)) individuals and two different commercial antibodies (top: Sigma, HPA042567; bottom: Sigma, HPA048658). Results show a complete absence of TAPT1 protein in patient samples. GAPDH was used as a loading control.
qPCR analysis of TAPT1 expression in 3 WT (WT1, WT2, WT3) and 3 affected (V.1 (F1), V.5 (F1), IV.1 (F2)) primary fibroblasts treated with cycloheximide (CHX). CHX was used to block nonsense mediated decay (NMD). Our results showed a time dependent increase in the level of TAPT1 transcripts in all 3 patient cells while TAPT1 RNA level remained constant in the WT cells. For each graph, fold change relative to non‐treated condition is plotted as mean ± SD. Asterisks indicate conventional statistical significance (Student's t‐test; n.s. P‐value > 0.05, ****P‐value < 0.0001).

- A
qPCR analysis of c‐MYC and TAPT1 expression in WT1 and V.1 (F1) primary fibroblasts treated with actinomycin D (ActD) in different time points. ActD was used to check mRNA stability by inhibiting transcription. c‐MYC was considered as positive control with a short half‐life. The results showed that c‐MYC mRNA level dramatically decreased after 1.5 h treatment (~ x2), whereas the TAPT1 transcript level is unchanged. qPCR assays involved three technical replicates per sample per time point. For each graph, fold change relative to non‐treated condition is plotted as mean ± SD. Asterisks indicate conventional statistical significance (Student's t‐test; n.s. P‐value > 0.05, ****P‐value < 0.0001).
- B
Knockdown of TAPT1‐AS1 transcript using two different GapmeRs (1 and 2) in WT (WT1) and patient (IV.1 (F2)) primary dermal fibroblasts. A non‐targeted (NT) GapmeR was used as control. qPCR analysis of TAPT1‐AS1 (top) and TAPT1 (bottom) transcript levels in the GapmeR‐transfected cells. Results show the successful knockdown of TAPT1‐AS1 by both GapmeRs 1 and 2 compared with the control NT GapmeR. However, TAPT1 mRNA levels are unaltered in both WT and patient cells. Fold change relative to WT1‐Control NT GapmeR is plotted as mean ± SD of three technical replicates. Asterisks indicate conventional statistical significance (Student's t‐test; n.s. P‐value > 0.05, **P‐value < 0.01, ***P‐value < 0.001).
- C
Western blotting of protein extracts from the GapmeR‐transfected cells, probing for TAPT1 (Sigma, HPA042567 antibody). Data shows that TAPT1 protein levels are unaffected by the knockdown of TAPT1‐AS1. GAPDH was used as loading control.
- D, E
Immunofluorescence staining using two different TAPT1 commercial antibodies (A: Sigma, HPA042567; B: Sigma, HPA048658) in WT1 and IV.1 (F2) primary dermal fibroblasts. Similar fluorescent signal was detected in WT and TAPT1‐null cells in both cases. TAPT1 commercial antibodies are unsuitable for immunofluorescence experiments. Scale bar represents 10 μm.
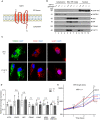
TAPT1 predicted topology: a membrane‐spanning protein consisting of 5 transmembrane helices (Uniprot database).
Western blot analyses for TAPT1 (~ 60 kDa) using cytosolic, Mito/ER/Golgi and nuclear protein extracts from primary dermal fibroblasts of two WTs (WT1 and WT2) and two patients (V.5 (F1) and IV.1 (F2)). TAPT1 protein is highly enriched in the Mito/ER/Golgi fraction, and to a lower extent in the nuclear fraction. GAPDH, TGN46 and BiP served as a cytosolic, Golgi network and ER markers, respectively. Adenylate Kinase (AK2) was used as a mitochondrial marker. Laminin A/C was used as a nuclear marker.
Immunofluorescence staining of mitochondria using anti‐TOM20 (green), ER using anti‐CANX (red) and Golgi using anti‐GLG1 (red) in primary dermal fibroblasts from WT1 and V.5 (F1). Similar staining patterns are observed with the three antibodies in both cell lines. Scale bar represents 10 μm.
qPCR analysis of a panel of canonical ER stress markers shows no significant differences in 3 patients (−/−) (V.I (F1), V.5 (F1) and IV.1 (F2)) primary dermal fibroblasts compared with WTs (+/+) (WT1, WT2 and WT3) cells. Fold change relative to WT is plotted as mean ± SD. Statistical significance was tested by Student's t‐test (n.s. P‐value > 0.05).
CMV cell infection assay on 2 patient (V.1 (F1) and V.5 (F1)) and 3 WT (WT1, WT4 and WT5) primary dermal fibroblast cell lines, using β‐galactosidase activity as a readout. MRC5 cell line was used as a positive control. All of the cells were infected by the HCMV strain RC256 at a MOI = 0.1. Data are shown as mean ± SD of three technical replicates. Statistical significance was tested by Student's t‐test (n.s. P‐value > 0.05).

Volcano plot showing differentially expressed genes as determined by RNA‐seq in patient primary dermal fibroblasts (V.1 (F1), V.5 (F1)) compared with WT (WT1 and WT2) cells. The y‐axis shows the −log10 P‐value, whereas the x‐axis displays the log2 fold change value. The red dots represent 75 significantly upregulated genes, and the blue dots represent 97 significantly downregulated genes.
qPCR validation test for 3 top dysregulated genes (RARRES2, ZIC1, and ZIC4) detected by RNA‐seq. The analysis was performed on RNA samples independent from those sent for RNA‐seq for 2 WTs (WT1 and WT2) and 2 patients (V.5 (F1) and IV.1 (F2)). Fold change relative to WT1 is plotted as mean ± SD of three technical replicates. Asterisks indicate statistical significance (Student's t‐test; ***P‐value < 0.001, ****P‐value < 0.0001).
Volcano plot showing genes with an altered occupancy of transcriptionally engaged Pol II in patients (V.1 (F1) and V.5 (F1)) compared with WT (WT1 and WT2) primary fibroblast cells using SI‐NET‐seq. The y‐axis shows the −Log10 P‐value, whereas the x‐axis indicates the log2 fold change value for the Pol II occupancy. The Pol II density is increased in 222 genes (red dots), and decreased in 95 genes (blue dots). The yellow dot represents TAPT1.
Bubble plot showing enrichment of collagen and extracellular matrix (ECM) pathways from the integrated reactome pathway analysis (Jassal et al, 2020) of the SI‐NET‐seq (light blue circles) and RNA‐seq (dark blue circles) data. Enriched pathways are indicated on the y‐axis, and the corresponding P‐values are shown on the x‐axis. The size of the circles represents the number of altered genes from each pathway.
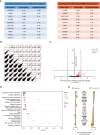
Lists of the top 10 genes with significantly decreased (left, blue) or increased (right, red) RNA Pol II occupancy from our SI‐NET‐seq analysis.
High Pearson's correlation coefficients (r ≥ 0.96) between replicates of Pol II gene occupancy indicate the reproducibility of SI‐NET‐seq measurements. Asterisks indicate conventional statistical significance (Student's t‐test; ***P‐value < 0.001).
Volcano plot showing genes with an altered occupancy of transcriptionally engaged Pol II in the heterozygous parent (IV.3 (F1)) compared with WT (WT1 and WT2) primary fibroblast cells. The y‐axis shows the −log10 P‐value, whereas the x‐axis indicates the log2 fold change value for the Pol II occupancy. The Pol II density is increased in 149 genes (red dots) and decreased in 21 genes (blue dots). The yellow dot represents TAPT1.
Bubble plot showing enrichment of collagen and extracellular matrix (ECM) pathways from the integrated Reactome pathway analysis from patients (red circles) and heterozygous parent (green circles) SI‐NET‐seq data. Enriched pathways are indicated on the y‐axis, and the corresponding P‐values are shown on the x‐axis. The size of the circles represents the number of altered genes from each pathway.
Pol II occupancy changes (log) of genes associated with enriched collagen and extracellular matrix (ECM) pathways measured from patients (−/−) and heterozygous parent (+/−) SI‐NET‐seq data. Significant changes are highlighted (orange). Bold and underlined genes are shared between patients and heterozygous parent.
References
-
- Annunen P, Helaakoski T, Myllyharju J, Veijola J, Pihlajaniemi T, Kivirikko KI (1997) Cloning of the human prolyl 4‐hydroxylase alpha subunit isoform alpha(II) and characterization of the type II enzyme tetramer. The alpha(I) and alpha(II) subunits do not form a mixed alpha(I)alpha(II)beta2 tetramer. J Biol Chem 272: 17342–17348 - PubMed
-
- Arnold M, Bressin A, Jasnovidova O, Meierhofer D, Mayer A (2021) A BRD4‐mediated elongation control point primes transcribing RNA polymerase II for 3′‐processing and termination. Mol Cell 81: 3589–3603.e13 - PubMed
-
- Balasubramanian M, Padidela R, Pollitt RC, Bishop NJ, Mughal MZ, Offiah AC, Wagner BE, McCaughey J, Stephens DJ (2018) P4HB recurrent missense mutation causing Cole‐carpenter syndrome. J Med Genet 55: 158–165 - PubMed
-
- Baldwin BR, Kleinberg M, Keay S (1996) Molecular cloning and expression of receptor peptides that block human cytomegalovirus/cell fusion. Biochem Biophys Res Commun 219: 668–673 - PubMed
Publication types
MeSH terms
Substances
Associated data
- Actions
LinkOut - more resources
Full Text Sources
Molecular Biology Databases

