. 2023 Jul;19(7):2026-2044.
doi: 10.1080/15548627.2023.2167689. Epub 2023 Jan 18.

Inhibition of autophagy in microglia and macrophages exacerbates innate immune responses and worsens brain injury outcomes

Affiliations

Inhibition of autophagy in microglia and macrophages exacerbates innate immune responses and worsens brain injury outcomes

Nivedita Hegdekar et al. Autophagy. 2023 Jul.

Abstract

Excessive and prolonged neuroinflammation following traumatic brain injury (TBI) contributes to long-term tissue damage and poor functional outcomes. However, the mechanisms contributing to exacerbated inflammatory responses after brain injury remain poorly understood. Our previous work showed that macroautophagy/autophagy flux is inhibited in neurons following TBI in mice and contributes to neuronal cell death. In the present study, we demonstrate that autophagy is also inhibited in activated microglia and infiltrating macrophages, and that this potentiates injury-induced neuroinflammatory responses. Macrophage/microglia-specific knockout of the essential autophagy gene Becn1 led to overall increase in neuroinflammation after TBI. In particular, we observed excessive activation of the innate immune responses, including both the type-I interferon and inflammasome pathways. Defects in microglial and macrophage autophagy following injury were associated with decreased phagocytic clearance of danger/damage-associated molecular patterns (DAMP) responsible for activation of the cellular innate immune responses. Our data also demonstrated a role for precision autophagy in targeting and degradation of innate immune pathways components, such as the NLRP3 inflammasome. Finally, inhibition of microglial/macrophage autophagy led to increased neurodegeneration and worse long-term cognitive outcomes after TBI. Conversely, increasing autophagy by treatment with rapamycin decreased inflammation and improved outcomes in wild-type mice after TBI. Overall, our work demonstrates that inhibition of autophagy in microglia and infiltrating macrophages contributes to excessive neuroinflammation following brain injury and in the long term may prevent resolution of inflammation and tissue regeneration.Abbreviations: Becn1/BECN1, beclin 1, autophagy related; CCI, controlled cortical impact; Cybb/CYBB/NOX2: cytochrome b-245, beta polypeptide; DAMP, danger/damage-associated molecular patterns; Il1b/IL1B/Il-1β, interleukin 1 beta; LAP, LC3-associated phagocytosis; Map1lc3b/MAP1LC3/LC3, microtubule-associated protein 1 light chain 3 beta; Mefv/MEFV/TRIM20: Mediterranean fever; Nos2/NOS2/iNOS: nitric oxide synthase 2, inducible; Nlrp3/NLRP3, NLR family, pyrin domain containing 3; Sqstm1/SQSTM1/p62, sequestosome 1; TBI, traumatic brain injury; Tnf/TNF/TNF-α, tumor necrosis factor; Ulk1/ULK1, unc-51 like kinase 1.

Keywords: Autophagy; innate immunity; macrophage; microglia; neuroinflammation; traumatic brain injury.


Conflict of interest statement

No potential conflict of interest was reported by the authors.

Figures
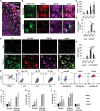
Figure 1.
Figure 1.
Autophagy is inhibited in activated microglia & macrophages after TBI. (A-B) Images (20X, scale bar: 100 μm) of microglia/macrophage reporter Cx3cr1-GFP cortical sections from injured mice (3 days after injury) stained with antibodies against macrophage-specific marker ADGRE1/F4/80 (red) and autophagy flux marker SQSTM1 (purple). White boxes in (A) highlight the cells magnified in (B) (scale bar: 20 μm). Macrophages are defined as CX3CR1+ADGRE1high, and microglia as CX3CR1+ ADGRE1low. (C) Corresponding quantification of all CX3CR1+ cells (black bars) and CX3CR1+ cells with inhibited autophagy (CX3CR1+SQSTM1+, gray bars) in sham, 1-, 3- and 7 days after injury. 13% of all CX3CR1+ cells show inhibition of autophagy at 3 days after injury. (D) Quantification of all macrophages (CX3CR1+ ADGRE1high, black bars) and macrophages with inhibited autophagy (CX3CR1+ ADGRE1high SQSTM1+, gray bars). 65% of all CX3CR1+ ADGRE1high cells show inhibition of autophagy at 3 days after injury. Data are mean ± SEM, n = 5 mice/group; *p < 0.05, **p < 0.01 vs. corresponding sham (one-way ANOVA with Dunnet’s post-hoc for multiple comparisons). (E) Images (20X, scale bar: 50 μm) of sham and TBI macrophage reporter Ccr2-RFP mice cortical sections stained with antibodies against autophagy markers LC3 (green) and SQSTM1 (purple). (F) Corresponding quantification of macrophages (CCR2+) expressing LC3 (black bars) and LC3 plus SQSTM1 (gray bars). 90% of all CCR2+ LC3+ cells are SQSTM1+ at 3 days post TBI. Data are mean ± SEM, n = 4 mice/group; ***p < 0.001, ****p < 0.0001 vs. corresponding sham (one-way ANOVA with Dunnet’s post-hoc for multiple comparisons). (G-L) Flow cytometry-based assessment of autophagy in microglia and infiltrating monocytes from sham and TBI mouse cortices. (G) Representative dot plot demonstrating strategy for identification of microglia (PTPRC/CD45int ITGAM/CD11B+) and infiltrating myeloid (PTPRChigh ITGAM+) populations at 3 days post TBI. (H) Dot plots demonstrating strategy for identifying cells with normal autophagy (LC3) and with inhibited autophagy (LC3+) in microglia (MG) and infiltrating myeloid (pMy) cells based on LC3 antibody staining intensity. (I) Comparison of LC3 staining (blue = LC3, red = LC3+) with Cyto-ID® autophagy dye and SQSTM1 antibody staining. Cells positive for LC3 and autophagy dye also accumulate higher levels of SQSTM1 indicating inhibition of autophagy flux. (J-L) Quantification of microglia and infiltrating macrophages with inhibited autophagy in sham and TBI mouse cortices based on (J) % of LC3+ cells, (K) % of SQSTM1+ cells, and (L) % of autophagy dye+ cells. Analysis of corresponding blood monocytes is included in (L). Data are mean ± SEM; n = 6–7 mice/group; *p < 0.05, **p < 0.01, ***p < 0.001 vs sham; two-way ANOVA with Dunnet’s post-hoc for multiple comparisons.
Figure 2.
Figure 2.
Inhibition of autophagy is associated with increased expression of pro-inflammatory markers after TBI. (A) Images (20X, scale bar: 50 μm) of Cx3cr1-GFP cortical sections stained with antibodies against pro-inflammatory cytokine NOS2 (red) and autophagy flux marker SQSTM1(purple). (B) Quantification of IF data from (A) measuring NOS2 expression in all CX3CR1+ cells (black bars) and CX3CR1+ cells with inhibited autophagy (gray bars) in sham, and 1-, 3- and 7 days post TBI cortical sections. 69% of all CX3CR1+ NOS2+ cells show inhibition of autophagy at 3 days post injury. (C) Images (20X, scale bar: 50 μm) of Cx3cr1-GFP mouse cortical sections stained with antibodies against inflammasome marker NLRP3 (red) and autophagy flux marker SQSTM1(purple). (D) Quantification of IF data from (C) measuring NLRP3 expression in all CX3CR1+ cells (black bars) and CX3CR1+ cells with inhibited autophagy (gray bars) in sham and 1-, 3- and 7 days post TBI brain cortical sections. 90% of all CX3CR1+ NLRP3+ cells show inhibition of autophagy at 3 days post injury. Data are mean ± SEM, n = 5 mice/group; *p < 0.05, **p < 0.01 vs. corresponding sham (one-way ANOVA with Dunnet’s post-hoc for multiple comparisons). (E-J) Flow cytometry-based assessment of inflammatory markers in microglia and infiltrating myeloid cells with normal autophagy flux (Cyto-ID® autophagy dye, black) versus inhibited autophagy flux (dye+, red) isolated form sham and injured mouse brains at 1-, 3-, 7- and 28- days post TBI. (E) Representative histograms showing comparison of IL1B/IL-1β staining intensity in microglia with normal autophagy flux (black, dye+) and inhibited autophagy flux (red, dye). (F-G) Quantification of IL1B (F) and TNF/TNF-α (G) MFI in microglia demonstrates increased pro-inflammatory expression levels in cells with inhibited autophagy up to day 28 post injury. (H) Representative histograms showing comparison of IL1B staining intensity in infiltrating myeloid cells with normal (black) and inhibited autophagy flux. (I-J) Quantification of IL1B (I) and TNF (J) mean fluorescence intensity (MFI) in infiltrating myeloid cells. Data are mean ± SEM, n = 6–7 mice/group; *p < 0.05, **p < 0.01, ***p < 0.001, ****p < 0.0001 vs. corresponding autophagy dye group; two-way ANOVA with Bonferroni’s post-hoc for multiple comparisons.
Figure 3.
Figure 3.
Inhibition of autophagy in macrophages and microglia exacerbates inflammatory responses in vitro. (A) Western blot of murine IMG microglial cells treated with autophagy inhibitors bafilomycin A1 (BafA, 20 nM), 3-methyladenine (3-MA, 100 μM), or MRT68921 (MRT, 10 μM) for 6 h with or without lipopolysaccharide (LPS) pre-treatment (10 ng/μl, 3 h). (B) Densitometric analysis from (A) demonstrating increased NOS2 and NLRP3 protein expression (proteins normalized to loading control ACTB/β-Actin) in IMG microglial cells treated with autophagy inhibitors, under both basal conditions and following LPS pre-treatment. (C) Griess assay demonstrating increased nitric oxide production in IMG microglial cells treated with autophagy inhibitors as described in (A). (D) Western blot of murine RAW 246.7 macrophage cells treated with autophagy inhibitors as described in (A). (E) Densitometric analysis from (D) demonstrating increased NOS2 and NLRP3 protein expression in RAW cells treated with autophagy inhibitors, under both basal conditions and following LPS pre-treatment. (F) Griess assay demonstrating increased nitric oxide production in RAW macrophage cells treated with autophagy inhibitors as described in (A). (G) Densitometric analysis of LC3-II and SQSTM1 protein levels from (A) and (D) indicating that inflammation (LPS treatment) itself does not lead to inhibition of autophagy flux in IMG and RAW cells. (H) Western blot of C57Bl/6 bone marrow derived macrophages (BMDM) showing increased expression of NOS2 protein levels when treated with autophagy inhibitors as described in (A). Data are mean ± SEM; n = 3 replicates/group with 3 independent experiments performed. *p < 0.05, **p < 0.01, ***p < 0.001, ****p < 0.0001, vs corresponding control; one-way ANOVA with Tukey’s post-hoc for multiple comparisons.
Figure 4.
Figure 4.
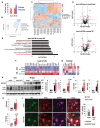
Microglia and monocyte-specific inhibition of autophagy exacerbates inflammatory responses after TBI. (A) Quantification of microglia and infiltrating monocytes that are tdTomato+, indicative of Lyz2-Cre expression. (B-G) Results of NanoString analysis comparing neuroinflammatory gene expression in cortical tissue from sham and TBI (3 days post injury) control (Lyz2-cre) mice and mice with microglia and macrophage-specific inhibition of autophagy (Lyz2-cre/Becn1-flox, abbreviated as becn1 cKO). (B) Partial Least Squares – Discriminate Analysis (PLS-DA) plot demonstrating separation among control sham (purple), becn1 cKO sham, control TBI (blue), and becn1 cKO TBI (green) mice groups; R2 = 0.98, Q2 = 0.81. Each point represents a data set from an individual animal. The 95% confidence intervals are indicated by elliptical shaded areas. Data were sum normalized, log transformed, and mean centered. (C) Heatmap including all assessed genes based on t-test/ANOVA, Euclidean distancing, and ward clustering. (B-C) were generated using MetaboAnalyst. (D) Volcano plot highlighting differentially expressed genes between becn1 cKO and control mice in sham (top) and TBI (bottom) cortices. Genes with p < 0.05 and fold change > 2 are highlighted in red. (E) Pathways analysis using NIH-DAVID indicates that innate immune responses are the most differentially regulated between becn1 cKO and control mice in the injured cortex after TBI. (F) Nanostring based heatmap shows increased expression innate immunity genes in the injured cortex of becn1 cKO compared to control mice at 3 days post injury. Color coding was based on z-score scaling. (G) Nanostring based heatmap shows decrease in autophagy gene expression in the injured cortices of becn1 cKO mice compared to control mice at 3 days post injury. Color coding was based on z-score scaling. (H) Western blot of cortical tissue lysates demonstrating that becn1 cKO mice have increased impairments in autophagy compared to control mice after TBI (3 days post injury). (I) Densitometric analysis from (H) shows increased expression of autophagy proteins LC3-II and SQSTM1 in becn1 cKO as compared to control mice at 3 days post injury. (J) qRT-PCR demonstrating that pro-inflammatory genes Cybb and Nfkb1 are significantly higher in the injured cortices of becn1 cKO mice compared to control mice at 3 days post injury. (K) qRT-PCR demonstrating that anti-inflammatory genes Il10 and Tgfb levels are not significantly changed in the injured cortices of control and becn1 cKO mice at 3 days post injury. Data are mean ± SEM; n = 5–6 mice/group. *p < 0.05, **p < 0.01, ***p < 0.001 vs corresponding control; ^^^p < 0.001, ^^^^p < 0.0001 vs corresponding sham (two-way ANOVA with Tukey’s post-hoc for multiple comparisons). (L) Images (20X, scale bar: 50 μm) of control and becn1 cKO cortical sections at 3 days post TBI, stained with antibodies against immune cell marker AIF1/IBA1 (green), pro-inflammatory marker NOS2 (red), and autophagy flux marker SQSTM1 (purple). Corresponding quantification of microglial/macrophage cells with inhibited autophagy (AIF1+ SQSTM1+) and increased NOS2 expression (AIF1+ SQSTM1+ NOS2+). Data are presented as mean ± SEM; n = 4–5 mice/group. *p < 0.05 vs control (AIF1+ SQSTM1+ cells, Student’s t-test).
Figure 5.
Figure 5.
Inhibition of precision autophagy in microglia/monocytes contributes to exacerbated innate immunity responses after TBI. (A-B) qRT-PCR analysis shows increased expression of innate immunity genes related to (A) type-I IFN pathway and the (B) NLRP3 inflammasome pathway in the injured cortices of becn1 cKO mice compared to control mice at 3 days post injury. (C) Western blot of cortical tissue lysates demonstrating exacerbated innate immune responses in becn1 cKO mice compared to control mice at 3 days post injury. (D) Densitometric analysis from (C) shows increased protein levels of NLRP3, CYBB, CGAS and STING1 in the injured cortical tissue of becn1 cKO mice compared to control mice at 3 days post TBI. (E-G) Flow cytometry analysis comparing levels of IL1B protein expression in microglia and infiltrating monocytes from sham and TBI (3 days post injury) cortices of becn1 cKO and control mice. (E) Representative histograms comparing relative fluorescence intensity of IL1B in microglia from sham and TBI (3 days post injury) control (ctr) and becn1 cKO (cKO) cortices. (F) Quantification of IL1B expression and MFI in becn1 cKO as compared to control microglia. (G) Representative histogram comparing IL1B expression in infiltrating monocytes from sham and TBI (3 days post injury) control and becn1 cKO brain cortices. (H) Quantification of % of IL1B+ cells expression and MFI of IL1B in becn1 cKO as compared to control infiltrating macrophages. (I) Western blot demonstrating increased accumulation of precision autophagy adaptor protein MEFV in the injured cortex of becn1 cKO mice at 3 days post injury. (J) Densitometric analysis of MEFV protein levels with respect to loading control ACTB from (J) . (K) qRT-PCR analysis indicates that Mefv mRNA levels do not significantly change in the injured cortex between control and becn1 cKO mice. (L) Immunoprecipitation of mouse cortical lysates with antibody against ULK1 but not control IgG leads to co-precipitation of MEFV and NLRP3, demonstrating formation of ULK1-MEFV-NLRP3 complexes at 3 days post injury. Data are mean ± SEM; n = 4–5 mice/group. *p < 0.05, ***p < 0.001, vs. control (genotype effect); ^p < 0.05, ^^p < 0.01, ^^^^p < 0.0001 vs. corresponding sham (injury effect); two-way ANOVA with Tukey’s post-hoc for multiple comparisons.
Figure 6.
Figure 6.
Inhibition of precision autophagy in microglia/monocytes leads to defects in phagocytosis and accumulation of DAMPs after TBI. (A) Western blot of cortical lysates of sham and TBI mice (3 days post injury) comparing levels of DAMP marker PRDX6 and cleaved SPTAN1/α-FODRIN. All lanes are cropped from the same western blot. (B) Densitometric analysis from (A) indicates increase in PRDX6 and cleaved SPTAN1 protein levels in becn1 cKO mice compared to control mice at 3 days post injury. (C) NanoString based heatmap of scavenger receptor genes shows increased expression of scavenger receptors in the injured cortices of becn1 cKO mice compared to control mice at 3 days post TBI. Color coding was based on z-score scaling. (D) Representative dot plot showing phagocytosis of red beads by control and becn1 cKO microglia under sham and TBI (3 days post injury) conditions. (E) Representative histograms comparing relative intensity of phagocytic bead uptake by control mice (black) and becn1 cKO microglia (red). (F) Corresponding quantification demonstrates decreased phagocytic bead uptake by becn1 cKO microglia compared to control microglia after TBI (3 days post injury). (G) Images (20X, scale bar: 50 μm) of sham and TBI GFP-Lc3 mice brain cortical sections stained with antibodies against CYBB (red). (H) Quantification of IF data from (G) shows increased colocalization of LC3 and CYBB in cells at 3 days post injury, indicating a potential role of LAP after TBI. (I) Magnification (scale bar: 10 μm) of the white box in (G) highlighting colocalization between LC3 and CYBB. Data are mean ± SEM; n = 4–5 mice/group. *p < 0.05, vs. control (genotype effect); ^p < 0.05, ^^p < 0.01 vs. corresponding sham (injury effect); two-way ANOVA with Tukey’s post-hoc for multiple comparisons.
Figure 7.
Figure 7.
Inhibition of autophagy in microglia/monocytes worsens, while stimulation of autophagy improves long-term cognitive outcomes after TBI. (A-C) Deficits in spatial learning and memory measured using Morris Water Maze (MWM) during days 21–25 following TBI. (A) During the probe trial testing, becn1 cKO mice spent significantly less time searching for the escape quadrant compared to control mice after injury. (B) Representative images for search strategy assessment for probe trial testing. (*p < 0.05) (C) becn1 cKO mice increasingly used the looping search strategy and decreasingly used the spatial and sequential search strategy compared control mice after TBI, indicative of impairments in spatial learning and memory. Search strategy was analyzed using chi-squared analysis. (D) Novel object recognition (NOR) test was performed on days 16 and 17 following TBI to assess non-spatial memory retention in control and becn1 cKO mice. Quantification shows decrease in the ratio of time spent with the novel object as compared to familiar object in becn1 cKO mice after TBI, indicative of defects in non-spatial memory; n = 12 control sham, 13 becn1 cKO sham, 16 control TBI, and 14 becn1 cKO TBI mice. (E) Representative images of cresyl violet stained neurons in the dentate gyrus (DG) of the ipsilateral hippocampus (20X magnification) across all experimental groups. (F) Stereological quantification of data from (E) showed increased neuronal loss in the ipsilateral DG of becn1 cKO mice compared to control mice at 28 days post injury; n = 7–8 mice/group. (G) qRT-PCR based heatmap of innate immunity genes in sham and TBI (28 days post injury) control and becn1 cKO mice cortices. Color coding was based on z-score scaling; n = 4–5 mice/group. (H) MWM test demonstrating significantly improved spatial learning in wild-type mice treated with rapamycin following TBI; n = 12–14 mice/group. (I) qRT-PCR based heatmap of innate immunity genes at sham and 3 days post TBI in vehicle and rapamycin-treated mice cortices. Color coding was based on z-score scaling; n = 5–7 mice/group. (J) Western blot of cortical tissue lysates at 3 days post TBI demonstrated decreased inflammation in mice treated with rapamycin compared to vehicle-treated mice. All lanes are from the same western blot. (K) Densitometric quantification from (J) shows decreased protein levels of NLRP3, CGAS and STING1 in cortical tissue lysates at 3 days post injury in mice treated with rapamycin compared to vehicle treated mice; n = 4–5 mice/group. Data are mean ± SEM. ^0 < 0.05, ^^p < 0.01, ^^^^p < 0.0001 vs. corresponding sham, *p < 0.05 vs corresponding vehicle-treated mice; two-way ANOVA with Tukey’s post-hoc for multiple comparisons.

References

    1. Acosta SA, Tajiri N, Shinozuka K, et al. Combination therapy of human umbilical cord blood cells and granulocyte colony stimulating factor reduces histopathological and motor impairments in an experimental model of chronic traumatic brain injury. PLoS One. 2014;9(3):e90953. - PMC - PubMed
    1. Maas AI, Stocchetti N, Bullock R.. Moderate and severe traumatic brain injury in adults. Lancet Neurol. 2008. Aug;7(8):728–741. - PubMed
    1. Bryant RA, O’Donnell ML, Creamer M, et al. The psychiatric sequelae of traumatic injury. Am J Psychiatry. 2010. Mar;167(3):312–320. - PubMed
    1. Li Y, Li Y, Li X, et al. Head injury as a risk factor for dementia and Alzheimer’s disease: a systematic review and meta-analysis of 32 observational studies. PLoS One. 2017;12(1):e0169650. - PMC - PubMed
    1. Shively S, Scher AI, Perl DP, et al. Dementia resulting from traumatic brain injury: what is the pathology? Arch Neurol. 2012. Oct;69(10):1245–1251. - PMC - PubMed

Publication types

Substances