. 2023 Jan 18;15(679):eabq6288.
doi: 10.1126/scitranslmed.abq6288. Epub 2023 Jan 18.

Targeting de novo lipid synthesis induces lipotoxicity and impairs DNA damage repair in glioblastoma mouse models

Affiliations

Targeting de novo lipid synthesis induces lipotoxicity and impairs DNA damage repair in glioblastoma mouse models

Katharina M Eyme et al. Sci Transl Med. .

Abstract

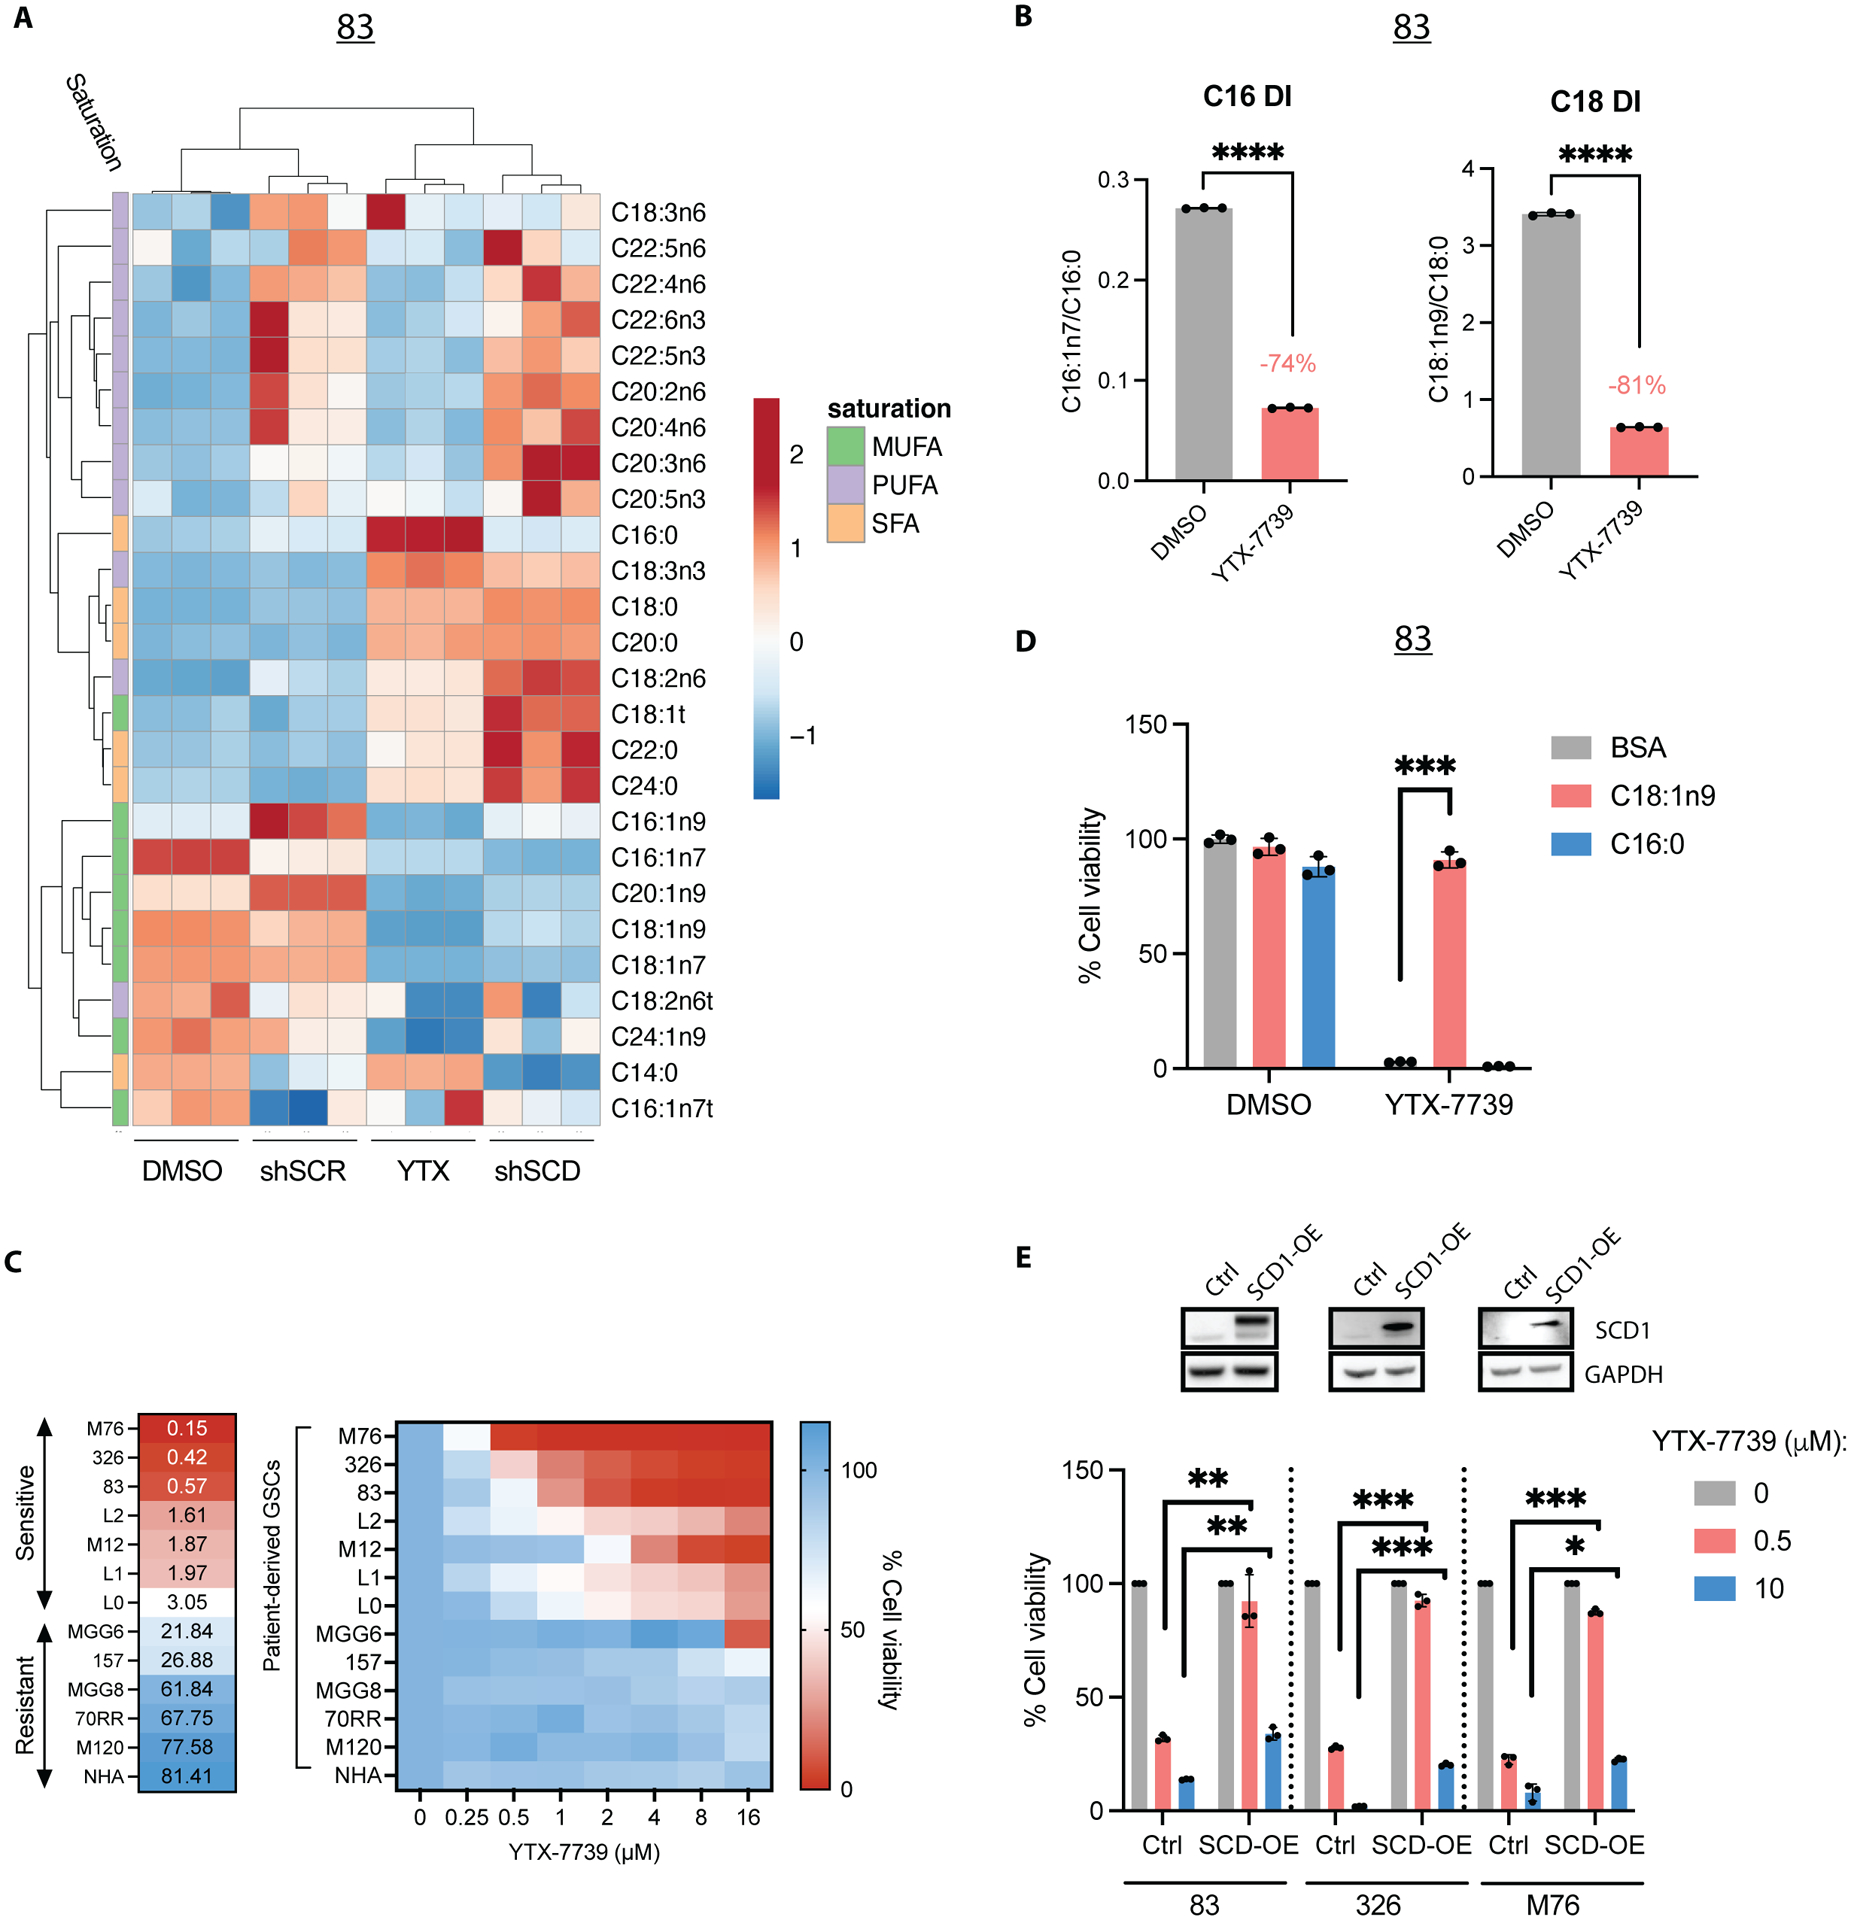
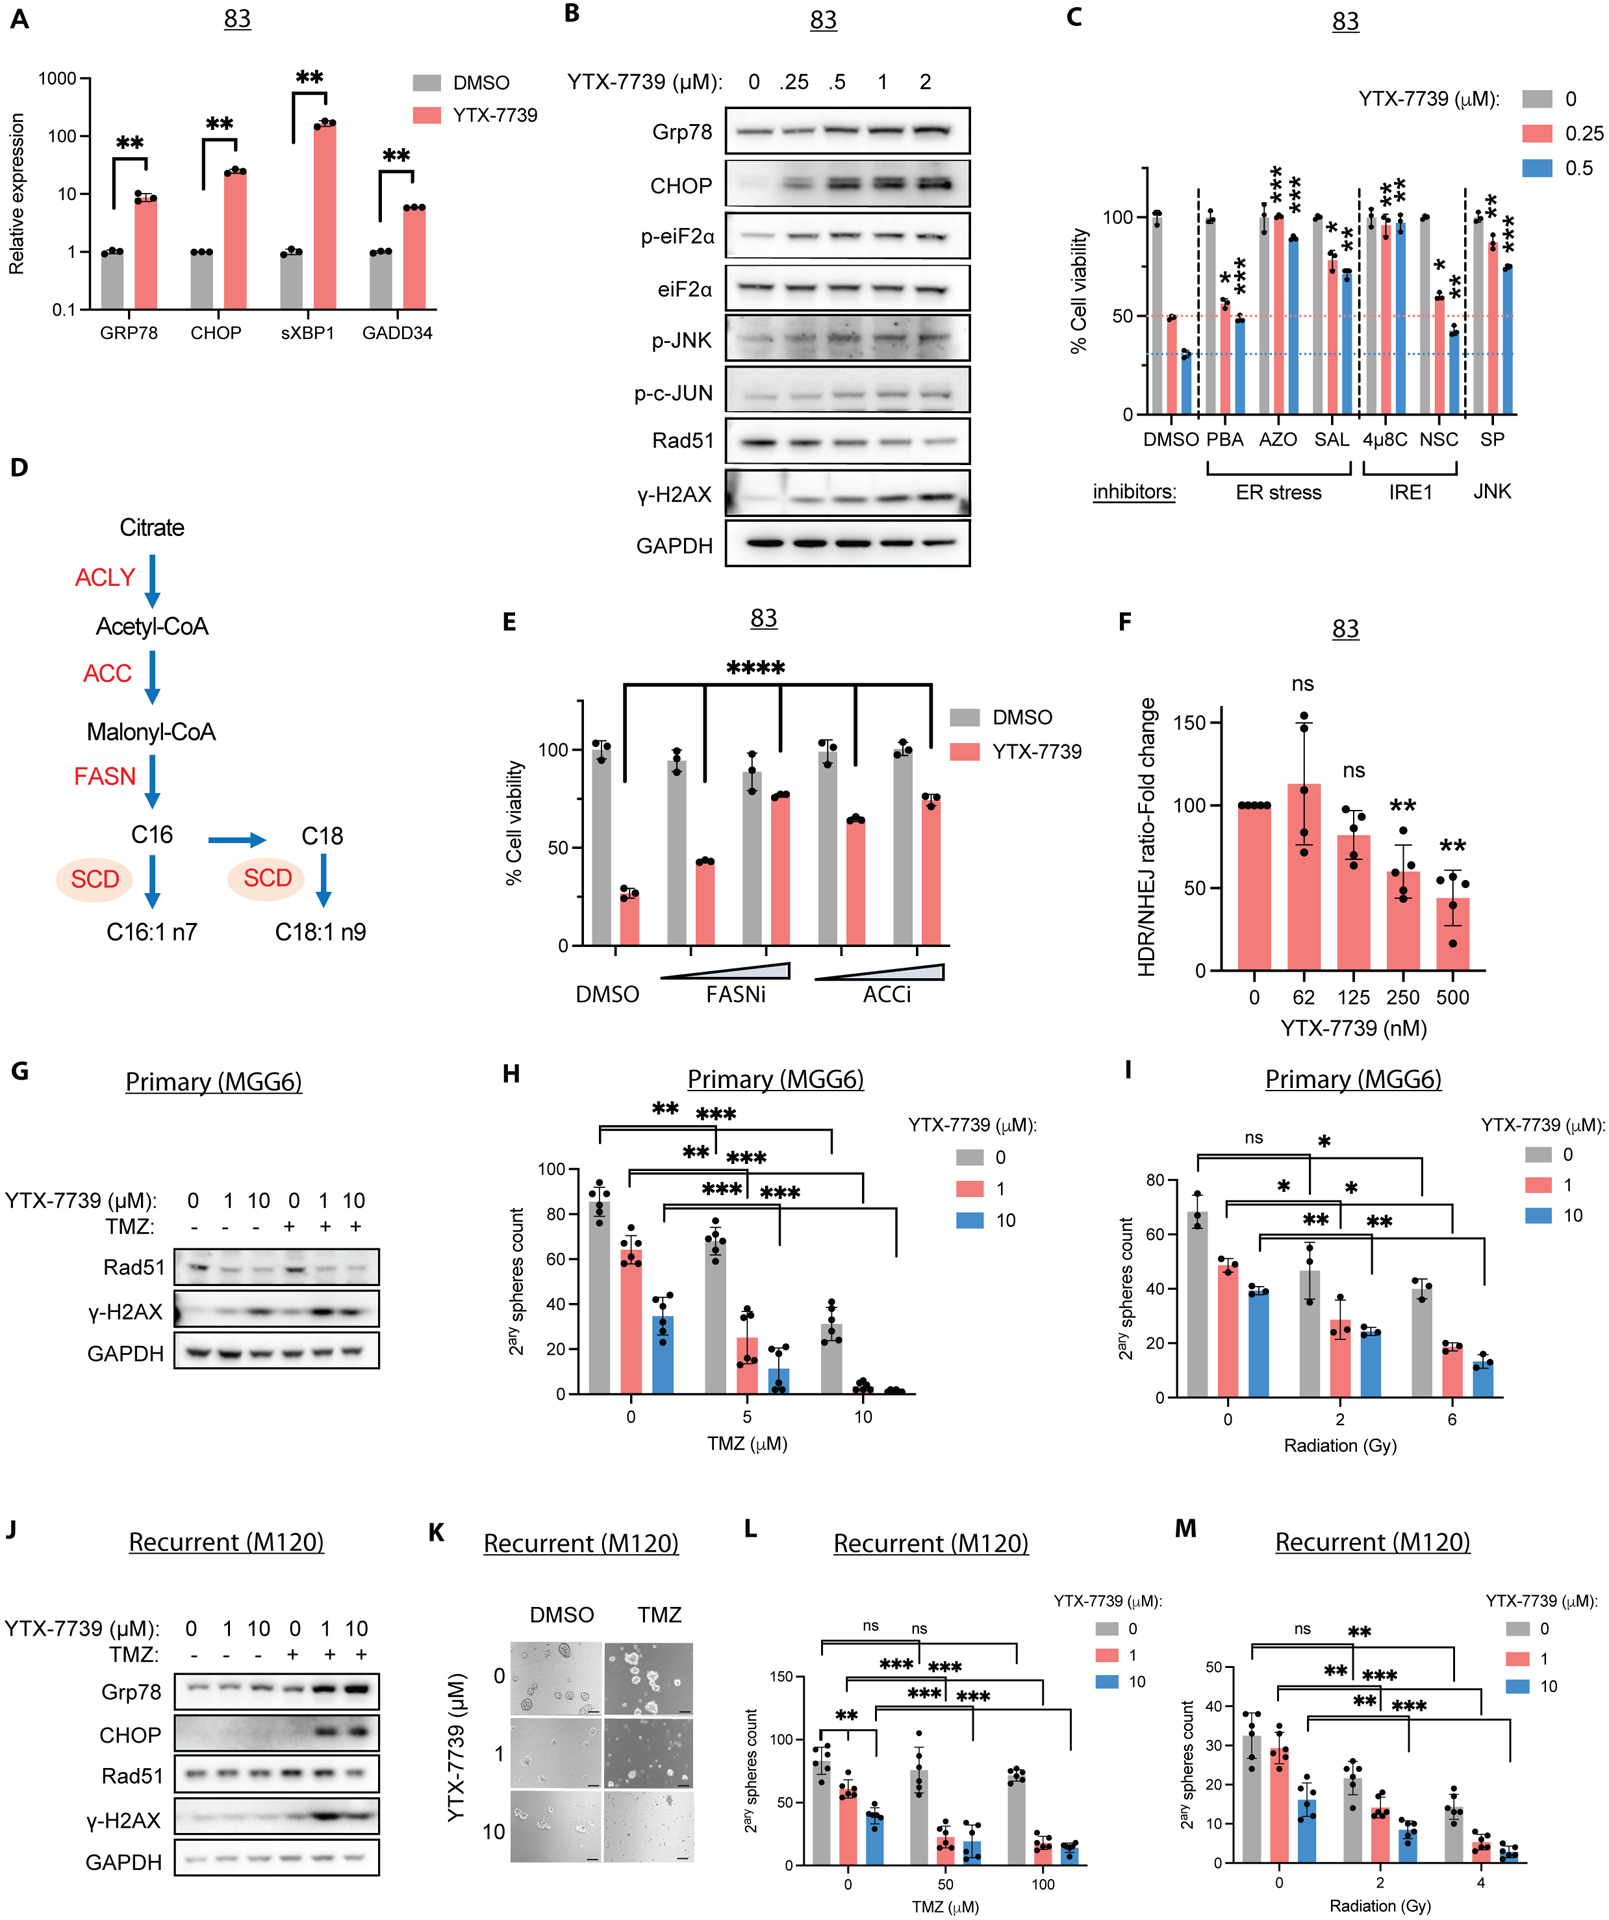
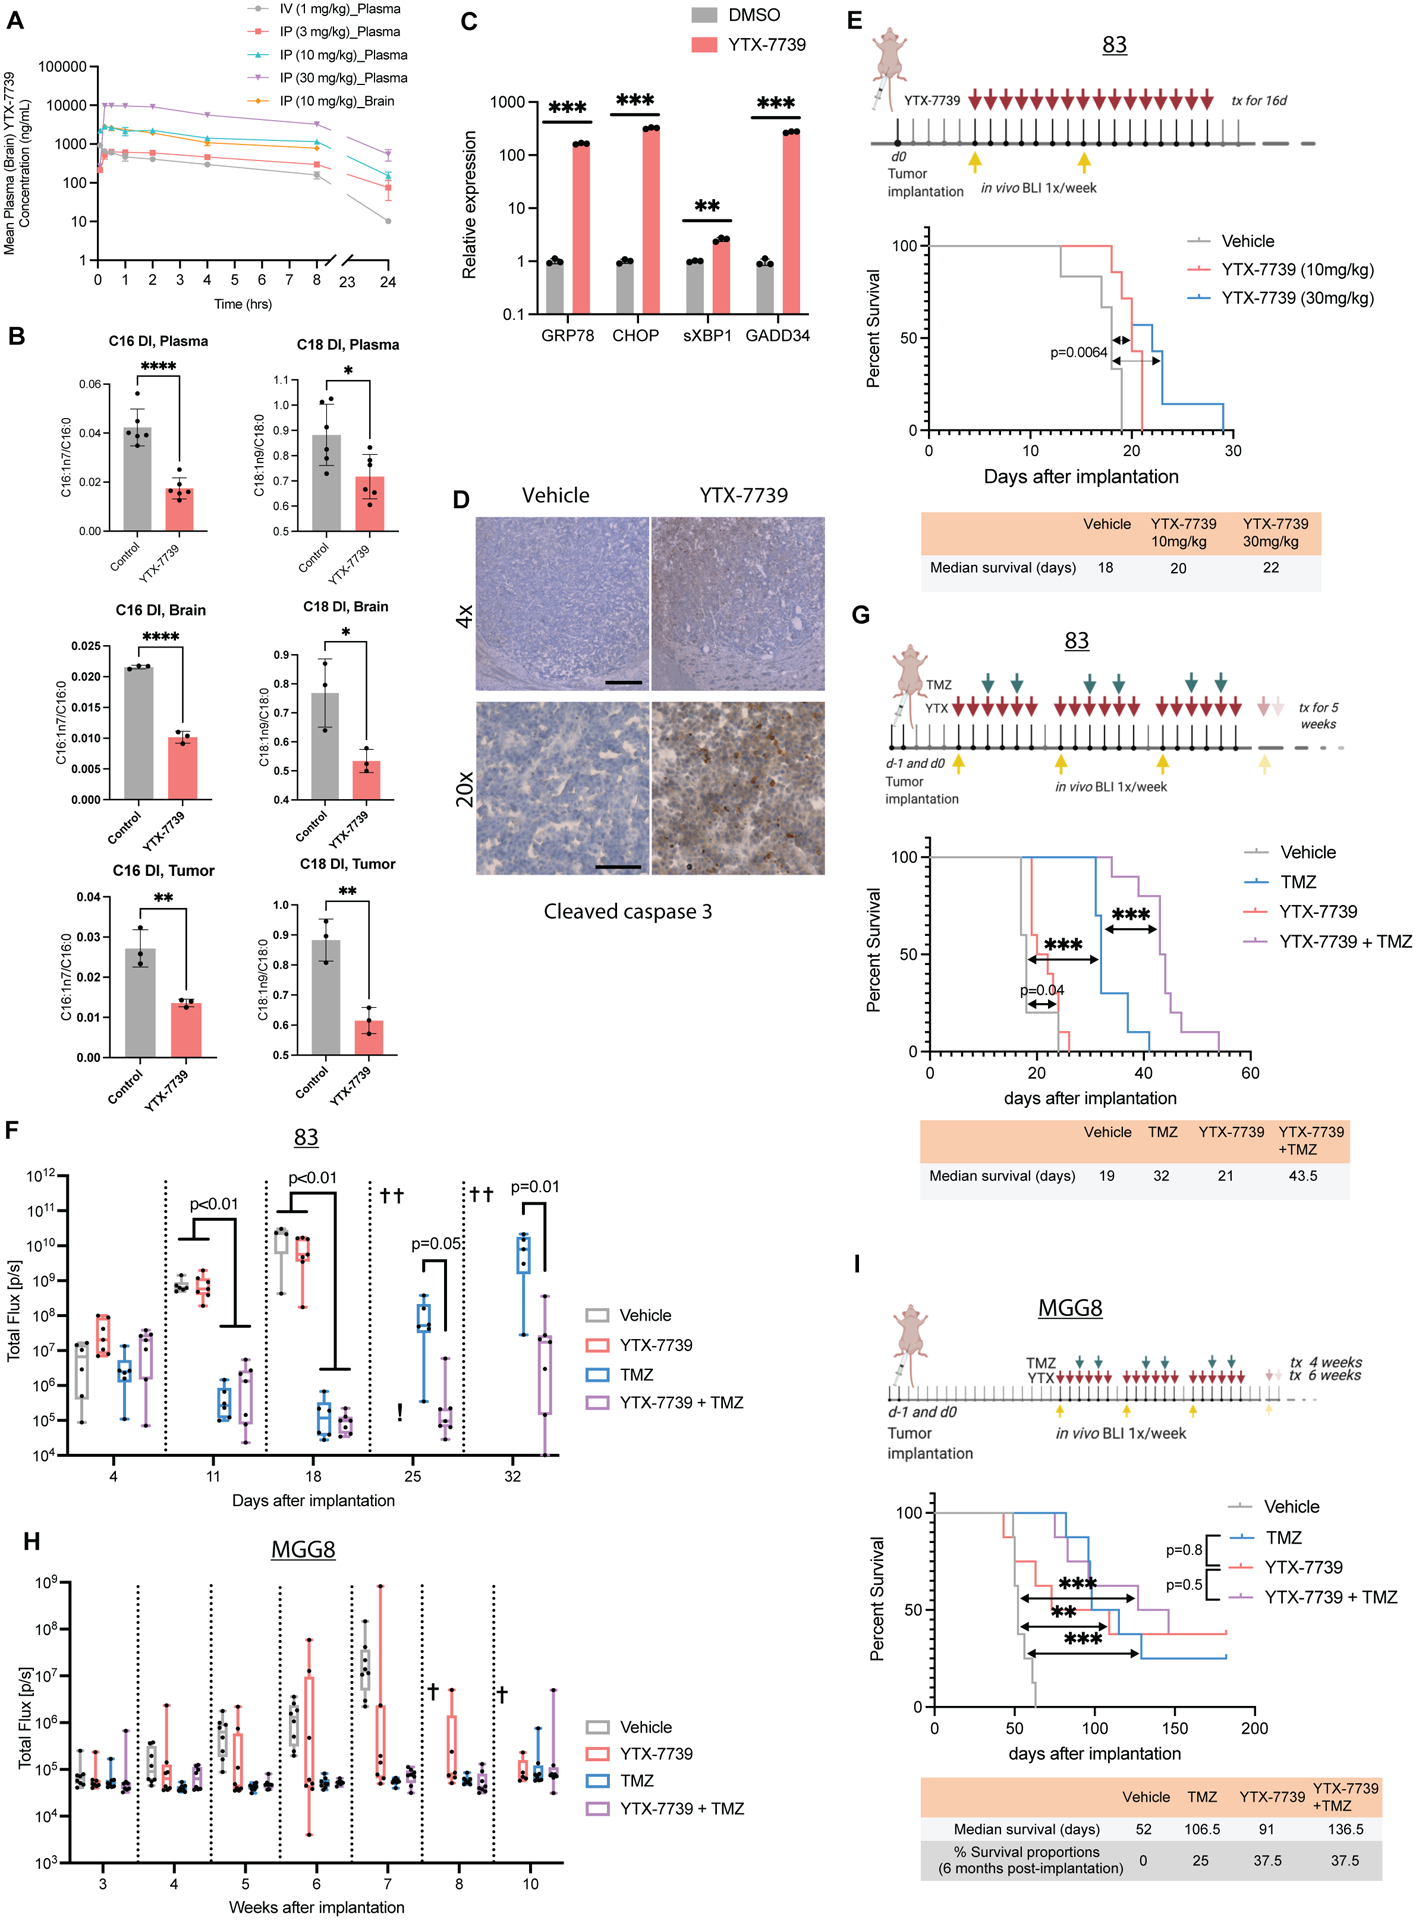
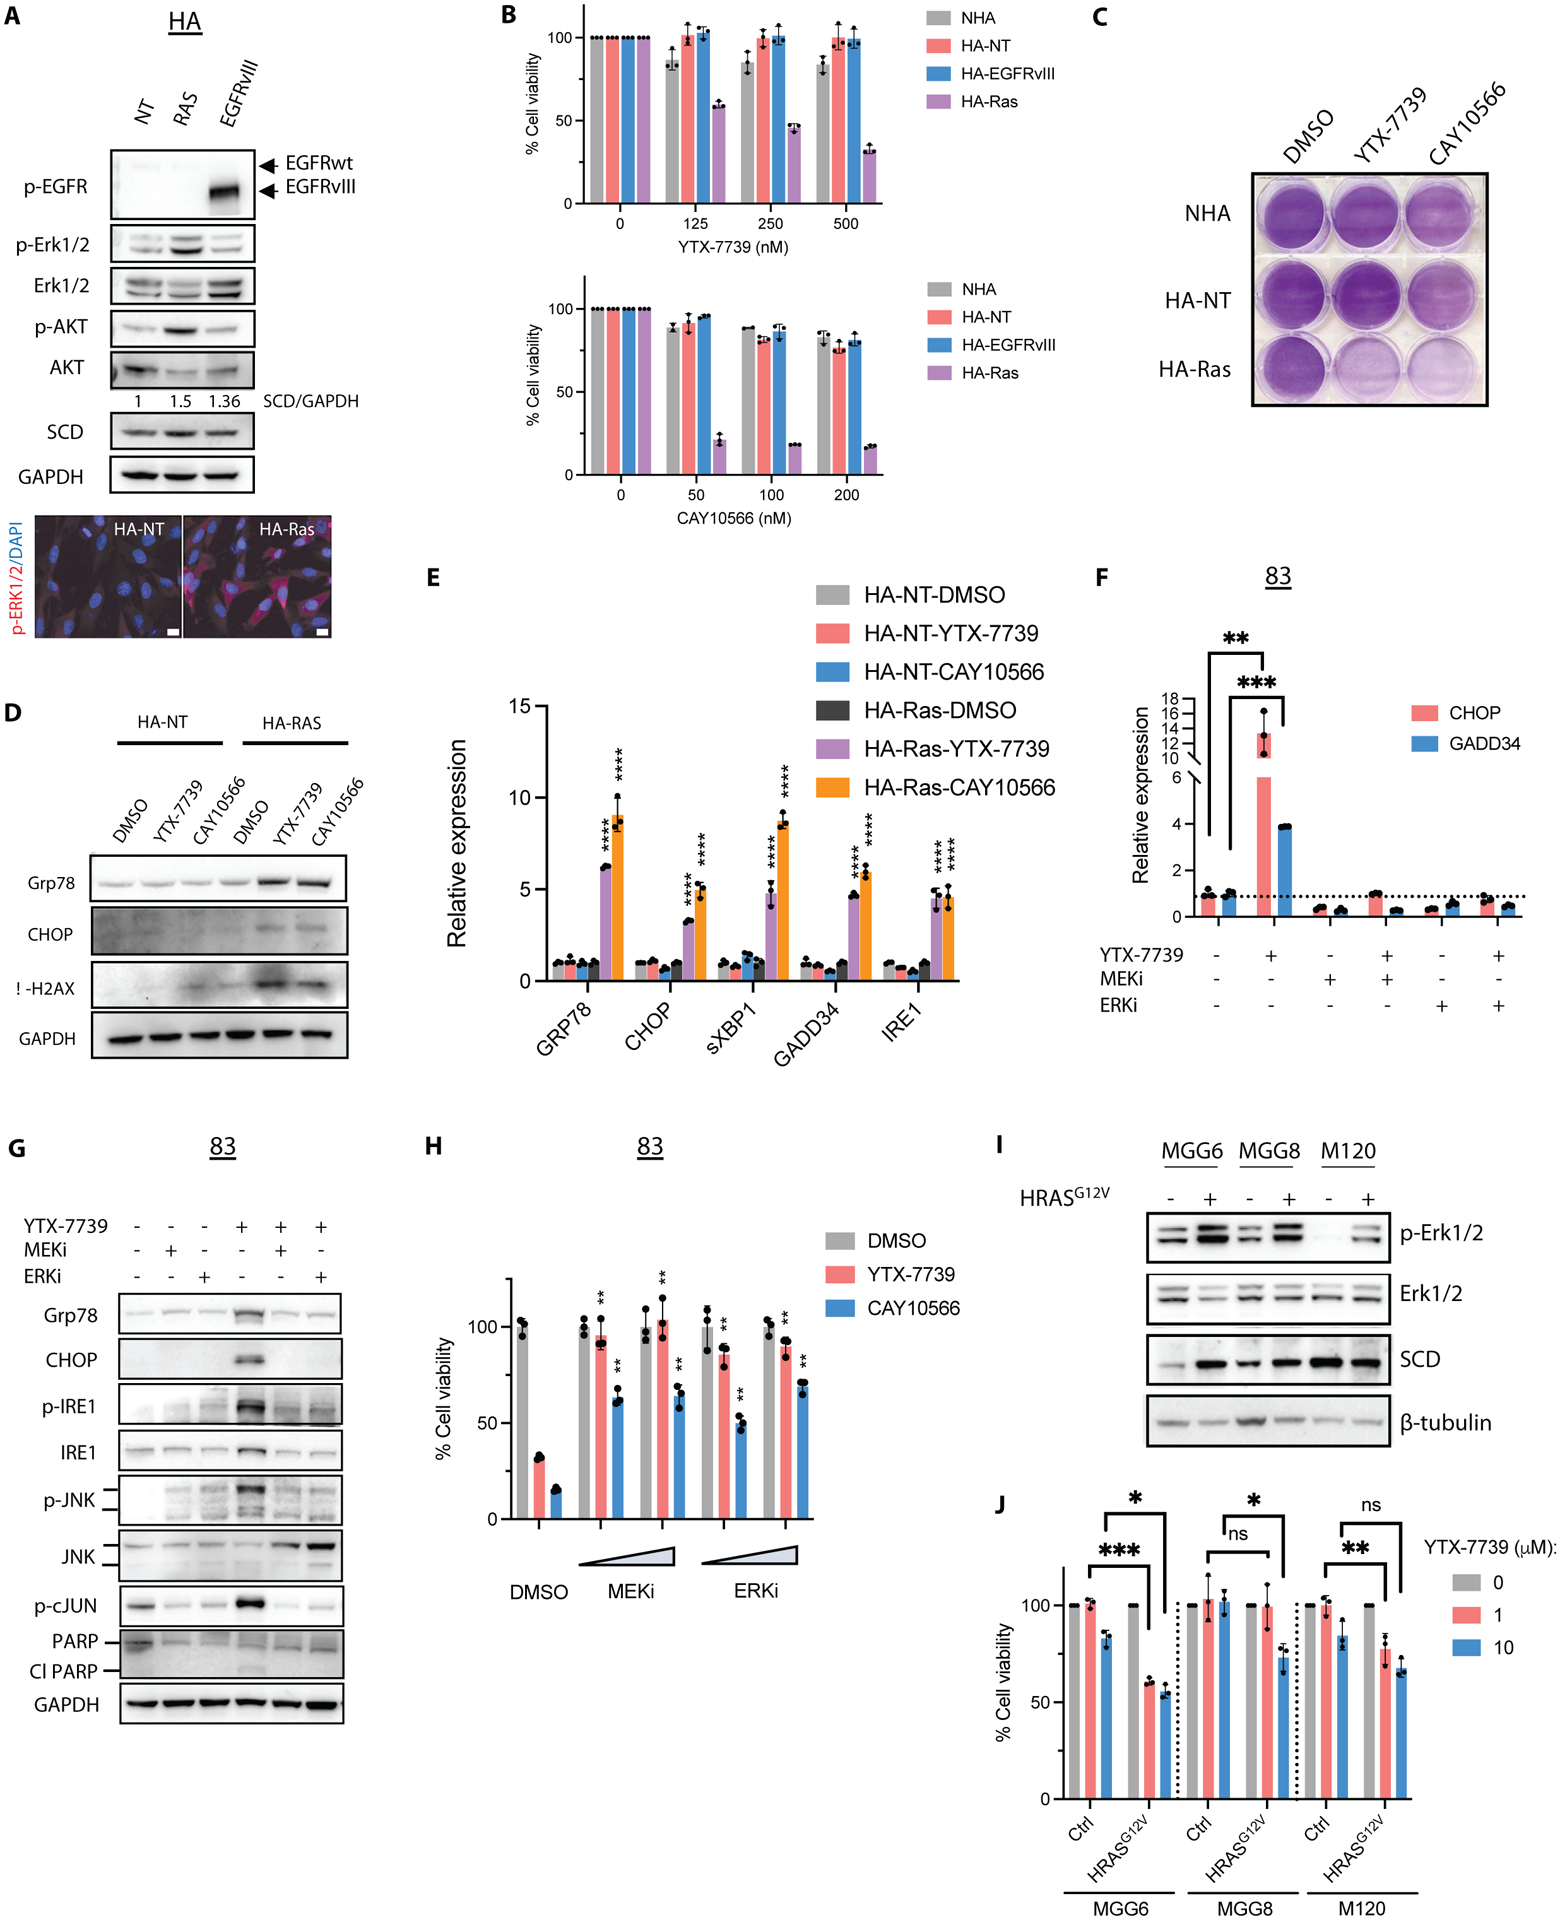
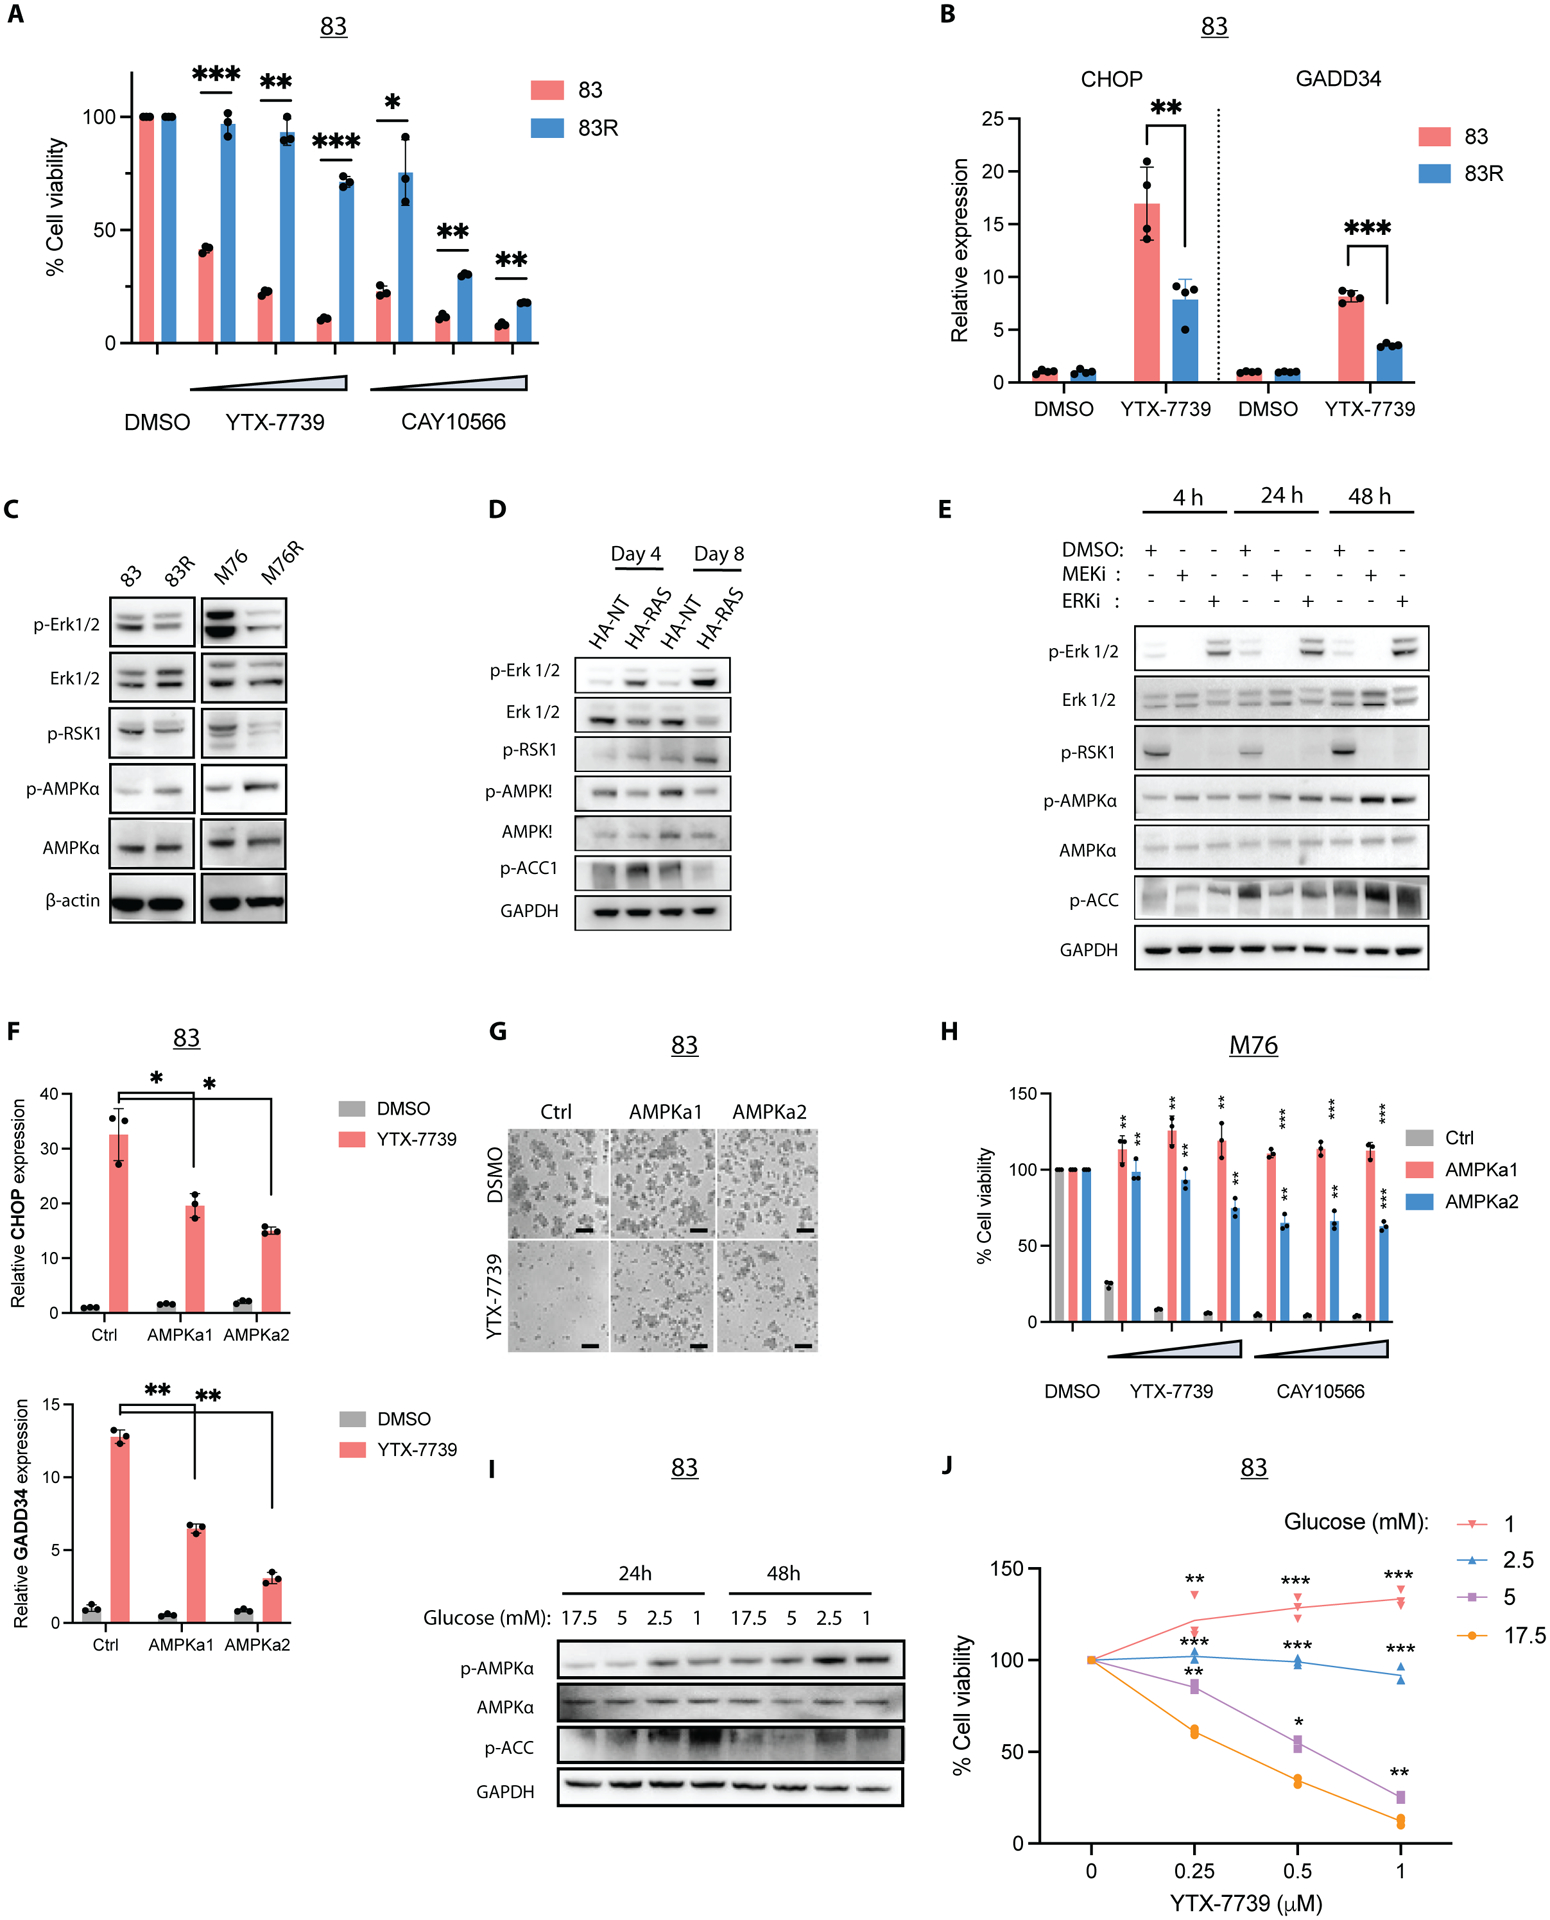
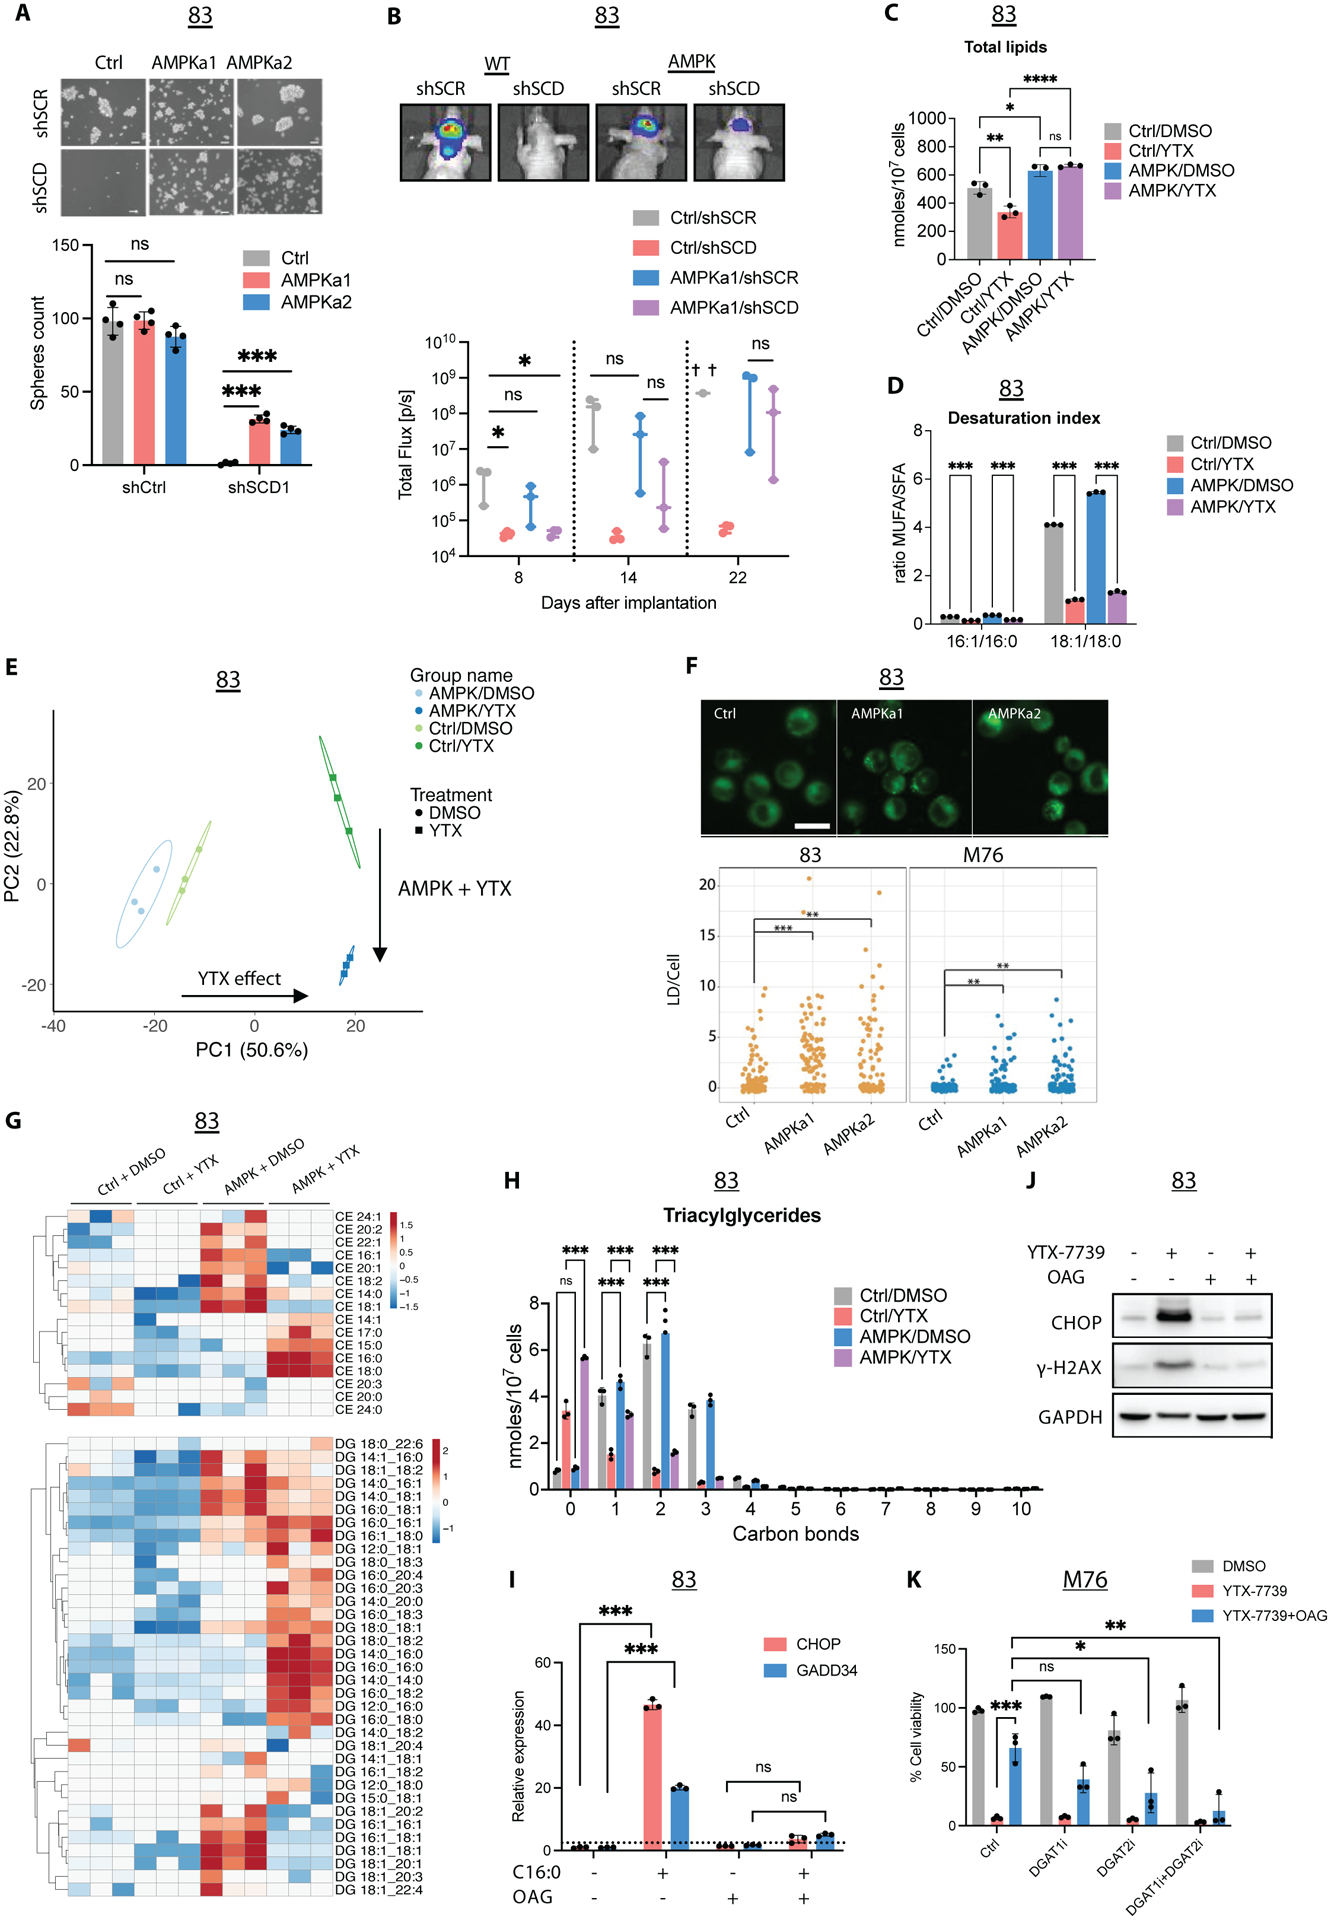
Deregulated de novo lipid synthesis (DNLS) is a potential druggable vulnerability in glioblastoma (GBM), a highly lethal and incurable cancer. Yet the molecular mechanisms that determine susceptibility to DNLS-targeted therapies remain unknown, and the lack of brain-penetrant inhibitors of DNLS has prevented their clinical evaluation as GBM therapeutics. Here, we report that YTX-7739, a clinical-stage inhibitor of stearoyl CoA desaturase (SCD), triggers lipotoxicity in patient-derived GBM stem-like cells (GSCs) and inhibits fatty acid desaturation in GSCs orthotopically implanted in mice. When administered as a single agent, or in combination with temozolomide (TMZ), YTX-7739 showed therapeutic efficacy in orthotopic GSC mouse models owing to its lipotoxicity and ability to impair DNA damage repair. Leveraging genetic, pharmacological, and physiological manipulation of key signaling nodes in gliomagenesis complemented with shotgun lipidomics, we show that aberrant MEK/ERK signaling and its repression of the energy sensor AMP-activated protein kinase (AMPK) primarily drive therapeutic vulnerability to SCD and other DNLS inhibitors. Conversely, AMPK activation mitigates lipotoxicity and renders GSCs resistant to the loss of DNLS, both in culture and in vivo, by decreasing the saturation state of phospholipids and diverting toxic lipids into lipid droplets. Together, our findings reveal mechanisms of metabolic plasticity in GSCs and provide a framework for the rational integration of DNLS-targeted GBM therapies.


Figures

Figure 1:
Figure 1:. YTX-7739 is a selective inhibitor of FA desaturation in cultured GSCs.
(A) Heat map representing unsupervised hierarchical clustering of FA content in 83 either transduced with a control shRNA (shSCR) or shSCD or treated with DMSO (control) or YTX-7739 (1μM) for 72h. (B) Desaturation index (DI) of C16 and C18 in 83 treated with YTX-7739 (1μM) for 72h. (C) Cell viability and EC50 of NHA and 12 GSC lines treated with YTX-7739 at the indicated doses for 96h, expressed as a percentage of control. (D) Cell viability in 83 treated with YTX-7739 (1μM) in the presence of BSA (control) or the indicated BSA-complexed FA for 96h. (E) Cell viability of GSCs ectopically expressing a control vector (Ctrl) or SCD1 (SCD1-OE) treated with YTX-7739 for 96h. The upper panel shows the immunoblots for SCD in Ctrl and SCD1-OE GSCs. ****P<0.0001; *** P<0.001; **P<0.01; *P<0.05. DI, desaturation index.
Figure 2:
Figure 2:. Treatment with YTX-7739 promotes a terminal UPR response and sensitizes to TMZ and radiation.
(A) Relative mRNA expression as compared to DMSO (control) and (B) immunoblot analysis of ER stress markers in 83 treated with YTX-7739 for 48h. (C) Cell viability of 83 treated with YTX-7739 in combination with inhibitors of ER stress (PBA: 4mM; Azoramide: 50μM; Salubrinal: 25μM), IRE1 (4μ8C: 25μM; NSC95682: 20μM) and JNK (SP600125: 20μM) for 96h. (D) Overview of de novo lipid synthesis (DNLS) pathway. (E) Cell viability of 83 treated with YTX-7739 (0.5μM) in combination with inhibitors of FASN (GSK2194069: 25–50nM) or ACC (CP-640186: 2.5–5μM) for 96h. (F) Fold-change in HDR/NHEJ normalized to cell viability in 83 treated with YTX-7739. (G-I) MGG6 were pretreated with YTX-7739 followed by TMZ or RT. (G) Immunoblot analysis of DNA repair and damage at 72h after treatment with YTX-7739 and TMZ (5μM). (H-I) Secondary sphere count 9 days after co-treatment with TMZ (H) or RT (I). (J-M) M120 were pretreated with YTX-7739, followed by TMZ or RT. (J) Immunoblot analysis after treatment with YTX-7739 and TMZ (100μM). (K) Representative micrographs of neurospheres. Scale bar, 100μm. (L-M) Secondary sphere count after co-treatment with TMZ (H) or RT (I). ****P<0.0001; *** P<0.001; **P<0.01; *P<0.05
Figure 3:
Figure 3:. YTX-7739 inhibits fatty acid desaturation and delays tumor growth in mice.
(A) Mean plasma and brain PK of YTX-7739 after IV or IP administration in mice (n=3/group). (B) DI of C16 and C18 in plasma, brain, and brain tumor samples from mice bearing 83 tumors and treated with YTX-7739 (30mg/kg) for 11 days beginning 4 days after inoculation (n=3/group). (C) Brain tumor tissue from that experiment was also used to measure mRNA expression of ER stress markers. (D) Representative immunostaining of cleaved caspase 3 in brain tumor tissue of DMSO and YTX-7739-treated mice. Scale bar, 4x: 250μm; 20x: 50μm. (E) Kaplan-Meier curve depicting median survival in mice bearing 83 tumors (n = 6/group) treated with a vehicle or YTX-7739 (10–30 mg/kg) for 16 days starting at day 5 post-implantation. (F) Overtime monitoring of tumor growth in mice bearing 83 tumors and treated with vehicle (n=6), YTX-7739 (30mg/kg; n=7), TMZ (25mg/kg; n=6) of YTX-7739+TMZ (n=7). Cross indicates that >50% of mice have expired due to tumor burden. (G) Median survival in mice bearing 83 and treated with vehicle (n=5), YTX-7739 (30mg/kg; n=10), TMZ (10mg/kg; n=10 or YTX-7739+TMZ (n=10). (H-I) Overtime monitoring of tumor growth (H) and median survival (I) in mice implanted with MGG8 (n=8/group) and treated with vehicle, YTX-7739 (30 mg/kg), TMZ (5mg/kg), or YTX-7739 + TMZ. P-value, two-sided log-rank test. ****P<0.0001; *** P<0.001; **P<0.01; *P<0.05
Figure 4:
Figure 4:. RAS/MEK/ERK promotes vulnerability to SCD inhibitors.
(A) Immunoblot analysis and immunostaining of HA-NT cells expressing a control vector, HRASG12V or EGFRvIII. Scale bar, 10μm. The ratio of SCD to GAPDH with values normalized to HA-NT is also shown. (B) Cell viability of primary (NHA) and transformed astrocytes (in 1% serum) treated with YTX-7739 (top) or CAY10566 (bottom) for 96h. (C) Cells were plated (in 1% serum) and treated with YTX-7739 (1μM) or CAY10566 (0.5μM) for five days before staining with crystal violet. (D-E) Immunoblot analysis (D) and relative mRNA expression (E) of ER stress, UPR, and DNA damage in HA-NT and HA-Ras treated with YTX-7739 (1μM) or CAY10566 (0.5μM) for 48 h. (F-G) Relative mRNA expression as compared to HA-NT DMSO (control) (F) and immunoblot analysis (G) of ER stress, UPR, JNK, and apoptosis in 83 treated with YTX-7739 (1μM) or its combination with AZD8330 (MEKi, 1μM), AZD0364 (ERKi, 1μM) for 72 hours. (H) Cell viability of 83 treated with YTX-7739 (1μM), CAY10566 (0.5 μM), or their combination with MEKi and ERKi (0.25–0.5μM) for 96 hours. (I) Immunoblot analysis of MGG6, MGG8, and M120 expressing a control vector or HRASG12V and (J) cell viability after treatment with YTX-7739 for 96h (J). ****P<0.0001; *** P<0.001; **P<0.01; *P<0.05; ns, not significant.
Figure 5:
Figure 5:. MEK-ERK signaling inhibits AMPK activity and defines the therapeutic response to DNLS inhibitors.
(A) Cell viability of 83/83R treated with YTX-7739 (0.25–1μM) and CAY10566 (0.125–0.5μM) for 96h. (B) Relative mRNA expression of UPR markers CHOP and GADD34 in 83/83R treated with DMSO (control) or YTX-7739 (1μM) for 72h. (C) Immunoblot analysis of ERK and AMPK signaling in 83/83R and M76/M76R. (D) Immunoblot analysis of ERK and AMPK signaling in transformed astrocytes on days 4 and 8 after expressing control (HA-NT) or HRASG12V (HA-Ras). (E) Immunoblot analysis of ERK and AMPK activity in 83 treated with MEK and ERK inhibitors. (F) Relative mRNA expression as compared to DMSO (control) of UPR markers CHOP and GADD34 in 83 Ctrl, AMPKa1, and AMPKa2 treated with or YTX-7739 (1μM) for 72h. (G) Representative micrographs of 83 expressing Ctrl, AMPKa1, or AMPKa2 after treatment with YTX-7739 (1μM) Scale bar: 100μm. (H) Cell viability of M76 after treatment with YTX-7739 (0.25–1μM) or CAY10566 (0.125–0.5μM) for 96h. (I) Immunoblot analysis of AMPK signaling in 83 cultured in decreasing concentrations of Glucose for 24–48h. (J) Cell viability of 83 cultured in decreasing concentrations of Glucose and concomitantly treated with YTX-7739 for 72h. ****P<0.0001; *** P<0.001; **P<0.01; *P<0.05.
Figure 6:
Figure 6:. AMPK reverts lipotoxicity by altering lipid composition.
(A) Micrographs and spheres count in 83 Ctrl, AMPKa1, and AMPKa2 thirty days following two rounds of transduction with shCtrl or shSCD lentivirus. Scale bar, 50μm. (B) 83-Fluc Ctrl or AMPKa1 GSCs were transduced with shCtrl or shSCD1 and intracranially implanted in mice (n=3). Representative images and longitudinal Fluc imaging of mice in each group. (C) Total lipids in untreated (DMSO) and treated (YTX) 83 Ctrl/AMPK for 72h. (D) Desaturation index (DI) of 16:0 and 18:0 in 83 Ctrl/AMPK treated with YTX-7739 for 72h. (E) PCA of individual lipid species from untreated and treated 83 Ctrl/AMPK. Percentage of total variance explained by individual principal components (PC1 and PC2). (F) Fluorescence imaging and quantification of lipid droplets (LD) in GSC expressing Ctrl, AMPKa1, and AMPKa2. Scale bar, 25 μm (G) Heatmap of CE and DG after YTX-7739 treatment for 72h. (H) The amount of TG with 0–10 carbon bonds in 83 Ctrl/AMPK treated with YTX-7739 for 72h. (I) Relative expression of UPR markers in 83 supplemented with BSA or C16:0 (300μM) ± OAG (60μM). (J) Immunoblot analysis of 83 treated with YTX-7739 (1μM) ± OAG. (K) Cell viability of M76 co-treated with YTX-7739 (0.5μM) and OAG (60μM) in addition to DGAT1i and GAT2i for 96h. ****P<0.0001; *** P<0.001; **P<0.01; *P<0.05; ns, not significant.

Comment in

References

    1. Lathia JD, Mack SC, Mulkearns-Hubert EE, Valentim CL, Rich JN, Cancer stem cells in glioblastoma. Genes & development 29, 1203–1217 (2015); published online EpubJun 15 (10.1101/gad.261982.115). - DOI - PMC - PubMed
    1. Badr CE, Silver DJ, Siebzehnrubl FA, Deleyrolle LP, Metabolic heterogeneity and adaptability in brain tumors. Cellular and molecular life sciences : CMLS 77, 5101–5119 (2020); published online EpubDec (10.1007/s00018-020-03569-w). - DOI - PMC - PubMed
    1. Koundouros N, Poulogiannis G, Reprogramming of fatty acid metabolism in cancer. British journal of cancer 122, 4–22 (2020); published online EpubJan (10.1038/s41416-019-0650-z). - DOI - PMC - PubMed
    1. Pearson JRD, Regad T, Targeting cellular pathways in glioblastoma multiforme. Signal Transduct Target Ther 2, 17040 (2017)10.1038/sigtrans.2017.40). - DOI - PMC - PubMed
    1. Garcia D, Shaw RJ, AMPK: Mechanisms of Cellular Energy Sensing and Restoration of Metabolic Balance. Mol Cell 66, 789–800 (2017); published online EpubJun 15 (10.1016/j.molcel.2017.05.032). - DOI - PMC - PubMed

Publication types