. 2023 Jan 17;4(1):100897.
doi: 10.1016/j.xcrm.2022.100897.

Circulating uridine dynamically and adaptively regulates food intake in humans

Affiliations

Circulating uridine dynamically and adaptively regulates food intake in humans

Ruth Hanssen et al. Cell Rep Med. .

Abstract

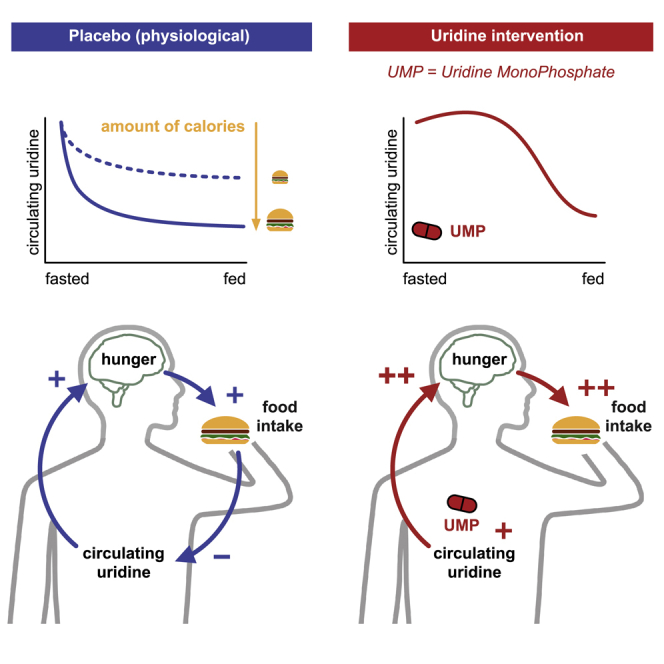
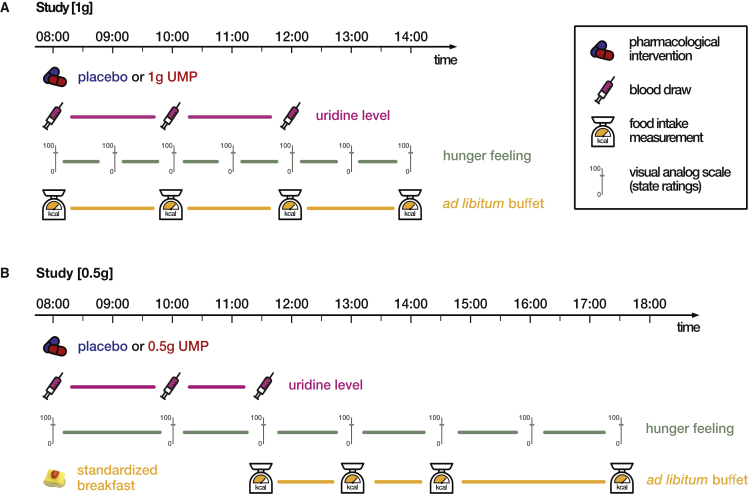
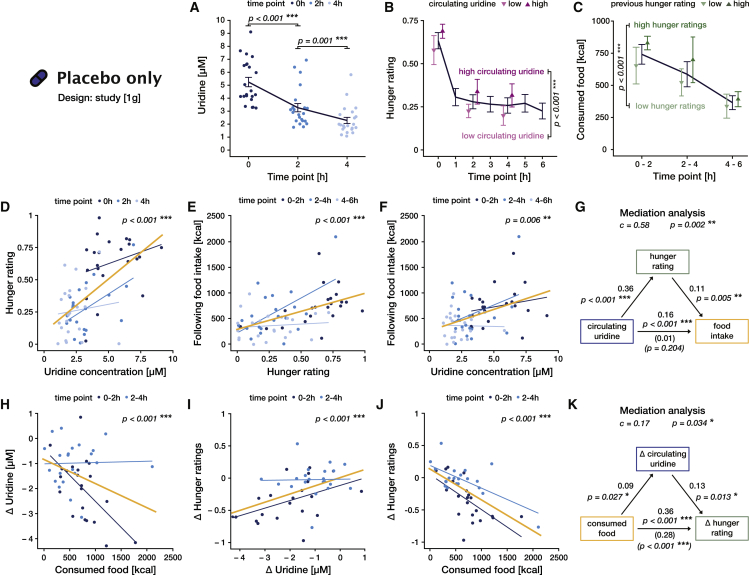
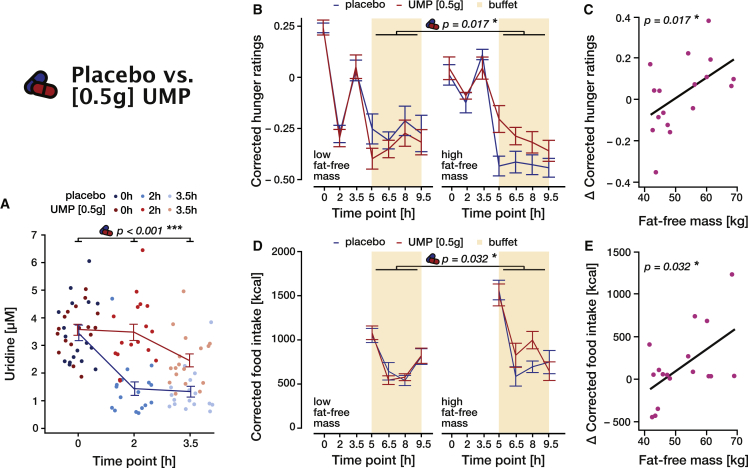
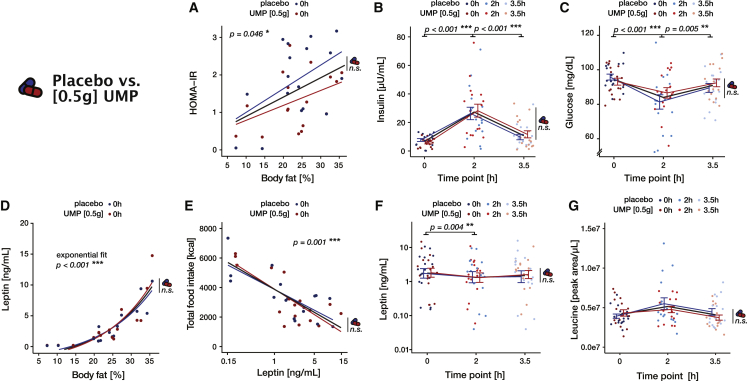
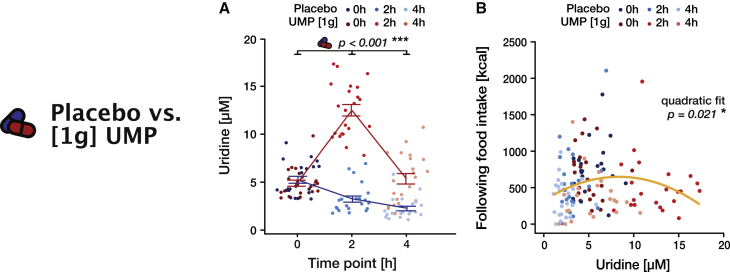
Feeding behavior must be continuously adjusted to match energy needs. Recent discoveries in murine models identified uridine as a regulator of energy balance. Here, we explore its contribution to the complex control of food intake in humans by administering a single dose of uridine monophosphate (UMP; 0.5 or 1 g) to healthy participants in two placebo-controlled studies designed to assess food behavior (registration: DRKS00014874). We establish that endogenous circulating uridine correlates with hunger and ensuing food consumption. It also dynamically decreases upon caloric ingestion, prompting its potential role in a negative feedback loop regulating energy intake. We further demonstrate that oral UMP administration temporarily increases circulating uridine and-when within the physiological range-enhances hunger and caloric intake proportionally to participants' basal energy needs. Overall, uridine appears as a potential target to tackle dysfunctions of feeding behavior in humans.

Keywords: adaptive behavior; food intake; hunger; uridine.


Conflict of interest statement

Declaration of interests O.A.C. reports grants or contracts from Amplyx, Basilea, BMBF, Cidara, DZIF, EU-DG RTD (101037867), F2G, Gilead, Matinas, MedPace, MSD, Mundipharma, Octapharma, Pfizer, and Scynexis; consulting fees from Amplyx, Biocon, Biosys, Cidara, Da Volterra, Gilead, Matinas, MedPace, Menarini, Molecular Partners, MSG-ERC, Noxxon, Octapharma, PSI, Scynexis, and Seres; honoraria for lectures from Abbott, Al-Jazeera Pharmaceuticals, Astellas, Grupo Biotoscana/United Medical/Knight, Hikma, MedScape, MedUpdate, Merck/MSD, Mylan, and Pfizer; payment for expert testimony from Cidara; participation on a data safety monitoring board or advisory board from Actelion, Allecra, Cidara, Entasis, IQVIA, Janssen, MedPace, Paratek, PSI, and Shionogi; a pending patent from the German Patent and Trade Mark Office; and other interests from DGHO, DGI, ECMM, ISHAM, MSG-ERC, and Wiley.

Figures

None
Graphical abstract
Figure 1
Figure 1
Study design (A) Study with 1 g UMP. Participants arrived fasted at the testing site at 8:00 a.m. A baseline blood sample was taken, and the body composition analyzed on an impedance scale. Participants then received 1 g UMP dissolved in orange juice or pure orange juice as placebo condition and were given access to a personal buffet, from which they could serve themselves ad libidum. Further blood draws followed at 10:00 a.m. (after 2 h) and at 12:00 p.m. (after 4 h). Every hour, participants were asked to rate their hunger levels on a continuous 100 mm visual analog scale (VAS). Food intake was assessed every 2 h by weighting missing items from the buffet. The experiment ended at 2:00 p.m. with a short debriefing. (B) Study with 0.5 g UMP. Participants arrived fasted at the testing site at 8:00 a.m., and a baseline blood sample was taken. They then received a standardized breakfast (686 kcal) with either 0.5 g UMP dissolved in orange juice or pure orange juice as placebo condition. Next, the body composition was analyzed on an impedance scale. Further blood samples were taken at 10:00 (after 2 h) and 11:30 a.m. (after 3.5 h). A personal buffet was served at 11:30 a.m. and refilled every 1.5 h, measuring the missing amount of food at the same time. VASs were used to measure hunger ratings at 8:00 and 10:00 a.m. and every 1.5 h from 11:30 a.m. onward. Behavioral tasks were used as distraction lasting for 15 min at 11:15 a.m. and 12:30, 2:00, and 3:30 p.m. The experiment ended at 5:30 p.m. with a short debriefing. UMP, uridine monophosphate.
Figure 2
Figure 2
Uridine regulates hunger and food intake in a feedback loop under physiological conditions (study [1 g], placebo) (A–C) Lines and error bars represents the mean and SEM, respectively. (A) Blood uridine level as a function of time. Lighter colors represent later time points. Statistics correspond to post-hoc comparisons between time points (Table S35). (B) Hunger ratings as a function of time. Purple points represent average ratings for the half of the participants with the highest (dark) or lowest (light) circulating uridine levels at each time point (median split). Statistics correspond to the main effect of uridine on hunger (Table S5). (C) Caloric intake in each time bin. Green points represent average intake for the half of the participants with the highest (dark) or lowest (light) hunger ratings at the beginning of the time bin. Statistics correspond to the main effect of hunger on food intake (Table S8). (D–F and H–J) Thin blue lines are the best linear fit for each time point (same color code as for data points and in A). Yellow lines represent the linear fit across all timepoints, i.e., for the whole time span of the buffet. All p values correspond to the main effect of the variable in the x axis on the variable in the y axis (see supplemental tables for details). (D) Effect of blood uridine levels on hunger. Higher uridine levels predicted higher hunger ratings at the same time point (Table S5). (E) Effect of hunger on food intake. Higher hunger levels predicted higher food intake in the next 2 h (Table S8). (F) Effect of blood uridine levels on food intake. Higher uridine levels predicted higher food intake in the next 2 h (Table S6). (G) Graphical representation of the mediation analysis uridine → hunger → following food intake (Table S7). Top left arrow represents the influence of uridine (dependent variable) on hunger ratings (mediator). Top right arrow represents the influence of hunger ratings on following food intake (independent variable), controlling for uridine. Bottom arrow represents the effect of uridine on following food intake either overall (total effect, values above) or once removed the effect mediated by hunger (direct effect, values below in parentheses). Values correspond to the standardized effect size ω2 and the sign, the direction of the effect. Global statistics on top quantify the relative size and significance of the mediation itself (difference between the total and direct effect). (H) Effect of food consumed within 2 h on the change of blood uridine levels (Δ uridine = uridine after – uridine before). Higher amount of consumed kcal predicted a stronger decrease in blood uridine concentrations (Table S12). (I) Effect of the change in uridine concentration on the change of hunger level (Δ hunger ratings = hunger rating after – hunger rating before). A stronger drop in uridine levels predicted a stronger post-prandial decrease in hunger ratings (Table S13). (J) Effect of consumed food within 2 h on the change of hunger ratings. Higher amount of consumed kcal predicted a stronger decrease in hunger ratings (Table S11). (K) Graphical representation of the mediation analysis consumed food → Δ uridine → Δ hunger ratings (Table S14), similar to (G).
Figure 3
Figure 3
Effect of 0.5 g oral UMP on blood uridine, food intake, and hunger (study [0.5 g]) In all panels, placebo is indicated in blue and intervention (0.5 g UMP) in red. Lines and error bars represent the mean and SEM, respectively. (A) Blood uridine levels over time for placebo and 0.5 g UMP conditions (Table S17). (B) Food intake over time for placebo and 0.5 g UMP conditions separated for high and low fat-free body mass by a median split. Displayed values were corrected for confounds (fat mass and dinner size, sport, and late snacking the day prior to the testing day) by regressing out their effect beforehand. The p value corresponds to the intervention × fat-free mass interaction effect on the total food intake (Table S20). (C) Increase in total food intake due to the intervention (Δ total food intake = total food intake under UMP – total food intake under placebo) as a function of fat-free body mass. The p value corresponds to the intervention × fat-free mass interaction term (Table S20). (D) Hunger ratings over time for placebo and 0.5 g UMP conditions, corrected for the initial hunger (average ratings before the buffet) and separated for high and low fat-free body mass by median split. The p value corresponds to the intervention × fat-free mass interaction on total average corrected ratings (Table S19). (E) Increase in average hunger ratings during the buffet due to the intervention (Δ hunger ratings = ratings under UMP – ratings under placebo) as a function of fat-free body mass. The p value corresponds to the intervention × fat-free mass interaction term (Table S19). See also Figure S6.
Figure 4
Figure 4
Metabolic profile of the participants in the study [0.5 g] (A) Insulin resistance as measured by HOMA-IR = (fasting glucose [mg/dL] × fasting insulin [mU/L])/405 as a function of adiposity. Linear fit (Table S21). (B and C) Serum insulin (B) and glucose (C) as a function of time. Statistics correspond to the post-hoc comparison between time points (Tables S22 and S23). (D) Basal serum leptin increases exponentially as a function of adiposity. Statistics correspond to the fitted model: leptin ∼ β0 + exp(β1∗bodyfat) (Table S24). (E) Total food intake as a function of the (log−) basal serum leptin. Linear fit. (Table S25). (F and G) Serum leptin (log scale) (F) and leucine (G) as a function of time. Statistics correspond to the post-hoc comparison between time points (Tables S26 and S27). In all panels, placebo and intervention (0.5 g UMP) are shown in blue and red, respectively. Thin lines and error bars represent the mean and SE (B, C, F, and G) or the best fit (A, D, and E) for each session, thick black lines the grand average, and lighter colors mean later time points. The pill symbol with “n.s.” indicates the absence of any significant difference (main effect or interaction) between the UMP and the placebo conditions. See also Figures S1–S3.
Figure 5
Figure 5
Effect of 1 g UMP on blood uridine and food intake (study [1 g]) In all panels, placebo is indicated in blue and intervention (1 g UMP) in red. (A) Blood uridine levels over time for placebo and 1 g UMP (Table S21). Lines and error bars represent the mean and SEM, respectively. (B) Food intake in each 2 h time bin as a function of uridine levels measured before the time bin. The yellow line represents the best quadratic fit across all time points and conditions; the p value refers to this quadratic effect (Table S25).

Comment in

References

    1. Connolly G.P., Duley J.A. Uridine and its nucleotides: biological actions, therapeutic potentials. Trends Pharmacol. Sci. 1999;20:218–225. doi: 10.1016/s0165-6147(99)01298-5. - DOI - PubMed
    1. Zhang Y., Guo S., Xie C., Fang J. Uridine metabolism and its role in glucose, lipid, and amino acid homeostasis. BioMed Res. Int. 2020;2020:7091718. doi: 10.1155/2020/7091718. - DOI - PMC - PubMed
    1. Yamamoto T., Koyama H., Kurajoh M., Shoji T., Tsutsumi Z., Moriwaki Y. Biochemistry of uridine in plasma. Clin. Chim. Acta. 2011;412:1712–1724. doi: 10.1016/j.cca.2011.06.006. - DOI - PubMed
    1. Karle J.M., Anderson L.W., Erlichman C., Cysyk R.L. Serum uridine levels in patients receiving N-(phosphonacetyl)-L-aspartate. Cancer Res. 1980;40:2938–2940. - PubMed
    1. Traut T.W. Physiological concentrations of purines and pyrimidines. Mol. Cell. Biochem. 1994;140:1–22. doi: 10.1007/BF00928361. - DOI - PubMed

Publication types