. 2023 Feb;29(2):348-357.
doi: 10.1038/s41591-023-02219-5. Epub 2023 Jan 18.

Real-world COVID-19 vaccine effectiveness against the Omicron BA.2 variant in a SARS-CoV-2 infection-naive population

Affiliations

Real-world COVID-19 vaccine effectiveness against the Omicron BA.2 variant in a SARS-CoV-2 infection-naive population

Jonathan J Lau et al. Nat Med. 2023 Feb.

Erratum in

Abstract

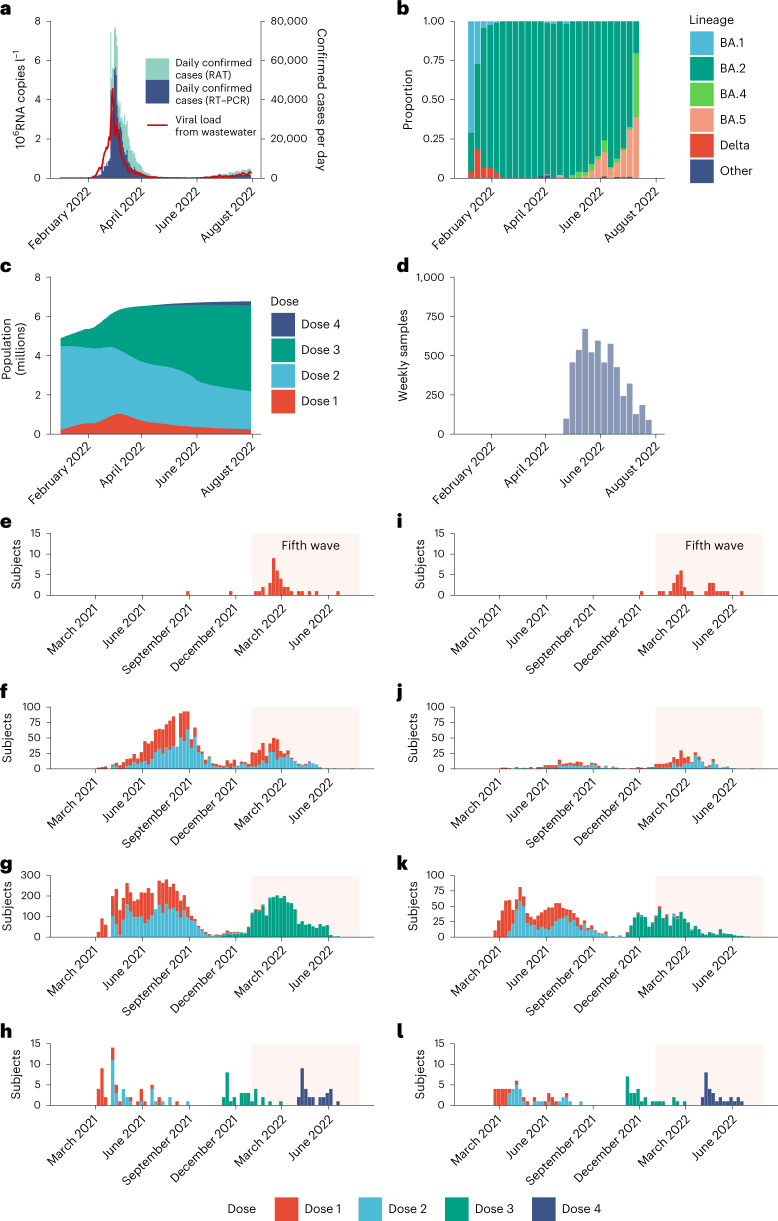
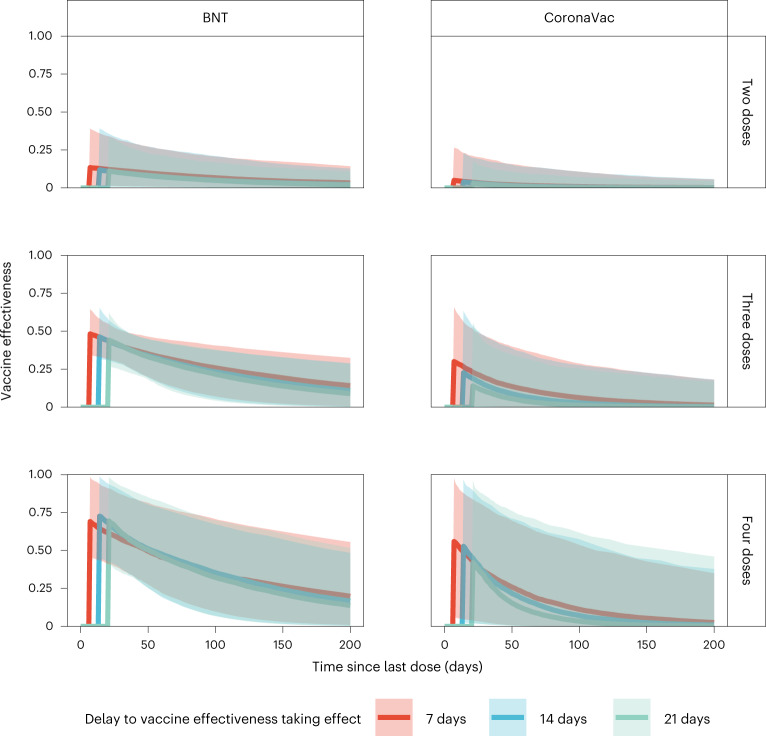
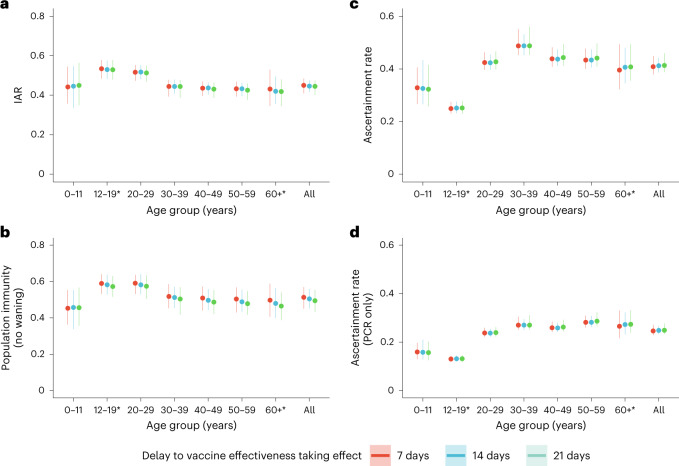
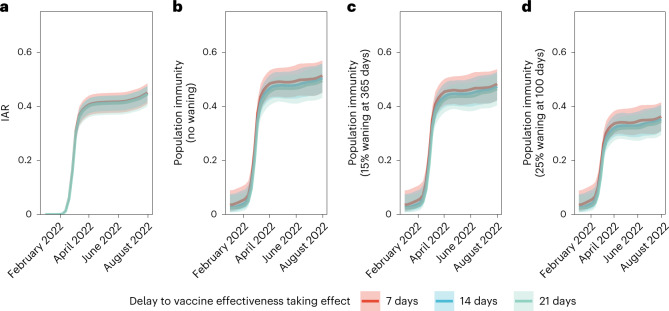
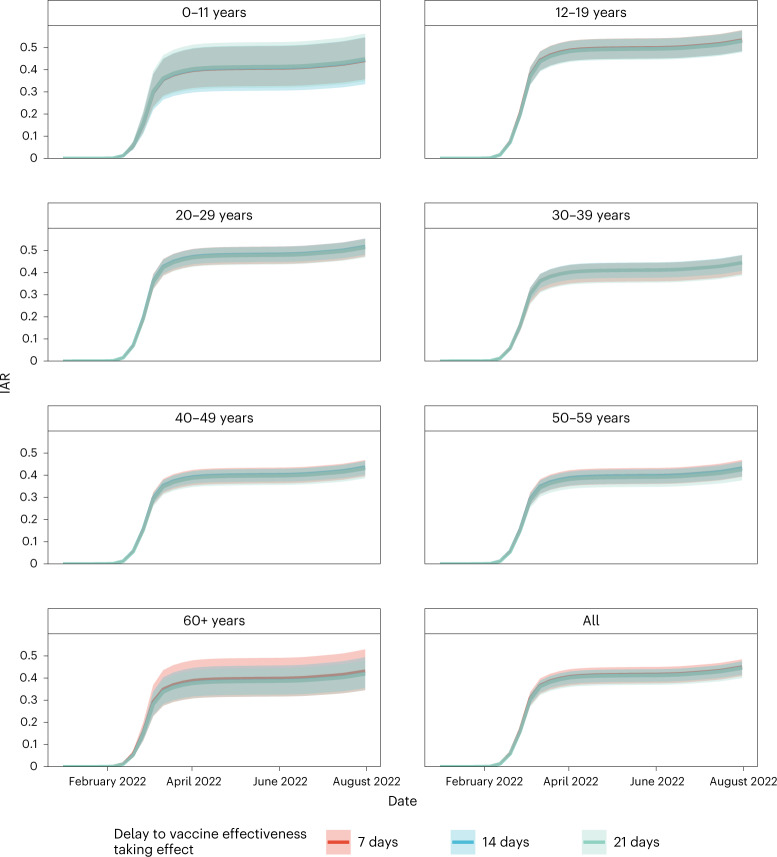
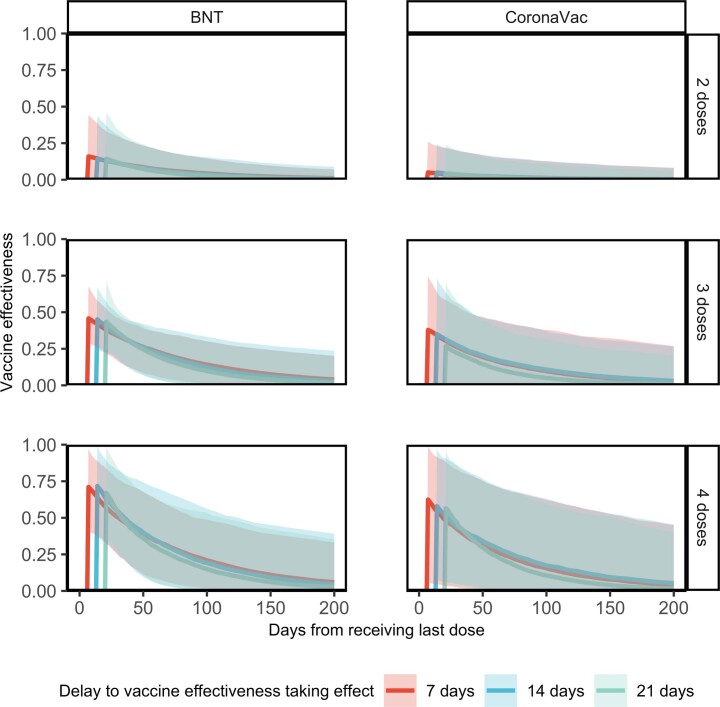
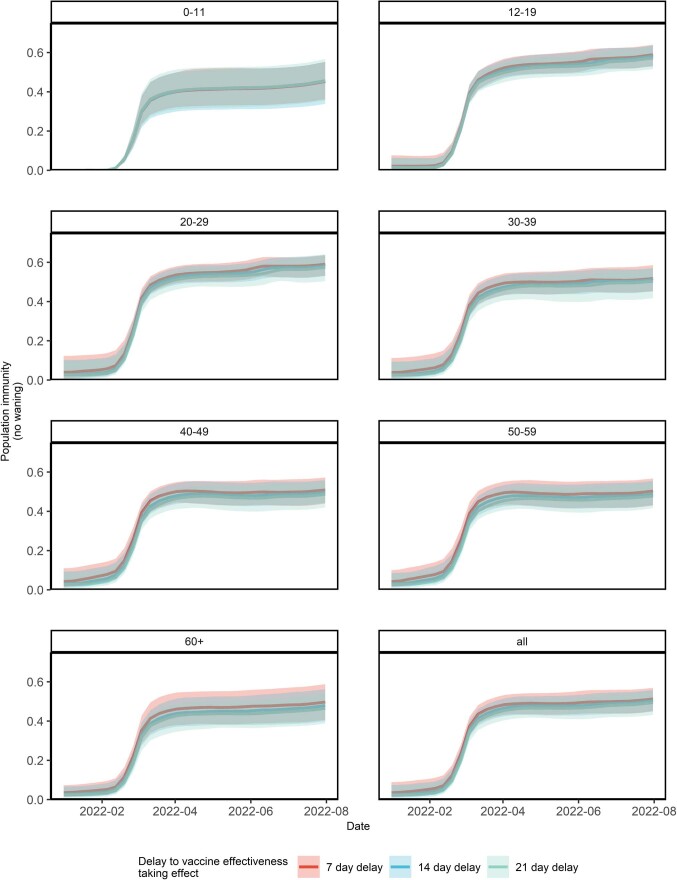
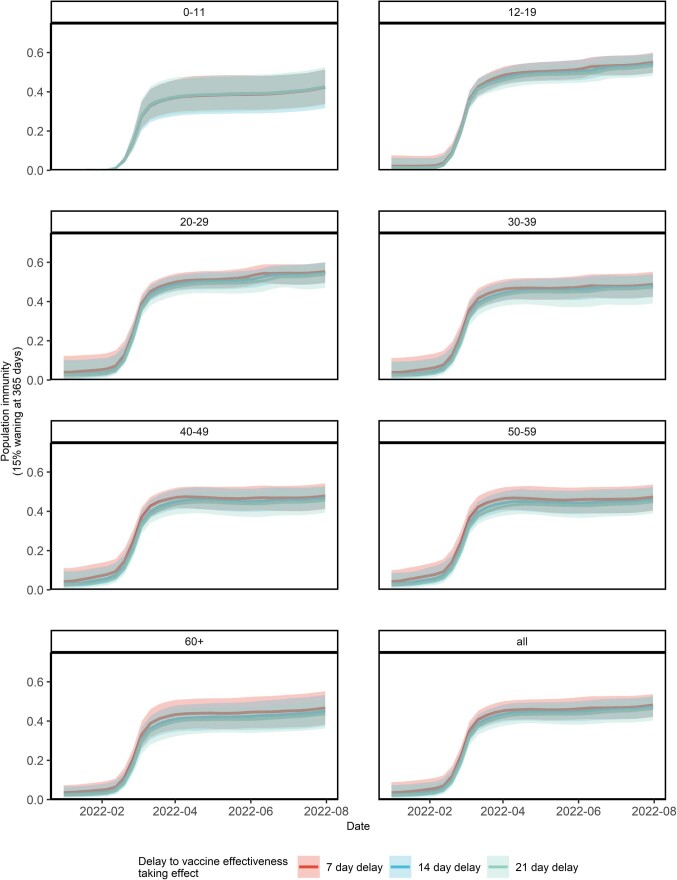
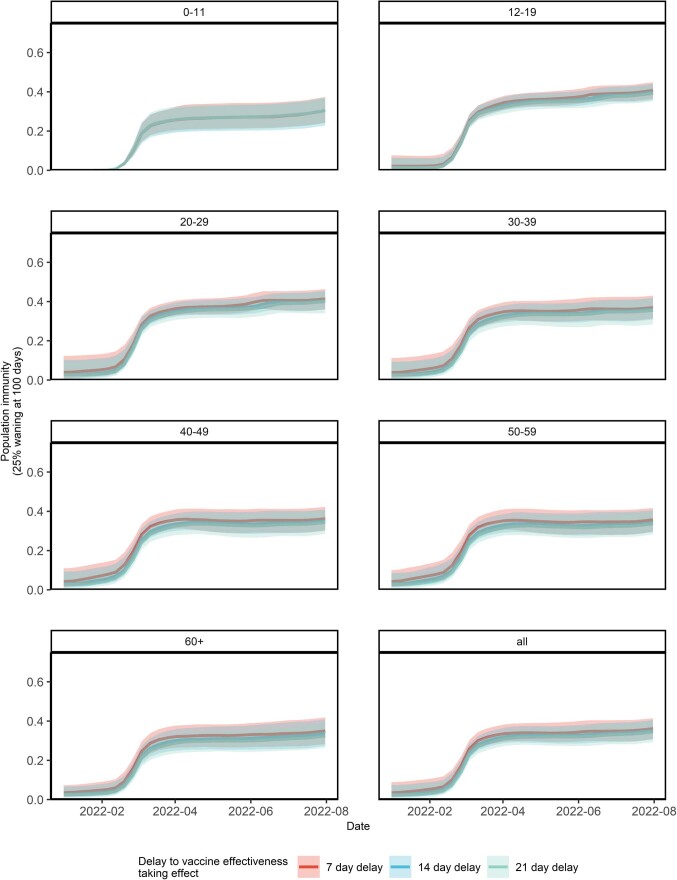
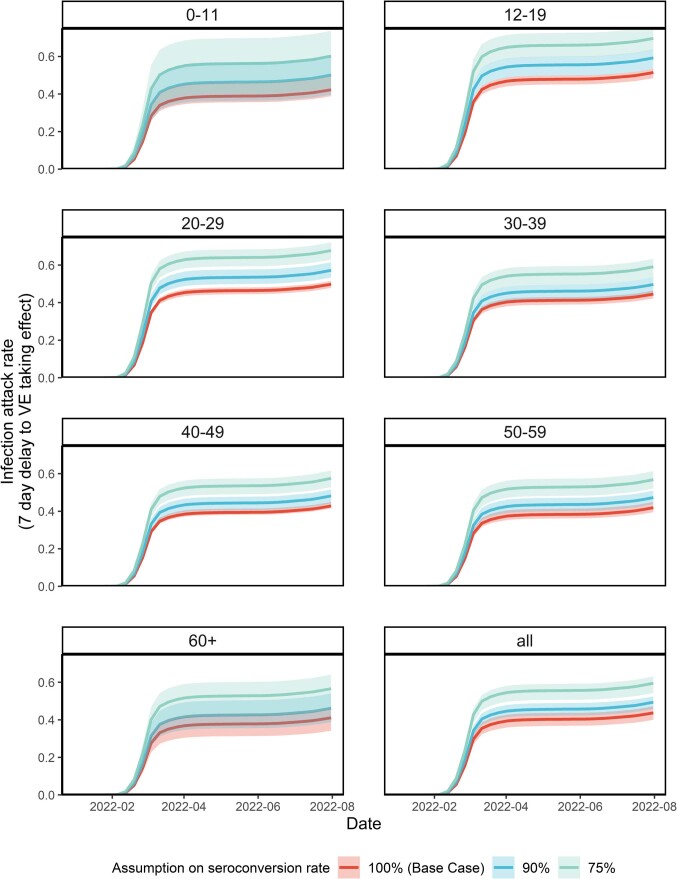
The SARS-CoV-2 Omicron variant has demonstrated enhanced transmissibility and escape of vaccine-derived immunity. Although first-generation vaccines remain effective against severe disease and death, robust evidence on vaccine effectiveness (VE) against all Omicron infections, irrespective of symptoms, remains sparse. We used a community-wide serosurvey with 5,310 subjects to estimate how vaccination histories modulated risk of infection in infection-naive Hong Kong during a large wave of Omicron BA.2 epidemic in January-July 2022. We estimated that Omicron infected 45% (41-48%) of the local population. Three and four doses of BNT162b2 or CoronaVac were effective against Omicron infection 7 days after vaccination (VE of 48% (95% credible interval 34-64%) and 69% (46-98%) for three and four doses of BNT162b2, respectively; VE of 30% (1-66%) and 56% (6-97%) for three and four doses of CoronaVac, respectively). At 100 days after immunization, VE waned to 26% (7-41%) and 35% (10-71%) for three and four doses of BNT162b2, and to 6% (0-29%) and 11% (0-54%) for three and four doses of CoronaVac. The rapid waning of VE against infection conferred by first-generation vaccines and an increasingly complex viral evolutionary landscape highlight the necessity for rapidly deploying updated vaccines followed by vigilant monitoring of VE.


Conflict of interest statement

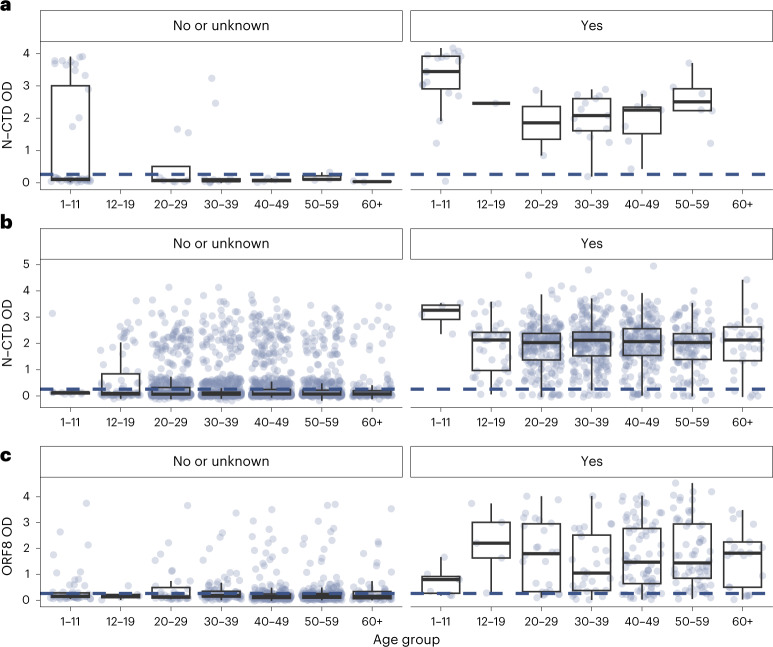
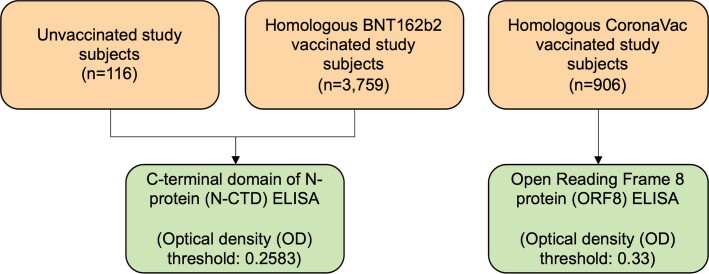
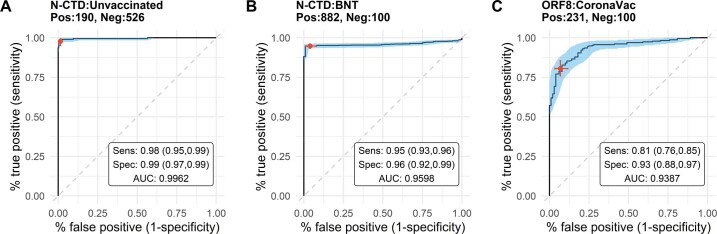
A.H., M.P. and S.A.V. have filed an IDF (US 63/016,898) for the use of ORF8 and ORF3b as diagnostics of SARS-CoV-2 infection. M.M. produced ORF8 by patent process based on US Patents 8,507,220 and 8,586,826. The other authors declare no competing interests.

Figures

Fig. 1
Fig. 1. Daily COVID-19 confirmed cases, SARS-CoV-2 wastewater viral load, weekly proportion of SARS-CoV-2 lineages, population vaccination coverage, sera collection history and study subject vaccination history.
a, Daily confirmed COVID-19 cases in Hong Kong stratified by cases confirmed by RT–PCR or RAT, superimposed against 2-day running geometric mean viral load per capita (in millions of copies of SARS-CoV-2 RNA l−1) detected in city-wide wastewater surveillance. b, Weekly proportion of SARS-CoV-2 lineages detected in Hong Kong via genome sequencing as uploaded to GISAID by 14 September 2022. c, Total population with one to four doses of BNT162b2 and/or CoronaVac in Hong Kong. d, Number of serum samples collected weekly. eh, Vaccination history for study participants with one (e), two (f), three (g) and four (h) homologous doses of BNT162b2 at the time of sample collection. il, Vaccination history for study participants with one (i), two (j), three (k) and four (l) homologous doses of CoronaVac at the time of sample collection. The shaded areas in el correspond to the duration of the fifth wave from 1 January to 31 July 2022.
Fig. 2
Fig. 2. SARS-CoV-2 N-CTD and ORF8 antibody responses among study subjects by vaccination history, age and self-reported infection history.
ac, Unvaccinated (n = 116 subjects) (a), BNT homologously vaccinated (n = 3,759 subjects) (b) and CoronaVac homologously vaccinated (n = 906 subjects) (c). Panels on the left correspond to individuals with no self-reported infection history or who did not provide their infection history. Panels on the right correspond to individuals with self-reported infection history. The blue dotted line corresponds to the OD thresholds for seropositivity (N-CTD OD of 0.2583 for unvaccinated and BNT homologously vaccinated, and ORF8 OD of 0.33 for CoronaVac homologously vaccinated). Each dot represents one study subject. The center line of each box represents the median, box limits represent the interquartile range (IQR), and the whiskers represent the minimum and maximum observations greater and lesser than the IQR plus 1.5× IQR, respectively.
Fig. 3
Fig. 3. Estimated VE.
VE at 0 to 200 days from receipt of last dose. VE is presented separately over time for two, three or four homologous doses of BNT162b2 (BNT) or CoronaVac. The lines indicate posterior medians and shaded bars indicate 95% credible intervals based on the fitted model.
Fig. 4
Fig. 4. Estimated IAR, population immunity and ascertainment ratio.
a, Cumulative IAR by 31 July 2022. b, Cumulative population immunity from infection and vaccination, assuming no waning of immunity from natural infection, by 31 July 2022. c,d, Ascertainment rate based on all cumulative confirmed cases (c) or cumulative RT–PCR-confirmed cases only (d). All analyses were stratified by assumptions on delay to VE taking effect and age group. The dots indicate posterior medians and the lines indicate 95% credible intervals based on the fitted model. *Cumulative IAR, population immunity and ascertainment rate estimates among those aged 12–19 or 60 and above were less accurate because no subjects were between 12 and 17 years old, and few were above 65 years old.
Fig. 5
Fig. 5. IAR and population immunity over time.
a, IAR over time. bd, Population immunity over time from infection and vaccination, assuming no waning of immunity from natural infection (b), immunity from infection wanes by 15% after 365 days (c) and immunity from infection wanes by 25% after 100 days (d). All analyses were stratified by assumptions on delay to VE taking effect. The lines indicate posterior medians and shaded bars indicate 95% credible intervals based on the fitted model.
Fig. 6
Fig. 6. IAR over time by age group.
IAR estimates among those aged 12–19 or 60 and above were less accurate because no subjects were between 12 and 17 years old, and few were above 65 years old. The lines indicate posterior medians and shaded bars indicate 95% credible intervals based on the fitted model.
Extended Data Fig. 1
Extended Data Fig. 1. The effect of age on force of infection (FOI) (that is f(a) in the model).
Individuals aged 35 years served as the reference group. The solid line indicates the posterior median, and the shaded regions indicate the 95% credible interval based on the fitted model, differentiated by assumption on delay to vaccine effectiveness taking effect.
Extended Data Fig. 2
Extended Data Fig. 2. Use of ELISA assay to discriminate infection from vaccine immunity by vaccination cohort.
This figure summarizes the in-house ELISA assays (green) we used to test for seropositivity amongst study subjects in different vaccination cohorts (orange). We did not test for seropositivity amongst heterologously vaccinated study subjects, study subjects who received vaccines other than BNT162b2 or CoronaVac, or study subjects with an un-determined vaccination history.
Extended Data Fig. 3
Extended Data Fig. 3. Description of controls, assay performance and Receiver Operating Curves (ROC) by ELISA assay type for detecting Omicron infection with in-house ELISA protocols.
(a) N-CTD ELISA amongst unvaccinated controls, tested against 48 unvaccinated study subjects with self-reported infection history, 142 unvaccinated RT-PCR positive convalescent samples ranging from 30 to 401 days after onset of illness and 526 pre-pandemic negative controls; (b) N-CTD ELISA amongst controls who were homologously vaccinated with BNT162b2, tested against 881 BNT-vaccinated study subjects with self-reported infection history, 1 BNT-vaccinated RT-PCR positive convalescent sample collected 369 days after onset of illness and 50 (tested twice) non-infected BNT-vaccinated samples collected during 2020–2021, a period of minimal community transmission; and (c) ORF8 ELISA amongst controls who were homologously vaccinated with CoronaVac, tested against 231 CoronaVac-vaccinated study subjects with self-reported infection history and 100 non-infected CoronaVac-vaccinated samples collected during 2020–2021, a period of minimal community transmission. Shaded areas indicate 95% confidence region. Red dot and cross represent the median sensitivity and specificity and corresponding confidence intervals of the OD threshold jointly estimated via Gibbs Sampling as described in Methods. Pos: positive controls, Neg: negative controls, Sens: sensitivity, Spec: specificity, AUC: area under the curve.
Extended Data Fig. 4
Extended Data Fig. 4. Vaccine effectiveness over time only including samples collected on or before 15 June 2022.
VE at zero to 200 days from receipt of last dose. VE is presented separately over time for two, three or four homologous doses of BNT162b2 (BNT) or CoronaVac. The lines indicate posterior medians and shaded bars indicate 95% credible intervals based on the fitted model.
Extended Data Fig. 5
Extended Data Fig. 5. Population immunity over time from vaccination and infection by age group assuming no waning of immunity from infection.
Population immunity estimates among those aged 12–19 or aged 60 or above were less accurate as no subjects were between 12 and 17 years old, and few were above 65 years old. The lines indicate posterior medians and shaded bars indicate 95% credible intervals based on the fitted model.
Extended Data Fig. 6
Extended Data Fig. 6. Population immunity over time from vaccination and infection by age group assuming immunity from infection wanes by 15% after 365 days.
Population immunity estimates among those aged 12–19 or aged 60 or above were less accurate as no subjects were between 12 and 17 years old, and few were above 65 years old. The lines indicate posterior medians and shaded bars indicate 95% credible intervals based on the fitted model.
Extended Data Fig. 7
Extended Data Fig. 7. Population immunity over time from vaccination and infection by age group assuming immunity from infection wanes by 25% after 100 days.
Population immunity estimates among those aged 12–19 or aged 60 or above were less accurate as no subjects were between 12 and 17 years old, and few were above 65 years old. The lines indicate posterior medians and shaded bars indicate 95% credible intervals based on the fitted model.
Extended Data Fig. 8
Extended Data Fig. 8. IAR over time by age group and assumptions on seroconversion rate among infected.
All figures assumed a 7-day delay to VE taking effect. IAR estimates among those aged 12–19 or aged 60 or above were less accurate as no subjects were between 12 and 17 years old, and few were above 65 years old. The lines indicate posterior medians and shaded bars indicate 95% credible intervals based on the fitted model.

References

    1. Statistics on 5th Wave of COVID-19 (from 31 Dec 2021 up till 31 Jul 2022 00:00) (The Government of the Hong Kong Special Administrative Region, 2022); https://www.coronavirus.gov.hk/pdf/5th_wave_statistics/5th_wave_statisti...
    1. Modelling the Fifth Wave of COVID-19 in Hong Kong – Update #9 (The Univ. of Hong Kong, 2022); https://www.med.hku.hk/en/news/press//-/media/HKU-Med-Fac/News/slides/20...
    1. Morvan M, et al. An analysis of 45 large-scale wastewater sites in England to estimate SARS-CoV-2 community prevalence. Nat. Commun. 2022;13:4313. - PMC - PubMed
    1. Amman F, et al. Viral variant-resolved wastewater surveillance of SARS-CoV-2 at national scale. Nat. Biotechnol. 2022;40:1814–1822. - PubMed
    1. Khoury DS, et al. Neutralizing antibody levels are highly predictive of immune protection from symptomatic SARS-CoV-2 infection. Nat. Med. 2021;27:1205–1211. - PubMed

Publication types

Supplementary concepts