. 2023 Jan;11(1):e005891.
doi: 10.1136/jitc-2022-005891.

Novel banana lectin CAR-T cells to target pancreatic tumors and tumor-associated stroma

Affiliations

Novel banana lectin CAR-T cells to target pancreatic tumors and tumor-associated stroma

Mary K McKenna et al. J Immunother Cancer. 2023 Jan.

Erratum in

Abstract

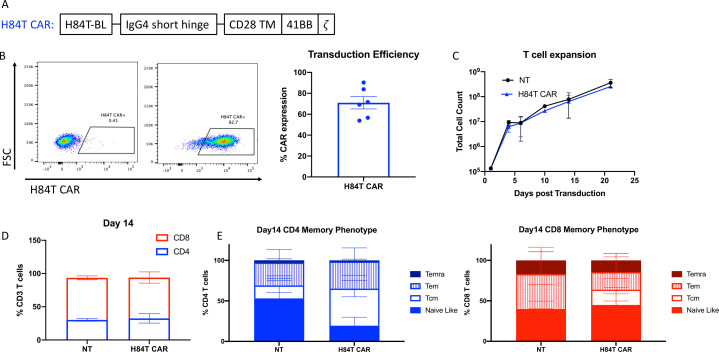
Background: Cell therapies for solid tumors are thwarted by the hostile tumor microenvironment (TME) and by heterogeneous expression of tumor target antigens. We address both limitations with a novel class of chimeric antigen receptors based on plant lectins, which recognize the aberrant sugar residues that are a 'hallmark' of both malignant and associated stromal cells. We have expressed in T cells a modified lectin from banana, H84T BanLec, attached to a chimeric antigen receptor (H84T-CAR) that recognizes high-mannose (asparagine residue with five to nine mannoses). Here, we tested the efficacy of our novel H84T CAR in models of pancreatic ductal adenocarcinoma (PDAC), intractable tumors with aberrant glycosylation and characterized by desmoplastic stroma largely contributed by pancreatic stellate cells (PSCs).

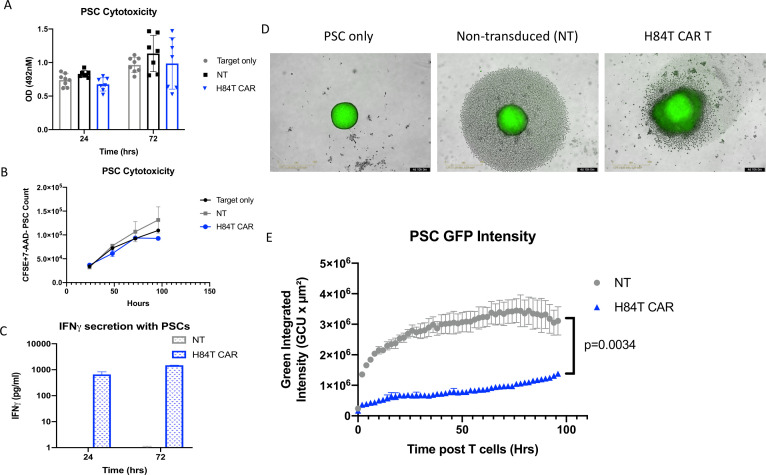
Methods: We transduced human T cells with a second-generation retroviral construct expressing the H84T BanLec chimeric receptor, measured T-cell expansion, characterized T-cell phenotype, and tested their efficacy against PDAC tumor cells lines by flow cytometry quantification. In three-dimensional (3D) spheroid models, we measured H84T CAR T-cell disruption of PSC architecture, and T-cell infiltration by live imaging. We tested the activity of H84T CAR T cells against tumor xenografts derived from three PDAC cell lines. Antitumor activity was quantified by caliper measurement and bioluminescence signal and used anti-human vimentin to measure residual PSCs.

Results: H84T BanLec CAR was successfully transduced and expressed by T cells which had robust expansion and retained central memory phenotype in both CD4 and CD8 compartments. H84T CAR T cells targeted and eliminated PDAC tumor cell lines. They also disrupted PSC architecture in 3D models in vitro and reduced total tumor and stroma cells in mixed co-cultures. H84T CAR T cells exhibited improved T-cell infiltration in multicellular spheroids and had potent antitumor effects in the xenograft models. We observed no adverse effects against normal tissues.

Conclusions: T cells expressing H84T CAR target malignant cells and their stroma in PDAC tumor models. The incorporation of glycan-targeting lectins within CARs thus extends their activity to include both malignant cells and their supporting stromal cells, disrupting the TME that otherwise diminishes the activity of cellular therapies against solid tumors.

Keywords: Receptors, Chimeric Antigen; Tumor Microenvironment.


Conflict of interest statement

Competing interests: CB is a St. Baldrick’s Foundation Scholar, has pending patent applications describing the use of engineered T and natural killer cells to enhance tumor targeting, including the use of H84T-BanLec effector cell targeting of SARS-CoV-2 and has received research funding from Merck Sharp & Dohme, Kiadis Pharma, and Bristol Myers Squibb. MKB is supported by National Cancer Institute Grants No. P50CA126752 and P01CA094237, by Stand Up To Cancer (SU2C)/American Association for Cancer Research (AACR) 604817 Meg Vosburg T-Cell Lymphoma Dream Team, and the Leukemia and Lymphoma Society. SU2C is a program of the Entertainment Industry Foundation administered by the AACR. MKB is a co-founder with equity: Allovir, Tessa Therapeutics and Marker Therapeutics. Scientific Advisory Boards: Bluebird Bio, Tessa Therapeutics, Marker Therapeutics, Allogene, Walking Fish, KUUR, Pharmaceuticals, Tscan, Poseida, Cell Genix and Turnstone Biologics. Royalties from Bellicum and Takeda. DMM was supported by a grant from the Forbes Institute of the Rogel Cancer Center at the University of Michigan and is an inventor on University of Michigan patents concerning H84T BanLec.

Figures

Figure 1
Figure 1. Glycan profile of PDAC tumor cell lines and primary PSCs. (A) Summary of N-glycan analysis by MALDI-TOF mass spectrometry for CFPAC-1, Panc-1, Capan-1, and PSCs. N-glycan profiling is described in detail in the methods section. (B) Cell surface detection of high-mannose expression by biotinylated H84T BanLec. PDAC tumor cells, PSCs, and activated T cells (ATCs) were stained with 0.4 µg/mL biotinylated H84T BanLec followed by APC streptavidin. Cells were stained with streptavidin alone (2° only) for control. Surface expression was analyzed by flow cytometry and mean fluorescent intensity is represented on histogram plots. BanLec, banana lectin; PDAC, pancreatic ductal adenocarcinoma; PSC, pancreatic stellate cells.
Figure 2
Figure 2. H84T CAR T-cell development. (A) Schematic diagram of retroviral CAR construct expressing H84T banana lectin binder with intracellular 41BB costimulatory domain and CD3z signaling domain. (B) H84T CAR expression was determined by flow cytometry with a rabbit anti-H84T antibody and goat anti-rabbit IgG Alexa Fluor 488 secondary antibody. Representative staining of one donor is shown in the plots on the left (left: non-transduced T cells; right: H84T CAR transduced). The average of six healthy donor T-cell transductions is quantified as percent CAR expression. (C) Average of five T-cell donor counts post transduction calculated by trypan blue counts. (D) Non-transduced (NT) and H84T CAR T cell CD4:CD8 ratio on day 14 post transduction quantified by flow cytometry. (E) Day 14 T-cell memory phenotype for CD4 (left) and CD8 (right) T cells. Memory T-cell populations were determined by cell surface expression of CCR7 and CD45RA staining quantified by flow cytometry. CAR, chimeric antigen receptor; Tcm, central memory; Teff, T effector cells; Temra,T cell effector memory.
Figure 3
Figure 3. Antitumor activity of H84T CAR T cells against PDAC tumor cell lines. (A) 4×10⁴ PDAC tumor cell lines were seeded in 96-well plates and 1×10⁴ NT or H84T CAR T cells were added. Tumor cell viability was determined by MTS assay at 24 hours and 72 hours post T-cell addition. Optical density (OD) values were obtained at 492 nm wavelengths. Averages of three technical triplicates of three different donor T cells are represented. P values determined by unpaired student’s t-test. (B) Co-culture of PDAC tumor cell lines with NT or H84T CAR T cells at a 4:1 ratio. Residual viable tumor cells labeled with GFP firefly luciferase were quantified by flow cytometry, 7-AAD staining and absolute counting beads. Samples were collected at 24, 48, 72, and 96 hours post T-cell addition. n=3–4 donors per cell line. P values determined by two-way analysis of variance comparing NT versus H84T; *p<0.05; **p<0.005;***p<0.0005; ****p<0.0001. (C) Supernatant from PDAC tumor cell lines cultured with NT or H84T CAR-T cells were collected 24 and 72 hours post T-cell addition (1:4 effector:target ratio). IFN-γ secretion was measured by ELISA assay. Average of three donors are represented. MTS, Tetrazolium Assay, 7-AAD; 7-aminoactionomycin D; CAR, chimeric antigen receptor; GFP;green fluorescent protein; IFN, interferon; PDAC, pancreatic ductal adenocarcinoma; NT, non-transduced.
Figure 4
Figure 4. Anti-stromal activity of H84T CAR T cells against PSCs. (A) 4×10⁴ primary PSCs were seeded in 96-well plates and 1×10⁴ NT or H84T CAR T cells were added. PSC cell viability was determined by MTS assay at 24 hours and 72 hours post T-cell addition. Optical density (OD) values were obtained at 492 nm wavelengths. Averages of three technical triplicates of seven different donor T cells are represented. (B) Primary PSCs were stained with CSFE and cultured with NT or H84T CAR T cells are 4:1 ratio. Residual viable PSCs were detected by CSFE+7-AAD and quantified by absolute count bright beads via flow cytometry. (C) Supernatant from PSCs cultured with NT or H84T CAR-T cells were collected 24 and 72 hours post T-cell addition (1:4 effector:target ratio). IFN-γ secretion was measured by ELISA assay. Averages of three donors are represented. (D) 4×10³ PSCs labeled with CSFE were seeded in 1% agarose coated 96-well plates and allowed to form spheroids for 24 hours. 2×10³ NT or H84T CAR T cells were then added and images were acquired every 2 hours for 4 days by the Incucyte Live imaging system. Representative image of one donor T cell and spheroids is shown 96 hours post T-cell addition. (E) The green integrated intensity of CSFE labeled PSC spheroids were quantified by Incucyte Live image analysis post T-cell addition over time. Results are an average of four technical replicates of three different donors. P value determined by two-way analysis of variance. CSFE, Carboxyfluorescein succinimidyl ester; 7-AAD, 7-aminoactinomycin D; GFP, green fluorescent protein; CAR, chimeric antigen receptor; IFN, interferon; PSC, pancreatic stellate cells.
Figure 5
Figure 5. Activity of H84T CAR T cells in heterogenous pancreatic ductal adenocarcinoma tumor models. (A) 2×10⁴ Panc-1 cells only or in combination with 2×10⁴ PSCs were cultured for 24 hours in 96-well plates. 5×10³ NT or H84T CAR T cells were then added and total viable tumor and PSCs were determined by MTS assay. Optical density was measured at 492 nm and tumor only control was normalized to 1. Measurements were acquired at 24 hours, 48 hours, and 72 hours post T-cell addition. (B) 2×10³ GFP labeled Panc-1 tumor cells and 8×10³ PSCs were co-cultured in 1% agarose coated 96-well plates for 48 hours. 1×10³ NT or H84T CAR T cells were then added and imaged on the Incucyte Live imaging system for another 48 hours. GFP intensity of tumor cells was quantified over time (right) and representative images at time 0 hour and 96 hours post T cells are shown. P value<0.001 determined by two-way analysis of variance (ANOVA). (C) 2×10³ GFP labeled CFPAC-1 tumor cells and 8×10³ PSCs were co-cultured in 1% agarose coated 96-well plates for 96 hours. 1×10³ NT or H84T CAR T cells labeled with cell tracker red were then added and spheroids were imaged every 2 hours on the whole well spheroid imaging setting. Spheroid images before T cells were added and 96 hours post T-cell addition is shown on the left. The red intensity of T cells quantified under the brightfield mask is graphed on the right (p<0.001 determined by two-way ANOVA). Quantification for determining T-cell signal within spheroids are further described in online supplemental figure 5 . CAR, chimeric antigen receptor; PSC, pancreatic stellate cells; NT, non-transduced; GFP, green fluorescent protein; MTS, MTS Tetrazolium assay.
Figure 6
Figure 6. In vivo antitumor and anti-stromal activity of H84T CAR-T cells against three different PDACs. (A) NSG MHC KO mice were engrafted subcutaneously with 1×10⁶ GFP-FfLuc labeled CFPAC-1 tumor cells and 1×10⁶ PSCs. Tumors were allowed to establish for 2 weeks and then 1×10⁶ NT or H84T CAR-T cells were intravenously delivered. (B) Tumor signal was quantified by bioluminescence signaling through IVIS imaging. N=4 mice per group. (C) Tumor volume was measured by the caliper and volume was calculated overtime. P value<0.001 determined by simple linear regression. (D) Residual tumors were resected on Day 36 post T-cell infusion and processed for H&E staining. Mean pixel density of H&E staining was quantified by ImageJ. Four sections per each tumor were quantified and graphed. N=3 tumors/NTR group and N=4 tumors/H84T group. P value determined by unpaired student’s t-test. (E, F) NSG MHC KO mice were engrafted subcutaneously with 2×10⁶ Panc-1 tumor cells and 2×10⁶ PSCs. Tumors were allowed to establish for 2 weeks and then 1×10⁶ NT or H84T CAR-T cells labeled with GFP-FfLuc were delivered intravenously. T-cell signal was quantified by bioluminescence signaling through IVIS imaging (F) bioluminesence images. (G) Tumor volume was measured by the caliper and volume was calculated overtime. N=4–5 mice per group. (H, I) NSG MHC KO mice were engrafted subcutaneously with 3×10⁶ GFP-FfLuc labeled Capan-1 tumor cells and 3×10⁶ PSCs. Tumors were allowed to establish for 1 week and then 1×10⁶ NT or H84T CAR-T cells were intravenously delivered. Tumor volume (H) was quantified by caliper measurement and tumor signal (I) was quantified by bioluminescence signaling through IVIS imaging. N=4 mice per group. (J) Residual CFPAC-1+PSC tumors from mice treated with either NT or H84T CAR T cells were stained for anti-human vimentin to detect stroma cells. Vimentin pixel count was calculated by ImageJ analysis and representative IHC images are shown for three mice in each group. CAR, chimeric antigen receptor; PDAC, FfLuc, firefly luciferase; PDAC, pancreatic ductal adenocarcinoma; PSC, pancreatic stellate cells; NT, non-transduced; IHC, immunohistochemistry; GFP, green fluorescent protein.

References

    1. Wagner J, Wickman E, DeRenzo C, et al. CAR T cell therapy for solid tumors: bright future or dark reality? Mol Ther. 2020;28:2320–39. doi: 10.1016/j.ymthe.2020.09.015. - DOI - PMC - PubMed
    1. Vajaria BN, Patel PS. Glycosylation: a hallmark of cancer? Glycoconj J. 2017;34:147–56. doi: 10.1007/s10719-016-9755-2. - DOI - PubMed
    1. Peixoto A, Relvas-Santos M, Azevedo R, et al. Protein glycosylation and tumor microenvironment alterations driving cancer hallmarks. Front Oncol. 2019;9:380. doi: 10.3389/fonc.2019.00380. - DOI - PMC - PubMed
    1. de Leoz MLA, Young LJT, An HJ, et al. High-mannose glycans are elevated during breast cancer progression. Mol Cell Proteomics. 2011;10:M110.002717–2717. doi: 10.1074/mcp.M110.002717. - DOI - PMC - PubMed
    1. Park DD, Phoomak C, Xu G, et al. Metastasis of cholangiocarcinoma is promoted by extended high-mannose glycans. Proc Natl Acad Sci U S A. 2020;117:7633–44. doi: 10.1073/pnas.1916498117. - DOI - PMC - PubMed

Publication types