. 2023 May;82(5):670-680.
doi: 10.1136/ard-2021-221926. Epub 2023 Jan 18.

Characterising the autoantibody repertoire in systemic sclerosis following myeloablative haematopoietic stem cell transplantation

Affiliations

Characterising the autoantibody repertoire in systemic sclerosis following myeloablative haematopoietic stem cell transplantation

Burcu Ayoglu et al. Ann Rheum Dis. 2023 May.

Abstract

Objectives: Results from the SCOT (Scleroderma: Cyclophosphamide Or Transplantation) clinical trial demonstrated significant benefits of haematopoietic stem cell transplant (HSCT) versus cyclophosphamide (CTX) in patients with systemic sclerosis. The objective of this study was to test the hypothesis that transplantation stabilises the autoantibody repertoire in patients with favourable clinical outcomes.

Methods: We used a bead-based array containing 221 protein antigens to profile serum IgG autoantibodies in participants of the SCOT trial.

Results: Comparison of autoantibody profiles at month 26 (n=23 HSCT; n=22 CTX) revealed antibodies against two viral antigens and six self-proteins (SSB/La, CX3CL1, glycyl-tRNA synthetase (EJ), parietal cell antigen, bactericidal permeability-increasing protein and epidermal growth factor receptor (EGFR)) that were significantly different between treatment groups. Linear mixed model analysis identified temporal increases in antibody levels for hepatitis B surface antigen, CCL3 and EGFR in HSCT-treated patients. Eight of 32 HSCT-treated participants and one of 31 CTX-treated participants had temporally varying serum antibody profiles for one or more of 14 antigens. Baseline autoantibody levels against 20 unique antigens, including 9 secreted proteins (interleukins, IL-18, IL-22, IL-23 and IL-27), interferon-α2A, stem cell factor, transforming growth factor-β, macrophage colony-stimulating factor and macrophage migration inhibitory factor were significantly higher in patients who survived event-free to month 54.

Conclusions: Our results suggest that HSCT favourably alters the autoantibody repertoire, which remains virtually unchanged in CTX-treated patients. Although antibodies recognising secreted proteins are generally thought to be pathogenic, our results suggest a subset could potentially modulate HSCT in scleroderma.

Keywords: Autoantibodies; Scleroderma, Systemic; Systemic Sclerosis.


Conflict of interest statement

Competing interests: LC serves on the advisory board or received consulting fees from Mitsubishi Tanabe, Jannsen, Genentech, Kyverna, and Eicos Sciences.

Figures

Figure 1
Figure 1
Study design, cohort description and overview of comparative analyses. (A) In the SCOT trial, 75 participants with systemic sclerosis (SSc) were randomly assigned to treatment with haematopoietic stem-cell transplantation (HSCT) or high-dose monthly cyclophosphamide (CTX). Serum samples in each treatment group were collected before treatment (baseline) and at various time points, including months 26, 38 and 48. The primary end point, assessed at month 54, was a global rank composite score. The trial ended when the last subject completed the month 54 evaluation, with a maximum follow-up of 72 months. Of the 75 randomised participants, baseline samples were available from 63 (HSCT n=31; CTX n=32). In addition to the sera from SCOT participants, serum samples from healthy controls (HC, n=20) were included in the study design for characterisation of serum autoantibodies. (B) Each black-filled cell represents availability of a sample from a corresponding SCOT subject (numbered P01–P63). Baseline serum samples were available for 63 of 75 SCOT participants. For a majority of the participants (n=45), serum was available at month 26, followed by month 38 (n=37) and month 48 (n=30). For other time points, serum was available for a small portion of the participants, ranging between 1 and 7 individuals. For each of the 63 SCOT participants, colour annotations indicate treatment arm (HSCT or CTX), treatment response evaluated at month 54 (survival event-free vs death or organ damage), sex, age and modified Rodnan skin score (MRSS) at baseline. (C) Using a multiplexed antigen suspension bead array platform, all available sera from SCOT participants as well as HC were analysed for their autoantibody reactivity profiles. Several group comparisons in terms of treatment arm and event-free survival status were conducted for autoantibody profiles obtained for serum samples at baseline and month 26. SCOT, Scleroderma: Cyclophosphamide Or Transplantation.
Figure 2
Figure 2
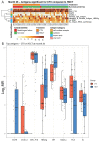
Comparison of serum autoantibody profiles of SCOT participants at baseline and HC. (A) A heat map showing log2 transformed MFI values for serum autoantibody reactivity in baseline SCOT participants (n=63) and HC (n=20) against 62 antigens identified to be significantly different between groups (q<10% and absolute value of log2 fold-change>1). Heat map columns represent serum samples and rows represent statistically significant antigens. For each sample, their sample group, treatment arm and treatment response are colour-annotated. IL-1b, interleukin-1 beta; TNF-alpha, tumour necrosis factor alpha; TG, thyroglobulin; SP100, interferon-inducible autoantigen associate with primary biliary cirrhosis; B2GP1, beta 2 glycoprotein one non-recombinant protein from bovine source; NGAL, neutrophil gelatinase associate lipocalin; deoxy, DNA/DNA; CXCL4, CXC chemokine ligand 4/platelet factor-4; HSP90, heat shock protein 90; GCSF, granulocyte colony stimulating factor; IL, interleukin (2, 3, 8, 13); BMP4, bone morphogenetic protein 4; RPP30, ribonuclease P protein subunit p30; PolR3H, RNA polymerase III; NPM1B23, nucleophosmin B23; U1-snRNP-A, U1-small nuclear ribonucleoprotein A; MCP1/CCL2, monocyte chemoattractant protein 1/chemokine ligand 2; Scl70, scleroderma autoantigen 70; CENPB, centromere protein autoantigen B; SmD, Smith protein D; PCNA, proliferating cell nuclear antigen; PL-12, alanyl t-RNA synthetase; Ku, Ku protein p70/80; SRP54, signal recognition particle 54; FBL, fibrillarin; Sm/RNP C, Smith/U1-small nuclear ribonucleoprotein C; Smith/SMA, Smith protein A; U snRNP B_B, U1-small nuclear ribonucleoprotein Smith proteins B/B’. (B) A box and whisker plot showing the top three antigens ranked by the q-value from the SAM analysis comparing the autoantibody levels in the baseline SCOT participants with the levels in healthy controls. For each sample group, the box and whisker plot represents log2 transformed MFI values within lower and upper quantile (box), the median (horizontal line within box), 5th and 95th percentiles (whiskers), and outliers (dots). MFI, median fluorescence intensity; SCOT, Scleroderma: Cyclophosphamide Or Transplantation.
Figure 3
Figure 3
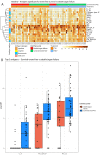
Comparison of serum autoantibody profiles of SCOT participants between the HSCT and CTX arm at month 26. (A) A heat map showing log2-transformed MFI values for serum autoantibody reactivity in SCOT participants treated with HSCT (n=23) or CTX (n=22) against 27 antigens. Antigens identified to be statistically significantly different (q<10% and absolute log2 fold-change >1) at month 26 are shown. Heat map columns represent serum samples and rows represent statistically significant antigens. For each sample, treatment arm and treatment response are colour-annotated. BPI, bactericidal permeability inducing protein; PCA, parietal cell antigen; EJ, EJJ glycyl-tRNA synthetase; CX3CL1, CX3C motif chemokine ligand 1/fractalkine; EBV-p18, Epstein-Barr Virus protein p18. (B) A box and whisker plot showing the top six self-antigens and two viral antigens ranked by the q-value from the SAM analysis comparing the antibody level in the SCOT participants treated with CTX with the level in participants treated with HSCT. For each sample group, the box and whisker plot represents log2-transformed MFI values within lower and upper quantile (box), the median (horizontal line within box), 5th and 95th percentiles (whiskers) and outliers (dots). HSCT, haematopoietic stem cell transplant; SCOT, Scleroderma: Cyclophosphamide Or Transplantation. MFI, median fluorescence intensity.
Figure 4
Figure 4
Comparison of temporal changes in serum autoantibody profiles between the CTX and HSCT treatment arms. (A) Linear mixed model analysis was used to identify antigens showing significantly different temporal trends between the two treatment arms. In each model, random effect due to individual subject differences was included. The line plots show three antigens with significantly different trends between treatment arms (FDR p<0.2). The lines represent the mean trend over time within each treatment arm. Coefficients are reported in each panel label. A positive coefficient indicates a higher slope for HSCT participants compared with CTX participants, which indicates that reactivity to the antigen increases more, over time, in HSCT-treated subjects compared with CTX-treated participants. (B) Subject-specific antigen trends were obtained by fitting a standard linear model to each subject-antigen intensity profile. Based on the distribution of the slopes of the regression lines, subject-antigen pairs with slopes >2 SD from the distribution mean were identified for 8 of 32 HSCT-treated participants and only 1 of 31 CTX-treated participants. The panel shows log2-transformed serum autoantibody profiles for 14 temporally-varying antigens in all nine participants across their available sampling time points. CCL3, chemokine ligand 3; CENP, centromere protein autoantigen; EGFR, epidermal growth factor receptor; HBSAg, hepatitis B surface antigen; HSCT, haematopoietic stem cell transplant; TPO, thyroperoxidase; TG, thyroglobulin; Scl70, scleroderma autoantigen 70.
Figure 5
Figure 5
Comparison of baseline serum autoantibody profiles of SCOT participants who were responsive or not-responsive to their assigned treatments. (A) A heat map showing log2-transformed MFI values for baseline serum autoantibody reactivity against 20 antigens in SCOT participants who survived event-free (n=42) vs died or had organ damage (n=21). Antigens identified to be statistically significantly different (q-value<15% and absolute log2 fold-change>2) are shown. Heat map columns represent serum samples and rows represent statistically significant antigens. For each subject, treatment arm and treatment response are colour-annotated. (B) Boxplots representing the top three autoantibodies that significantly differ at baseline between SCOT participants who survived event-free versus died or had organ damage. Each dot shows log2-transformed MFI value representing baseline serum autoantibody reactivity against IL-27, IFN-α2a and PDC-E2. For each sample group, the box‐and‐whisker plot represents log2-transformed MFI values within lower and upper quantile (box), the median (horizontal line within box), percentiles of 5 and 95% (whiskers) and outliers (dots). HSCT, haematopoietic stem cell transplant; M-CSF, macrophage colony stimulating factor; MFI, median fluorescence intensity; MIF, macrophage migration inhibitory factor; SCF, stem cell factor; SCOT, Scleroderma: Cyclophosphamide Or Transplantation; TGF-B, transforming growth factor beta.

References

    1. Mayes MD, Lacey JV, Beebe-Dimmer J, et al. . Prevalence, incidence, survival, and disease characteristics of systemic sclerosis in a large US population. Arthritis Rheum 2003;48:2246–55. 10.1002/art.11073 - DOI - PubMed
    1. Elhai M, Meune C, Avouac J, et al. . Trends in mortality in patients with systemic sclerosis over 40 years: a systematic review and meta-analysis of cohort studies. Rheumatology 2012;51:1017–26. 10.1093/rheumatology/ker269 - DOI - PubMed
    1. van den Hoogen F, Khanna D, Fransen J, et al. . 2013 classification criteria for systemic sclerosis: an American College of Rheumatology/European League against rheumatism collaborative initiative. Arthritis Rheum 2013;65:2737–47. 10.1002/art.38098 - DOI - PMC - PubMed
    1. Mehra S, Walker J, Patterson K, et al. . Autoantibodies in systemic sclerosis. Autoimmun Rev 2013;12:340–54. 10.1016/j.autrev.2012.05.011 - DOI - PubMed
    1. Chung L, Utz PJ. Antibodies in scleroderma: direct pathogenicity and phenotypic associations. Curr Rheumatol Rep 2004;6:156–63. 10.1007/s11926-004-0061-9 - DOI - PubMed

Publication types

MeSH terms