. 2023 Jan 18;14(1):292.
doi: 10.1038/s41467-023-35796-7.

Smarcd3 is an epigenetic modulator of the metabolic landscape in pancreatic ductal adenocarcinoma

Affiliations

Smarcd3 is an epigenetic modulator of the metabolic landscape in pancreatic ductal adenocarcinoma

L Paige Ferguson et al. Nat Commun. .

Abstract

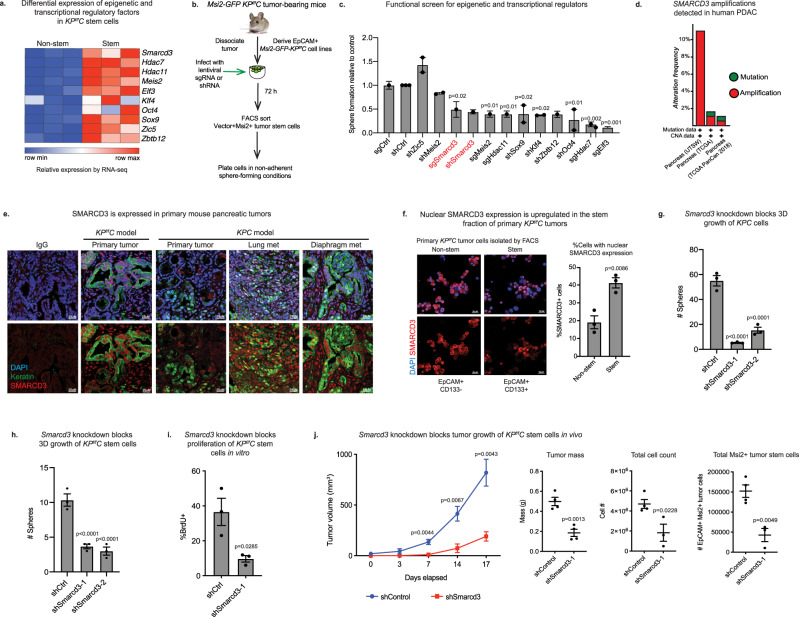
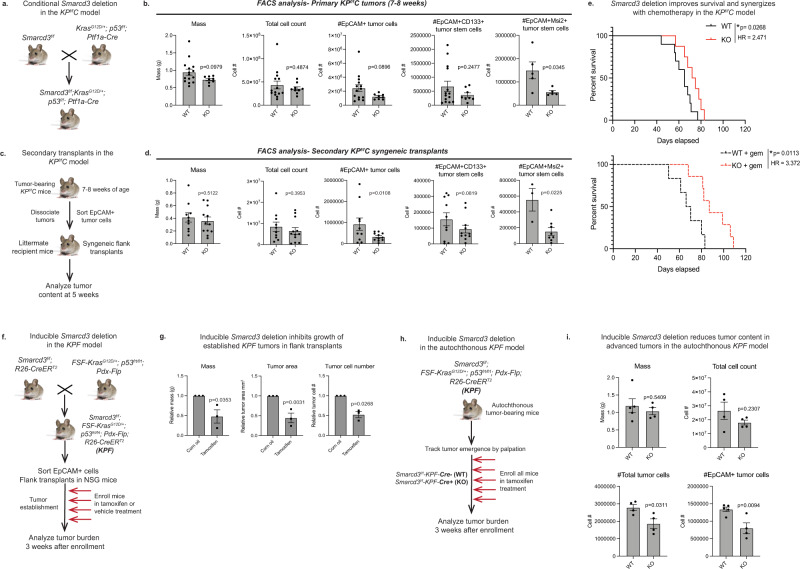
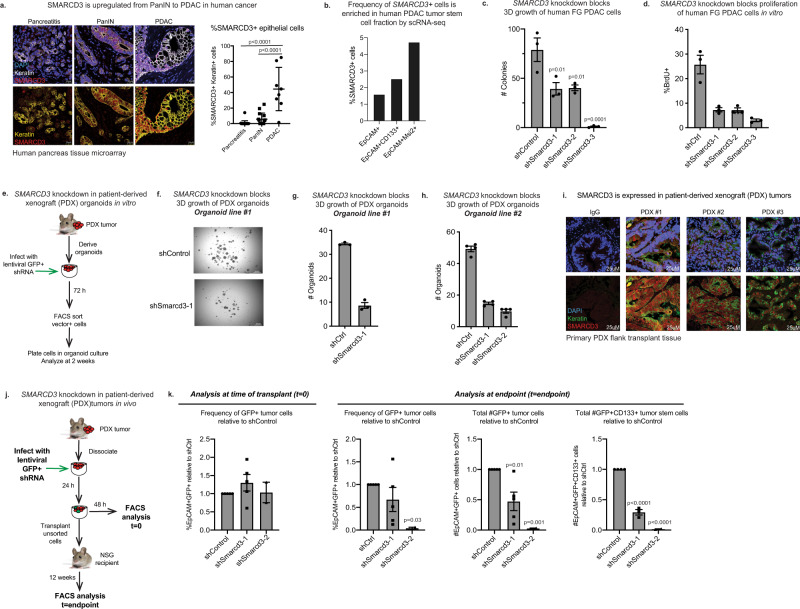
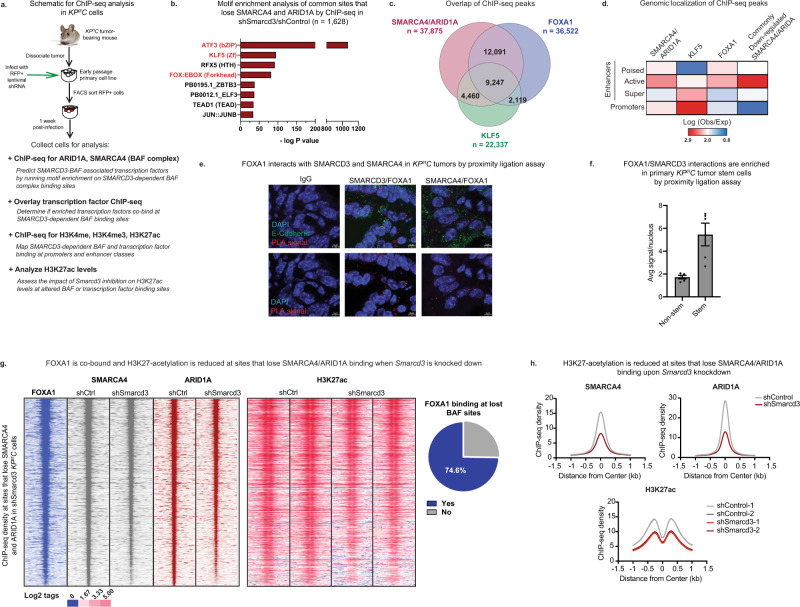
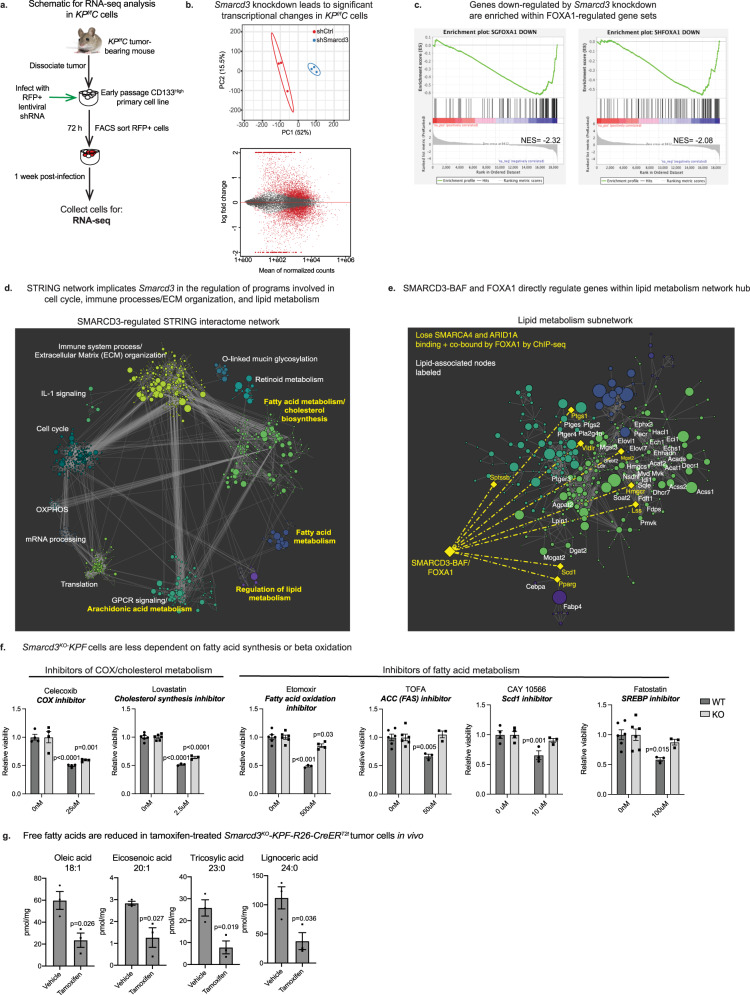
Pancreatic cancer is characterized by extensive resistance to conventional therapies, making clinical management a challenge. Here we map the epigenetic dependencies of cancer stem cells, cells that preferentially evade therapy and drive progression, and identify SWI/SNF complex member SMARCD3 as a regulator of pancreatic cancer cells. Although SWI/SNF subunits often act as tumor suppressors, we show that SMARCD3 is amplified in cancer, enriched in pancreatic cancer stem cells and upregulated in the human disease. Diverse genetic mouse models of pancreatic cancer and stage-specific Smarcd3 deletion reveal that Smarcd3 loss preferentially impacts established tumors, improving survival especially in context of chemotherapy. Mechanistically, SMARCD3 acts with FOXA1 to control lipid and fatty acid metabolism, programs associated with therapy resistance and poor prognosis in cancer. These data identify SMARCD3 as an epigenetic modulator responsible for establishing the metabolic landscape in aggressive pancreatic cancer cells and a potential target for new therapies.


Conflict of interest statement

The authors declare no competing interests.

Figures

Fig. 1
Fig. 1. SMARCD3 is a potential functional epigenetic dependency in pancreatic cancer.
a Relative expression of stem cell-enriched regulatory factors in primary stem (Msi2-GFP+) versus non-stem (Msi2-GFP-) EpCAM+ tumor cells by RNA-seq. b Targeted 3D functional screen for dependencies of Msi2-GFP KPf/fC cells. c Functional screen identifies SMARCD3 as a dependency for PDAC stem cell growth. Relative sphere formation of MSI2+ KPf/fC cells normalized to control (n = 1 biological replicate at n = 3 for sgRNA and n = 3 biological replicates at n = 4 for shRNA; ANOVA with multiple comparisons, mean ± SEM). d Genetic amplifications in SMARCD3 locus in clinical cases of pancreatic cancer (cBioPortal, see Supplementary Fig. 1a). e SMARCD3 expression in KPf/fC and KPC tumor cells. Representative images showing SMARCD3 (red) in epithelial tumor cells (pan-keratin+, green); nuclei (DAPI, blue), representative images (n = 3 mice, scale bar = 25 μm). f Elevated nuclear SMARCD3 in CD133+ stem cell fraction of primary KPf/fC tumors. DAPI (blue), SMARCD3 (red); tumor cells with nuclear SMARCD3 staining were counted. Representative from n = 3 frames, n = 2 biological replicates, mean ± SEM; scale bar = 25 μm (see Supplementary Fig. 1d). g Smarcd3 knockdown blocks 3D growth of CD133 + KPC cells in vitro; n = 3, representative of n = 3 biological replicates, ANOVA with multiple comparisons, mean ± SEM. h Smarcd3 knockdown blocks 3D sphere formation of CD133 + KPf/fC cells in vitro; n = 3, representative of n = 10 biological replicates, ANOVA with multiple comparisons, mean ± SEM. i Smarcd3 knockdown blocks proliferation (BrdU incorporation) of CD133 + KPf/fC cells in vitro (n = 2 biological replicates, n = 3, mean ± SEM). j Smarcd3 knockdown blocks growth of MSI2+ KPf/fC cells in vivo, reducing flank transplant tumor growth rate (shControl slope = 43.8 mm3/day; shSmarcd3 slope = 10.08 mm3/day, linear regression, p = <0.0001); mass, cell count, and number of MSI2+ tumor stem cells at endpoint (n = 4 for 3 biological replicates, ANOVA with multiple comparisons, mean ± SEM; see Supplementary Fig. 1i, j). Source data for all experiments are provided as a Source Data file.
Fig. 2
Fig. 2. Genetic deletion of Smarcd3 impairs tumor growth in mouse models of pancreatic cancer.
a Pancreas-specific deletion of Smarcd3 concomitant with Kras mutation and p53 deletion. b Smarcd3 deletion in primary KPf/fC tumors. Analysis of Smarcd3WT-KPf/fC (WT) and Smarcd3KO-KPf/fC (KO) mice for tumor mass*, tumor cell number**, EpCAM+, EpCAM+CD133+**, and EpCAM+Msi2+ cells (n = 15 WT, n = 9 KO, n = 5 Msi2-GFP-KPf/fC mice; two-tailed T-test, mean ± SEM; *1 outlier, **2 outliers removed, ROUT Q = 1%). FACS gating Supplementary Fig. 2f. c Secondary syngeneic transplants in KPf/fC model. d Smarcd3 deletion reduces tumor burden in secondary KPf/fC transplants; Smarcd3KO-KPf/fC (KO) transplants have reduced EpCAM+*, EpCAM+CD133+ and EpCAM+Msi2+ cells (cells were isolated from n = 4 primary tumors/genotype and transplanted into n = 2–4 recipients per cohort, see Source Data File, *1 outlier removed, ROUT Q = 1%; 2-way ANOVA, mean ± SEM). FACS gating Supplementary Fig. 2f. e Smarcd3 deletion improves survival in the KPf/fC model. Median survival was 13% longer for Smarcd3KO-KPf/fC (KO) vs. Smarcd3WT-KPf/fC (WT) mice (log-rank test). Median survival was 28% longer in KO mice with gemcitabine (gem) treatment (log-rank test). Smarcd3 deletion synergized with chemotherapy; WT survival improved 13% with Smarcd3 deletion and 4% with gem treatment while Smarcd3 deletion plus gem drove a 34% survival benefit. f Inducible Smarcd3 deletion in KPF transplants. Smarcd3f/f mice were crossed to a dual-recombinase model (FSF-KrasG12D/+; p53FRT/FRT; Pdx-Flp; KPF) and global R26-CreERT2 line enabling inducible Smarcd3 deletion in transplanted tumors. g Inducible Smarcd3 deletion blocks the growth of established KPF tumors. Vehicle and tamoxifen-treated Smarcd3f/f-KPF-R26-CreERT2 (KPF) transplants were analyzed for total tumor cell number and tumor area* (n = 3–6 transplants/tumor, see Source Data File; *2 outliers removed, ROUT Q = 1%; 2-way ANOVA, mean ± SEM). h Inducible Smarcd3 deletion in autochthonous KPF mice. Smarcd3f/f mice were crossed to a dual-recombinase model (FSF-KrasG12D/+; p53FRT/FRT; Pdx-Flp; KPF) and global R26-CreERT2 line, enabling inducible global Smarcd3 deletion in autochthonous tumors. i Inducible Smarcd3 deletion reduces tumor content in autochthonous KPF mice. Vehicle and tamoxifen-treated Smarcd3f/f-KPF-R26-CreERT2 (KPF) tumors were analyzed. Total tumor and EpCAM+ tumor cell numbers were reduced (n = 5 WT (Cre−) and n = 4 KO (Cre+) KPF mice; two-tailed T-test, mean ± SEM). FACS gating Supplementary Fig. 2f. Source data are provided in the Source Data file.
Fig. 3
Fig. 3. SMARCD3 knockdown blocks tumor growth in human models of pancreatic cancer.
a SMARCD3 is upregulated from PanIN to PDAC in human cancer. Frequency of nuclear (DAPI, blue) SMARCD3+ (red) epithelial cells (pan-keratin+, white/yellow) in pancreatitis (n = 22), PanIN (n = 15), and PDAC (n = 8); n = 3 frames per case; ANOVA with multiple comparisons, mean ± SEM (scale bar = 25 μm). b The frequency of SMARCD3+ cells is increased in the stem cell fraction of primary human PDAC tumors by scRNA-seq. SMARCD3+ cells were quantified within MSI2+ and CD133+EpCAM+ tumor stem cells relative to bulk EpCAM+ tumor cells (see Supplementary Fig. 3a). c Knockdown of SMARCD3 using shRNA blocks 3D growth of human FG PDAC cells in vitro (representative, n = 4 biological replicates at n = 3; ANOVA with multiple comparisons, mean ± SEM). d Knockdown of SMARCD3 using shRNA blocks proliferation of human FG PDAC cells in vitro (n = 1 biological replicate at n = 3, mean ± SEM). e Transduction of patient-derived organoids with SMARCD3 shRNA in vitro. f SMARCD3 knockdown blocks growth of patient-derived PDAC organoids in vitro (representative, n = 1 organoid line at n = 3 replicates, scale bar = 1 mm). g SMARCD3 knockdown blocks growth of patient-derived PDAC organoids in vitro; organoid line #1 1 (n = 1 biological replicate at n = 3; mean ± SEM). h SMARCD3 knockdown blocks growth of patient-derived PDAC organoids in vitro; organoid line #2 (n = 1 biological replicate at n = 4; mean ± SEM). i Patient-derived xenograft (PDX) tumors express SMARCD3. Three PDX tumors were stained for nuclear (DAPI, blue) SMARCD3 (red) within the epithelium (pan-keratin, green) (scale bar = 25 μm). j Transduction and transplant of patient-derived xenograft tumor cells. k SMARCD3 knockdown blocks in vivo growth of patient-derived xenograft PDAC tumors. Tumors were analyzed for GFP (shRNA vector), EpCAM, and CD133 expression. Despite equivalent transduction at t = 0 (left), frequency of GFP+EpCAM+ tumor cells (middle left), the number of GFP+EpCAM+ tumor cells (middle right), and the number of GFP+CD133+EpCAM+ tumor stem cells (right) were reduced by SMARCD3 knockdown (ANOVA with multiple comparisons, mean ± SEM). FACS plots Supplementary Fig. 3g. Source data for all studies are provided in the Source Data file.
Fig. 4
Fig. 4. SMARCD3 regulates the epigenetic landscape and BAF complex binding at FOXA1 binding sites in mouse pancreatic cancer cells.
a Schematic for ChIP-seq analysis in KPf/fC cells. b Motif enrichment on sites that lose SMARCA4/ARID1A binding upon Smarcd3 is knockdown. Motif enrichment (cumulative binomial distribution) on commonly down-regulated SMARCA4/ARID1A binding sites by ChIP-seq shows that commonly lost sites are enriched for ATF3 (AP-1), KLF5, and FOX (FOXA1) motifs. c FOXA1 and KLF5 binding sites overlap with SMARCA4/ARID1A binding sites in KPf/fC cells. FOXA1 and KLF5 ChIP-seq in KPf/fC cells were overlaid with SMARCA4/ARID1A ChIP-seq to identify overlapping binding sites. d SMARCA4, ARID1A, and FOXA1 binding are enriched at active enhancers. ChIP-seq for H3K27ac, H3K4me, and H3K4me3 allowed mapping of cis-regulatory genomic elements (poised, active, and super-enhancers as well as promoters). SMARCA4/ARID1A co-bound sites and FOXA1 are most enriched at active enhancers; KLF5 is enriched at promoters. Common sites that lose SMARCA4/ARID1A binding upon Smarcd3 knockdown are significantly enriched at active enhancers. e FOXA1 interacts with SMARCD3 and SMARCA4 in vivo. Proximity ligation assay (PLA) with antibodies against FOXA1, SMARCD3, and SMARCA4 showed positive PLA (red) in the nuclei (DAPI, blue) of KPf/fC tumor cells (E-Cadherin, green), representing associations between FOXA1/SMARCD3, and FOXA1/SMARCA4 in mouse pancreatic tumor tissue (representative, n = 2 mice, n = 5 frames/tumor, mean ± SEM, scale bar = 5 μm; see Supplementary Fig. 4c, d). f FOXA1/SMARCD3 interactions are enriched in primary KPf/fC stem cells. Proximity ligation assay with antibodies against FOXA1 and SMARCD3 showed positive PLA signals were enriched in CD133+ tumor stem cells (n = 1 mouse, n = 5 frames/tumor, mean ± SEM). Source data are provided in the Source Data file. g FOXA1 is co-bound and H3K27-acetylation is reduced at sites that lose SMARCA4/ARID1A binding upon Smarcd3 knockdown. SMARCA4 and ARID1A ChIP-seq density at sites commonly lost when Smarcd3 is knocked down overlap with FOXA1 binding (left); H3K27-acetylation is reduced (middle) and FOXA1 is co-bound at 75% of sites (right) that commonly lose BAF binding upon Smarcd3 knockdown. h H3K27-acetylation is reduced at sites that lose SMARCA4/ARID1A binding upon Smarcd3 knockdown. Sites where SMARCA4/ARID1A binding is lost (upper row) show reduced H3K27-acetylation (bottom row).
Fig. 5
Fig. 5. SMARCD3 regulates transcriptional networks implicated in lipid metabolism.
a Schematic for RNA-seq analysis in KPf/fC cells. b Smarcd3 knockdown impacts transcription in KPf/fC cells. PCA plot (top) demonstrates the clustering of shControl (red) and shSmarcd3 (blue) replicates by RNA-seq. MA plot (bottom) of differential gene expression by RNA-seq; normalized counts are plotted against log fold change in expression. Differentially expressed genes are in red. c Genes down-regulated by Smarcd3 knockdown are enriched within FOXA1-regulated gene sets. Gene set enrichment analysis (GSEA) of RNA-seq data revealed enrichment for FOXA1-regulated gene sets within genes down-regulated by Smarcd3 knockdown (Supplementary Fig. 5a). d STRING network implicates Smarcd3 in the regulation of programs involved in the cell cycle, immune processes, extracellular matrix organization, and lipid metabolism. Down-regulated genes (padj < 0.05, log(fold change)<−0.35) were used to map the SMARCD3-dependent network within the STRING interactome (node size scaled to log(fold change)). A clustering algorithm was applied to the network to generate 12 programmatic hubs; STRING functional enrichment was used to identify enriched annotations for each hub (hubs with lipid-related annotations are labeled yellow). e SMARCD3-BAF and FOXA1 directly regulate genes within the lipid metabolism network hub. Lipid-associated network hubs were merged and nodes with lipid-metabolic functions were labeled. We identified potential direct targets of SMARCD3-BAF/FOXA1 (yellow label) as genes bound by FOXA1 that lose BAF (SMARCA4/ARID1A) binding by ChIP-seq when Smarcd3 is knocked down. f Smarcd3KO-KPF cells are less dependent on fatty acid synthesis and beta-oxidation. Curated screen of metabolic inhibitors conducted in Smarcd3WT and Smarcd3KO-KPF cells. Primary tumor cell lines were derived from (Cre−) Smarcd3f/f-KPF tumors. Smarcd3 deletion was driven by the delivery of adenoviral GFP (WT) or Cre (KO); transduced cells were treated with inhibitors for 72 h in sphere-forming conditions and assessed for viability (representative, n = 3 biological replicates with n = 4 technical replicates per experiment; 2-way ANOVA with multiple comparisons, mean ± SEM). g Free fatty acids are reduced in tamoxifen-treated Smarcd3f/f-KPF-R26-CreERT2 tumors. Vehicle or tamoxifen-treated Smarcd3f/f-KPF-R26-CreERT2 EpCAM+ tumor cells were sorted for free fatty acid analysis by GC-MS (n = 3, two-tailed T-test, mean ± SEM; see Supplementary Fig. 5c, d). All Source data are provided in the Source Data file.

References

    1. Rahib L, Wehner MR, Matrisian LM, Nead KT. Estimated projection of US cancer incidence and death to 2040. JAMA Netw. Open. 2021;4:e214708. doi: 10.1001/jamanetworkopen.2021.4708. - DOI - PMC - PubMed
    1. Siegel RL, Miller KD, Fuchs HE, Jemal A. Cancer statistics, 2021. CA. 2021;71:7–33. - PubMed
    1. Kleeff J, et al. Pancreatic cancer. Nat. Rev. Dis. Prim. 2016;2:1–22. - PubMed
    1. Black, J. R. M. & McGranahan, N. Genetic and non-genetic clonal diversity in cancer evolution. Nat. Rev. Cancer.21, 379–392 (2021). - PubMed
    1. Batlle E, Clevers H. Cancer stem cells revisited. Nat. Med. 2017;23:1124–1134. doi: 10.1038/nm.4409. - DOI - PubMed

Publication types

MeSH terms

Substances