. 2023 Jan 18;14(1):294.
doi: 10.1038/s41467-023-35978-3.

Real-time visualisation of the intracellular dynamics of conjugative plasmid transfer

Affiliations

Real-time visualisation of the intracellular dynamics of conjugative plasmid transfer

Agathe Couturier et al. Nat Commun. .

Abstract

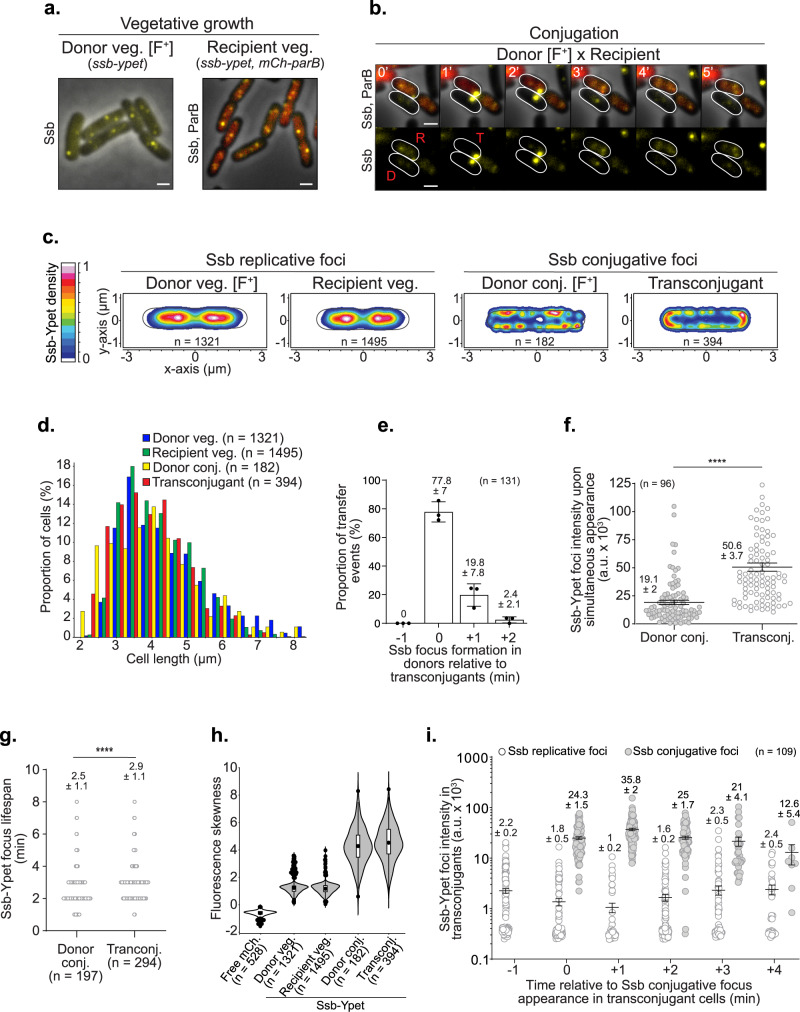
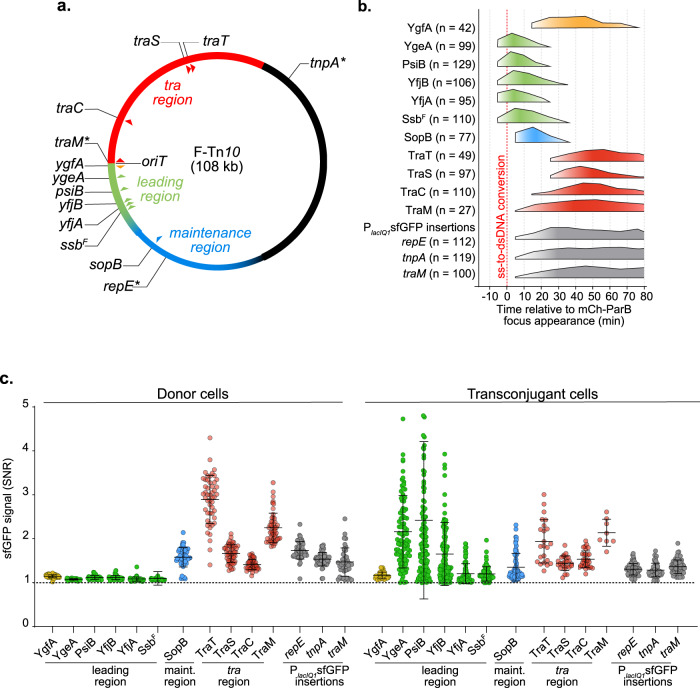
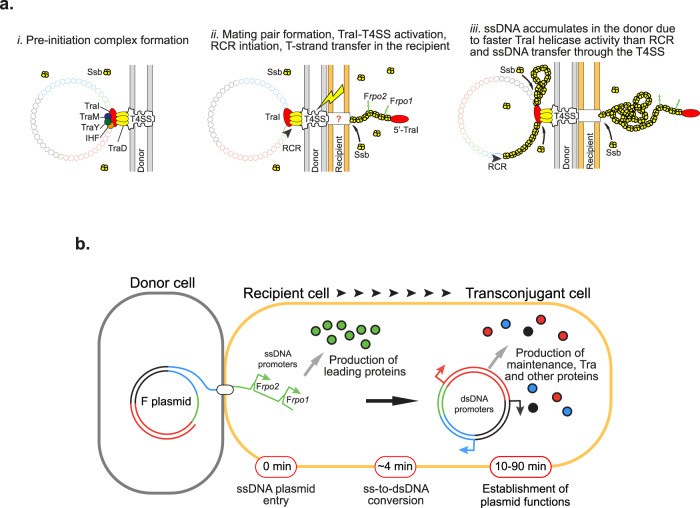
Conjugation is a contact-dependent mechanism for the transfer of plasmid DNA between bacterial cells, which contributes to the dissemination of antibiotic resistance. Here, we use live-cell microscopy to visualise the intracellular dynamics of conjugative transfer of F-plasmid in E. coli, in real time. We show that the transfer of plasmid in single-stranded form (ssDNA) and its subsequent conversion into double-stranded DNA (dsDNA) are fast and efficient processes that occur with specific timing and subcellular localisation. Notably, the ssDNA-to-dsDNA conversion determines the timing of plasmid-encoded protein production. The leading region that first enters the recipient cell carries single-stranded promoters that allow the early and transient synthesis of leading proteins immediately upon entry of the ssDNA plasmid. The subsequent conversion into dsDNA turns off leading gene expression, and activates the expression of other plasmid genes under the control of conventional double-stranded promoters. This molecular strategy allows for the timely production of factors sequentially involved in establishing, maintaining and disseminating the plasmid.


Conflict of interest statement

The authors declare no competing interests.

Figures

Fig. 1
Fig. 1. Real-time dynamics of ssDNA plasmid transfer from donor to recipient cells.
a Representative microscopy images of donors and recipients carrying the ssb-ypet fusion gene during vegetative growth. The recipients also produce the diffuse mCh-ParB fluorescent protein. Scale bars 1 μm. b Time-lapse microscopy images of plasmid transfer between a donor (D) and a recipient (R) that is converted into a transconjugant cell (T). Scale bars 1 μm. Additional events are presented in Figure S1. c 2D localisation heatmaps of Ssb-Ypet in donors, recipients and transconjugant during vegetative growth (veg.) and conjugation (conj.). Normalisation by the cell length of (n) individual cells from at least three biological replicates. The density scale bar is on the left. d Cell length distribution histogram of donors, recipients and transconjugants (n cells analysed from at least three independent experiments). e Ssb conjugative focus appearance timing in donor relative to transconjugant cells. Histograms with means and SD represent the proportion of transfer events in which the Ssb focus appears in the donors before (−1 min), simultaneously (0 min) or after (+1 min; +2 min) it appears in transconjugants. The number (n) of individual transfer events analysed from three independent experiments is indicated. f Jitter plot of the fluorescence intensity of Ssb-Ypet conjugative foci upon simultaneous appearance. The number of foci analysed from three independent experiments (n) is indicated with the corresponding Mean and SEM. P value significance from Mann–Whitney two-sided statistical test is indicated by ****(P ≤ 0.0001). g Jitter plots of Ssb-Ypet conjugative foci lifespan in donor and transconjugant cells. P value significance from Mann–Whitney two-sided statistical test is indicated by ****(P = 0.0001). The number (n) of cells analysed from at least five independent experiments is indicated. h Violin plots of the fluorescence skewness of a free mCherry and of the Ssb-Ypet in donors, recipients and transconjugant cells. The median, quartile 1 and quartile 3 are indicated by the boxes’ bounds, the mean by a black dot, and the minima and maxima by the whiskers’ limits. Black dots above and below the max and min values correspond to outliers. Free mCherry data correspond to one representative experiment. Other plots correspond to the same data set as in panel (c) from at least three biological replicates. The number of cells analysed (n) is indicated. i Jitter plot of Ssb-Ypet replicative and conjugative foci intensity in transconjugant cells during conjugation. Time 0 min corresponds to the appearance of the Ssb-Ypet conjugative focus in recipients. The number of cells analysed (n) from three independent experiments is indicated with the corresponding Mean and SEM. Donor (LY1007), recipient (LY358), transconjugant (LY358 after Fwt acquisition from LY1007); the free mCherry is produced from the chromosome in MS388 wt background (LY1737). Source data are provided as a Source Data file.
Fig. 2
Fig. 2. Timing and spatial localisation of the ss-to-dsDNA conversion and plasmid duplication in transconjugant cells.
a Time-lapse images showing ssDNA plasmid transfer reported by the formation of the Ssb-Ypet conjugative foci in both donor (D) and recipient (R) cells, followed by the ss-to-dsDNA conversion reflected by the appearance of an mCh-ParB focus in transconjugant (T) cells. Scale bar 1 μm. b Single-cell time-lapse quantification of Ssb-Ypet focus appearance (blue line) and mCh-ParB focus first duplication (red line) with respect to the ss-to-dsDNA conversion revealed by mCh-ParB focus formation in transconjugant cells (0 min). Ssb-Ypet focus appearance was analysed using 1 min/frame time-lapses, while mCh-ParB first and second duplication were analysed using 5 min/frame time-lapses. The mean and SD calculated from the indicated number of conjugation events analysed (n) from seven independent experiments is indicated. c Histogram of successful ss-to-dsDNA conversion reflected by the conversion of the Ssb-Ypet conjugative foci into an mCh-ParB focus. The mean and SD are calculated from (n) individual transfer events from six biological replicates (black dots). d Histogram showing the percentage of transconjugants with an mCh-ParB focus that acquires multiple ssDNA plasmids as revealed by the successive appearance of Ssb-Ypet conjugative focus. The mean and SD are calculated from (n) individual transconjugant cells from six biological replicates (black dots). e Scatter plot showing the time lag between Ssb-Ypet and mCh-ParB foci appearance in transconjugants. The mean and SD calculated from (n) individual events (blue circles) from seven biological replicates are indicated. f Scatter plot showing the time lag between the apparition of the mCh-ParB focus and its visual duplication in two foci (first duplication), and in three or four foci (second duplication). The mean and SD calculated from (n) individual duplication events (red circles) from at least six biological replicates are indicated. g Single-cell time-lapse quantification of the number of F foci per cell in F-carrying donor strain during vegetative growth and in transconjugants after F plasmid acquisition. For donors, the number of F foci per cell (number of SopB-sfGFP foci) with respect to cell birth (t = 0 min) is shown (grey curve). For transconjugants, the number of F foci per cell (number of mCh-ParB foci) with respect to mCh-ParB focus appearance (t = 0 min) is shown (black curve). Mean and SD calculated from (n) individual cells from four biological replicates are indicated, together with curves’ linear fitting lines (green and red). F-carrying donor strain (LY834), Transconjugant (LY358 after Fwt acquisition). h 2D localisation heatmaps of mCh-ParB foci at the time of its appearance (top) and just before its duplication (bottom). Heatmaps are normalisation by the cell length of (n) individual transconjugant cells from seven biological replicates. af, h Fwt donor (LY1007), recipient (LY358) and transconjugant (LY358 after Fwt acquisition). Source data are provided as a Source Data file.
Fig. 3
Fig. 3. Timing of plasmid-encoded proteins production in transconjugant cells.
a Genetic map of the 108 kb F plasmid indicating the leading (green), Tra (red) and maintenance (blue) regions, and the positions of the studied genes (triangles). Stars represent the genetic location of the PlacIQ1sfgfp insertions. b Summary diagram of the production timing of each plasmid-encoded protein fusions in transconjugant cells with respect to the timing of ss-to-dsDNA conversion reflected by mCh-ParB focus appearance (0 min). The diagram represents data from the foldchange increase in sfGFP signal from Fig. S5. Orange/green, blue and red colours correspond to production of proteins from the leading, maintenance and transfer region, respectively. Timings of the cytoplasmic sfGFP production from the PlacIQ1 promoter inserted in the repE-sopA (repE), tnpA-ybaA (tnpA) and traM-traJ (traM) intergenic regions are represented in grey. The number (n) of individual transconjugant cells from at least three biological replicates analysed is indicated. c Jitter plots showing the intracellular green fluorescence (SNR) for each sfGFP fusions and reporters within vegetatively growing donor (left) and transconjugant cells (right) at the maximum SNR value from Fig. S5. Each dot represents data of individual cells. Means and SD are calculated from the indicated (n=) number of transconjugant cells from at least three independent biological replicates. Donors of F derivatives (see Table S1), Recipient (LY358). Source data are provided as a Source Data file.
Fig. 4
Fig. 4. Role of leading region factors Frpo1, Frpo2 and ssbF in conjugation.
a Genetic map of the leading region showing the position of the genes (green for studied sfGFP fusions and white for the other genes) and Frpo1 and Frpo2 promoters (red) (top). The bottom diagram shows the stem-loop structure formed by the ssDNA forms of Frpo1 and Frpo2 sequences (detailed in Fig. S6). b Histograms of intracellular sfGFP fold-increase in transconjugants after the acquisition of F ΔFrpo1 ygeA-sfgfp, F ΔFrpo2 ssb-sfgfp and F ΔFrpo2 yfjA-sfgfp. Mean and SD are calculated from the indicated (n) individual transconjugant cells analysed from at least three independent experiments. Levels obtained with the Fwt plasmid from Fig. S5a are wt reported in green as a reference. Donor of F ΔFrpo1 ygeA-sfgfp (LY1368), F ΔFrpo2 ssb-sfgfp (LY1365), F ΔFrpo2 yfjA-sfgfp (LY1364) and the recipient (LY318). c Histograms of Fwt, deletion mutants F ΔFrpo1, F ΔygeA, F ΔFrpo1 ΔygeA, F ΔFrpo1 ΔygeAB, FΔFrpo2 and FΔssbF frequency of transconjugant (T/R + T) estimated by plating assays. Mean and SD are calculated from three independent experiments (shown as individual black dots). P value significance ns and ****P ≤ 0.0001 were obtained from one-way ANOVA with Dunnett’s multiple comparisons test. Donor of Fwt (LY875), F ΔFrpo1 (LY824), F ΔygeA (LY160), F ΔFrpo1 ΔygeA (LY1424), F ΔFrpo1 ΔygeAB (LY1425), F ΔFrpo2 (LY823), F ΔssbF (LY755), recipient (MS428). d Single-cell time-lapse quantification of Ssb-Ypet focus appearance (blue line) and mCh-ParB focus first duplication (red line) with respect to mCh-ParB focus formation in transconjugant cells (0 min) that receive the FΔssbF plasmid. The number of conjugation events analysed (n) from five independent biological replicates is indicated. Results obtained in Fig. 2b with Fwt plasmid are reported in grey for comparison. e Scatter plot showing the time lag between the appearance of the Ssb-Ypet focus and the appearance of the mCh-ParB focus in transconjugant cells after the acquisition of the F ΔssbF plasmid. The mean and SD calculated from (n) individual ss-to-dsDNA conversion event (blue circles) from five biological replicates are indicated. P value significance ns (>0.05 non-significant) was obtained from Mann–Whitney two-sided statistical test against results obtained with the Fwt plasmid (Fig. 2e). f Scatter plot showing the time lag between the apparition of the mCh-ParB focus and its visual duplication in two foci (first duplication), and in three or four foci (second duplication) in transconjugant cells after acquisition of the F ΔssbF plasmid. The mean and SD calculated from (n) individual duplication events (red circles) from eight biological replicates are indicated. P value significance **P = 0.0023 and ***P = 0.0007 were obtained from Mann–Whitney two-sided statistical test against results obtained with the Fwt plasmid (Fig. 2f). Donor F ΔssbF (LY1068), recipient (LY358). Source data are provided as a Source Data file.
Fig. 5
Fig. 5. Model for conjugation initiation and intracellular dynamics.
a(i) Before the initiation of conjugation, the pre-initiation complex bound to the plasmid’s origin of transfer is docked to the Type IV secretion system (T4SS). (ii) The establishment of the mating pair transduces a signal that activates the pre-initiation complex. The unwinding of the dsDNA plasmid by the helicase activity of TraI produces the first segment of the T-strand, which is immediately transferred into the recipient cell where it recruits Ssb molecules, while the non-transferred strand is complemented by rolling-circle replication (RCR) in the donor cell. (iii) The helicase activity of TraI generates ssDNA at a higher rate than the T-strand is transferred through the T4SS or the non-transferred strand is complemented by RCR, thus resulting in the accumulation of ssDNA plasmid coated by Ssb molecules in the donor cell. b Upon entry of the ssDNA plasmid in the recipient cell, Frpo1 and Frpo2 leading sequences form stem-loop structures that serve as promoters initiating the transcription of the downstream leading genes, rapidly resulting in the production of leading proteins. The subsequent ss-to-dsDNA conversion inactivates Frpo1 and Frpo2 and licences the expression of other plasmid genes under the control of conventional dsDNA promoters. The production of maintenance, transfer and other plasmid-encoded proteins eventually results in the development of new functions by the transconjugant cell.

References

    1. Lederberg J, Tatum EL. Gene recombination in Escherichia coli. Nature. 1946;158:558. doi: 10.1038/158558a0. - DOI - PubMed
    1. Grohmann E, Muth G, Espinosa M. Conjugative plasmid transfer in gram-positive bacteria. Microbiol. Mol. Biol. Rev. 2003;67:277–301. doi: 10.1128/MMBR.67.2.277-301.2003. - DOI - PMC - PubMed
    1. Cruz FDL, Frost LS, Meyer RJ, Zechner EL. Conjugative DNA metabolism in Gram-negative bacteria. FEMS Microbiol. Rev. 2010;34:18–40. doi: 10.1111/j.1574-6976.2009.00195.x. - DOI - PubMed
    1. Virolle C, Goldlust K, Djermoun S, Bigot S, Lesterlin C. Plasmid transfer by conjugation in Gram-negative bacteria: from the cellular to the community level. Genes. 2020;11:1239. doi: 10.3390/genes11111239. - DOI - PMC - PubMed
    1. Barlow M. What antimicrobial resistance has taught us about horizontal gene transfer. Methods Mol. Biol. 2009;532:397–411. doi: 10.1007/978-1-60327-853-9_23. - DOI - PubMed

Publication types