. 2023 Jan 18;13(1):939.
doi: 10.1038/s41598-023-27393-x.

Peatland groundwater level in the Indonesian maritime continent as an alert for El Niño and moderate positive Indian Ocean dipole events

Affiliations

Peatland groundwater level in the Indonesian maritime continent as an alert for El Niño and moderate positive Indian Ocean dipole events

Albertus Sulaiman et al. Sci Rep. .

Abstract

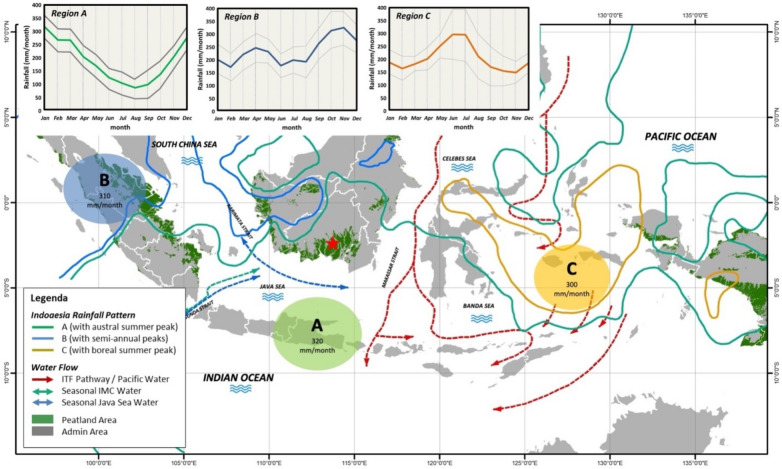
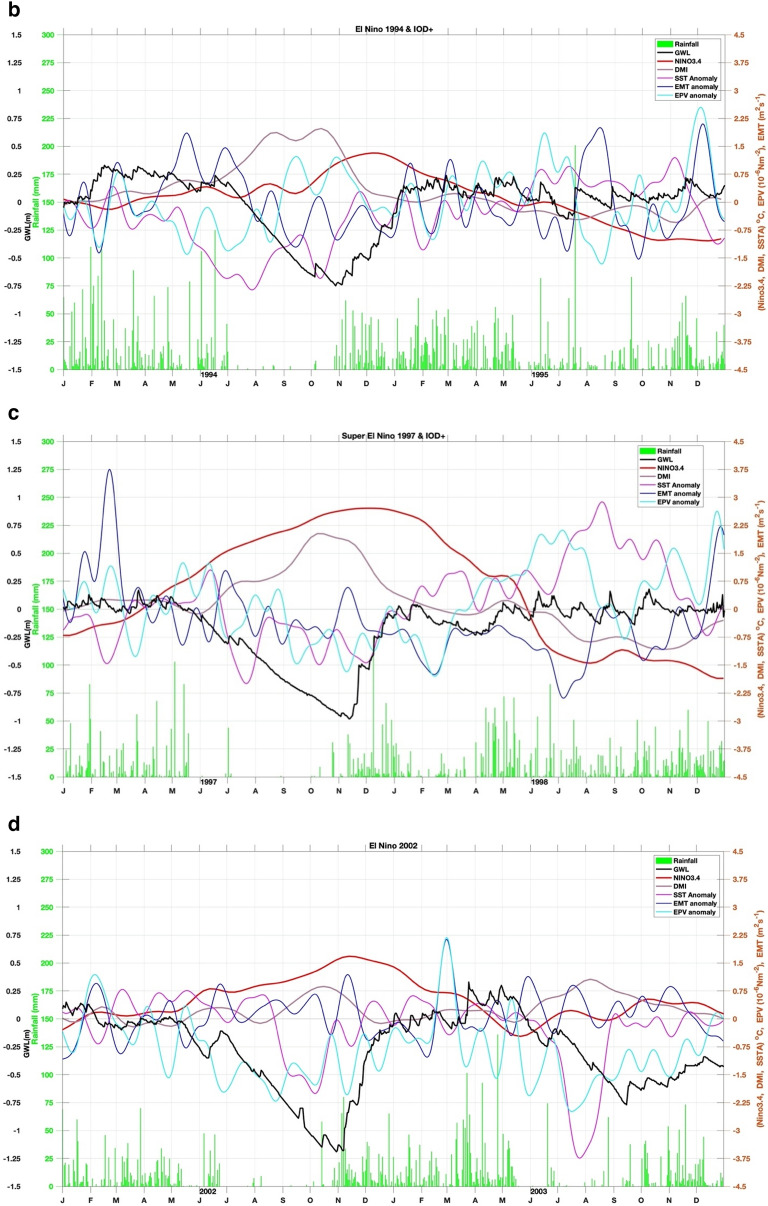
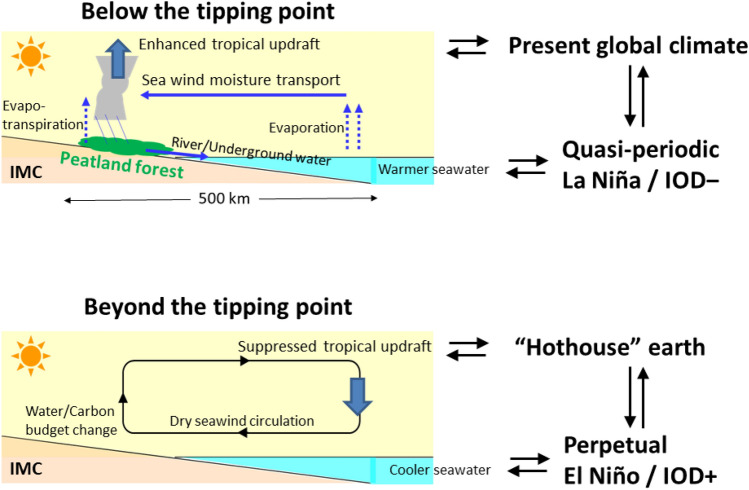
In general, it is known that extreme climatic conditions such as El Niño and positive Indian Ocean Dipole (IOD+) cause prolonged drought in Indonesia's tropical peatlands so that groundwater levels (GWL) drop and peat is prone to fire. However, 27 years of GWL measurements in Central Kalimantan peat forests show the opposite condition, where the lowest GWL occurs several weeks before El Niño and after IOD+ reaches its peaks. We show that the dropped sea surface temperature anomaly induced by anomalously easterly winds along the southern Java-Sumatra occurs several weeks before the GWL drop to the lowest value. Local rainfall decreased, and GWL dropped sharply by 1.0 to 1.5 m, during the super El Niño events in 1997/98 and 2015, as well as remarkable events of IOD+ in 2019. It is suggested that the tropical peatland ecohydrological system (represented by the GWL), El Niño Southern Oscillation (ENSO), and IOD+ are teleconnected. Hence, monitoring GWL variability of peatland over the IMC is a possibility an alert for extreme climate events associated with El Niño and/or moderate IOD+.


Conflict of interest statement

The authors declare no competing interests.

Figures

Figure 1
Figure 1
Map of the Indonesian Maritime Continent (IMC) and peatland distribution in Indonesia generated using QGIS 3.26.1(https://www.qgis.org/en/site/forusers/download.html). The map is overlaid with three (A, B, C) annual rainfall patterns with the amount of mean annual rainfall (with modified legend and written permission from the publisher, John Wiley and Sons) and the Indonesian Throughflow (ITF) pathways (red, blue and green arrows). The red star in south Kalimantan denotes the location of GWL station.
Figure 2
Figure 2
(a) Time series of the groundwater level (GWL) and rainfall in Central Kalimantan. (b) Nino3.4 and Dipole Mode (DMI) indices. The shaded area above and below the 0.5 values for Nino3.4 (blue & magenta), and DMI (cyan and gray). Brown arrows (El Niño events in 1994, 1997, 2002, 2006, 2009); Red arrows (Super El Niño events in 1997 & 2015). Blue arrows (IOD+ events in 1994, 1997, 2006, 2019); (c) the sea surface temperature anomaly (SSTA) along the southern coast of Sumatra-Java. Super El Niño, when Nino3.4 above +2.5, occurred in 1997 and 2015.
Figure 3
Figure 3
(a) Correlation between GWL and EMT, EPV, SST, Rainfall, DMI and Nino34, during El Niño and IOD events. (b) Time series of GWL (black line), rainfall (green bar), Nino34 (red), DMI (purple), SST (magenta), Ekman mean transport (EMT) (blue), and Ekman pumping velocity (EPV) (cyan) anomalies for 1994 weak El Niño but strong Indian Ocean dipole positive (IOD+) event. (c) Similar to (b) but for the 1997 Super El Niño event. (d) Similar to (b) but for the 2002 El Niño event. (e) Similar to (b) but for the 2006 El Niño and IOD+ event. (f) Similar to (b) but for the 2009 El Niño event. (g) Similar to (b) but for the Super 2015 El Niño event. (h) Similar to (b) but for the 2019 IOD+ event.
Figure 3
Figure 3
(a) Correlation between GWL and EMT, EPV, SST, Rainfall, DMI and Nino34, during El Niño and IOD events. (b) Time series of GWL (black line), rainfall (green bar), Nino34 (red), DMI (purple), SST (magenta), Ekman mean transport (EMT) (blue), and Ekman pumping velocity (EPV) (cyan) anomalies for 1994 weak El Niño but strong Indian Ocean dipole positive (IOD+) event. (c) Similar to (b) but for the 1997 Super El Niño event. (d) Similar to (b) but for the 2002 El Niño event. (e) Similar to (b) but for the 2006 El Niño and IOD+ event. (f) Similar to (b) but for the 2009 El Niño event. (g) Similar to (b) but for the Super 2015 El Niño event. (h) Similar to (b) but for the 2019 IOD+ event.
Figure 4
Figure 4
Diagram of the interconnections among energy, the water cycle, and SSTA over the IMC, Pacific Ocean, and the Indian Ocean along the equator during ENSO and IOD events. GWL is groundwater level, and LSL is land-surface level. The GWL dropped a few weeks before the El Nino event.
Figure 5
Figure 5
Diagram of the mechanisms of the IMC peatland—global climate link through the sea–air–land interactions. This response to two re-acknowledged processes between IMC convection—global atmospheric circulation and between IMC land water—tropical ocean, in addition to the well-studied process between tropical ocean—global atmosphere (TOGA). (a) Condition for the present climate with the IMC peatland forest and wetness (high GWL), convection and rainfall are generated by the land–sea temperature contrast (with diurnal cycle) and sufficiently wetland surface (high humidity in the lower atmosphere) in the IMC. The sea–surface temperature varying with ENSO and IOD makes flood (no-fire) and drought (peat and fire) well known. (b) Condition if the peatland is more and more degraded, the dry land suppresses convection in the IMC. Such suppression of the IMC convection appears in the El Niño (including Modoki) or IOD+ phases naturally at present, but the peat land degradation by human activities causes it perpetually, which makes the global climate (predicted as hothouse) beyond the tipping point.

References

    1. Aldrian E, Susanto RD. Identification of three dominant rainfall regions within Indonesia and their relationship to sea surface temperature. Int. J. Climatol. 2003;23:1435–1452. doi: 10.1002/joc.950. - DOI
    1. Susanto RD, Wei Z, et al. Oceanography surrounding Krakatau Volcano in the Sunda Strait, Indonesia. Oceanography. 2016;29(2):228–237. doi: 10.5670/oceanog.2016.31. - DOI
    1. Bryden HL, Imawaki S. Ocean transport of heat. In: Siedler G, Church J, Gould J, editors. Ocean Circulation and Climate. Academic Press; 2001. pp. 455–475.
    1. Sprintall J, Gordon AL, Koch-Larrouy A, Lee T, Potemra JT, Pujiana K, Wijffels S. The Indonesian Seas and their role in the coupled ocean-climate system. Nat. Geosci. 2014;7:487–492. doi: 10.1038/ngeo2188. - DOI
    1. Lee T, Fukumori I, Menemenlis D, Xing Z, Fu LL. Effects of the Indonesian throughflow on the Pacific and Indian Ocean. J. Phys. Oceanogr. 2002;32:1404–1429. doi: 10.1175/1520-0485(2002)032<1404:EOTITO>2.0.CO;2. - DOI