. 2023 Jan 18;6(1):70.
doi: 10.1038/s42003-022-04400-x.

A streamlined tandem tip-based workflow for sensitive nanoscale phosphoproteomics

Affiliations

A streamlined tandem tip-based workflow for sensitive nanoscale phosphoproteomics

Chia-Feng Tsai et al. Commun Biol. .

Abstract

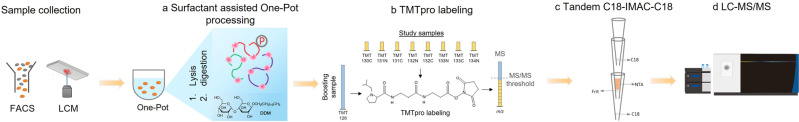
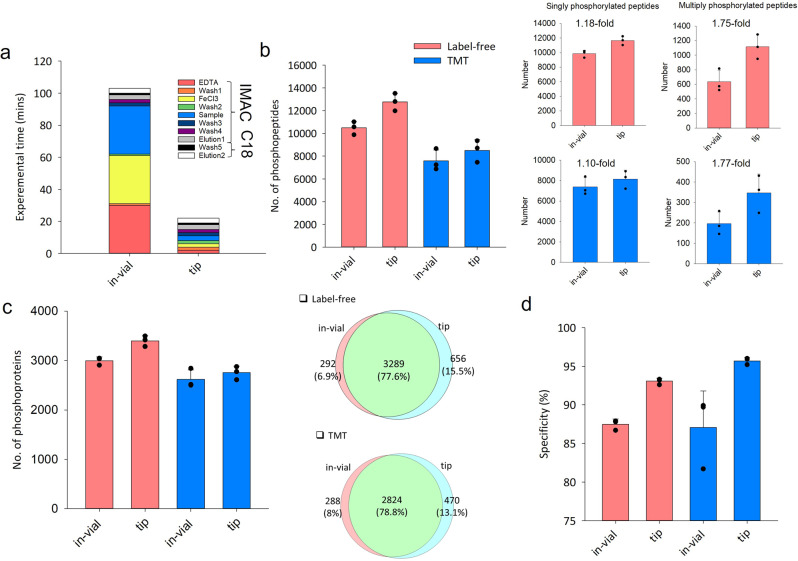
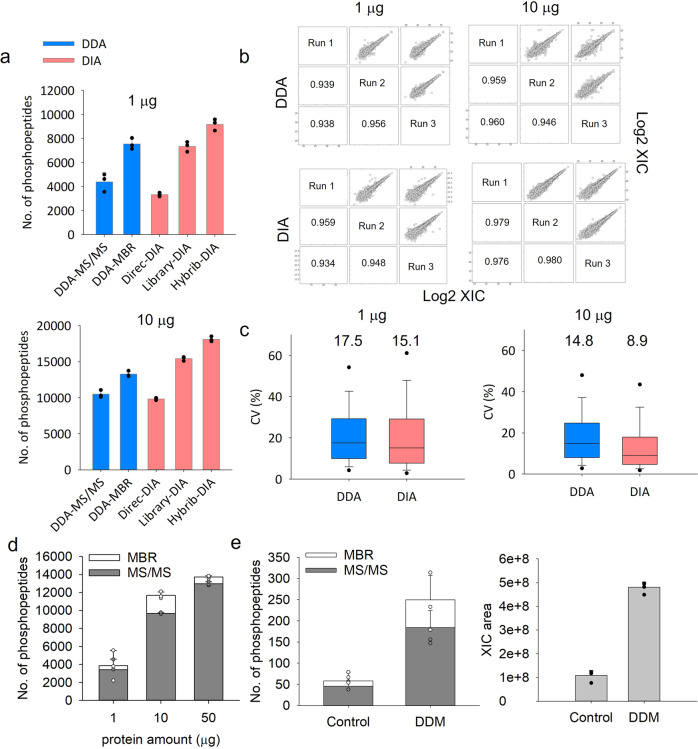
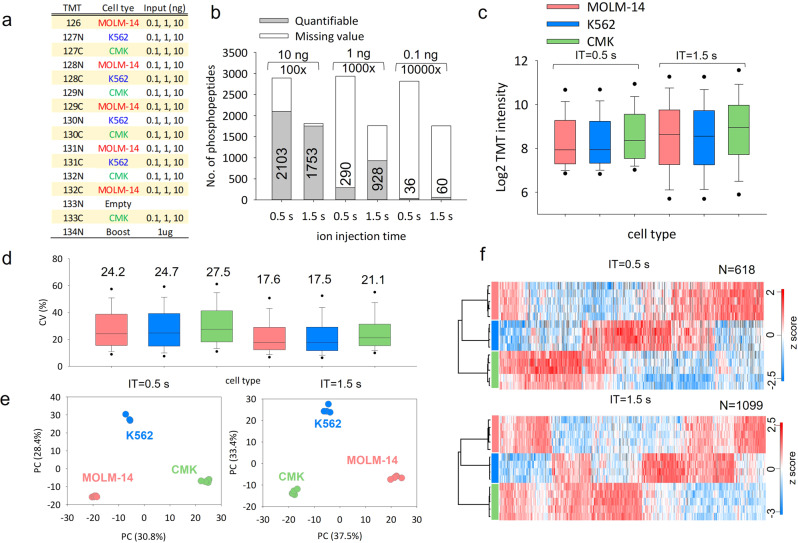
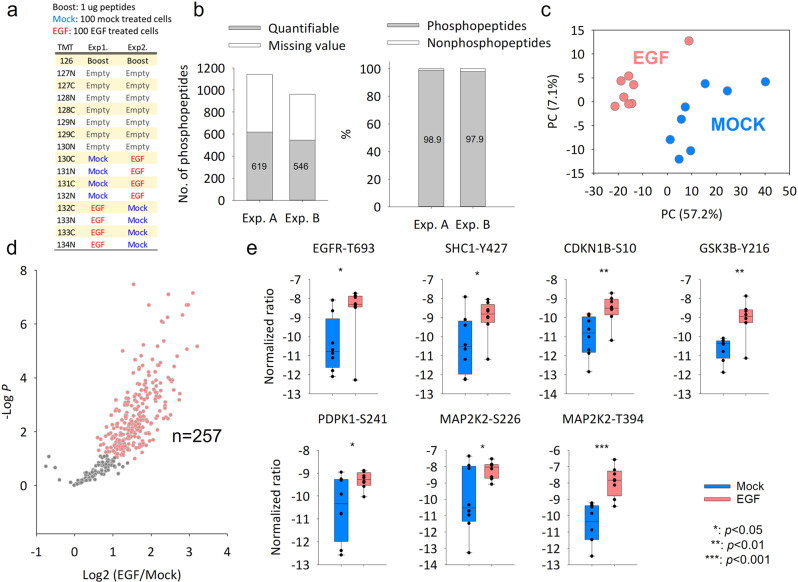
Effective phosphoproteome of nanoscale sample analysis remains a daunting task, primarily due to significant sample loss associated with non-specific surface adsorption during enrichment of low stoichiometric phosphopeptide. We develop a tandem tip phosphoproteomics sample preparation method that is capable of sample cleanup and enrichment without additional sample transfer, and its integration with our recently developed SOP (Surfactant-assisted One-Pot sample preparation) and iBASIL (improved Boosting to Amplify Signal with Isobaric Labeling) approaches provides a streamlined workflow enabling sensitive, high-throughput nanoscale phosphoproteome measurements. This approach significantly reduces both sample loss and processing time, allowing the identification of >3000 (>9500) phosphopeptides from 1 (10) µg of cell lysate using the label-free method without a spectral library. It also enables precise quantification of ~600 phosphopeptides from 100 sorted cells (single-cell level input for the enriched phosphopeptides) and ~700 phosphopeptides from human spleen tissue voxels with a spatial resolution of 200 µm (equivalent to ~100 cells) in a high-throughput manner. The new workflow opens avenues for phosphoproteome profiling of mass-limited samples at the low nanogram level.


Conflict of interest statement

The authors declare no competing interests.

Figures

Fig. 1
Fig. 1. A streamlined tandem tip-based workflow for nanoscale phosphoproteomics.
a The proteins are digested by our recently developed SOP (Surfactant-assisted One-Pot) approach. b The digested peptides are labeled with TMTpro reagents for sample multiplexing. c TMT labeled phosphopeptides are purified by tandem tip-based C18-IMAC-C18. d The enriched phosphopeptides are analyzed by LC-MS/MS applying iBASIL settings.
Fig. 2
Fig. 2. Comparison of in-vial and tip-based IMAC for phosphopeptide enrichment.
a The processing time for in-vial and tip-based IMAC. The numbers of identified phosphopeptides (b), phosphoproteins (c) and the specificity of phosphopeptide enrichment (d) for unlabeled and TMT-labeled peptides from MCF-7 cells using the in-vial and tip-based IMAC are shown. Sample amount: 150 μg of peptides. The error bars represent the standard deviation (n = 3).
Fig. 3
Fig. 3. Evaluation of the performance of tandem C18-IMAC-C18.
The number of phosphopeptides (a), reproducibility (Pearson correlation) (b) and CV (%) (c) of phosphoproteomics analyses of 1 and 10 μg of proteins from mixture of 3 AML cells using single-shot DDA and DIA. A phosphoproteome spectrum library constructed from data described in Fig. S3c, d was used for Library DIA and MBR DDA analysis. d The numbers of identified phosphopeptides (with and without MBR) from 1, 10 and 50 μg of A549 cell lysates. e The numbers of identified phosphopeptides (with and without MBR) and XIC area for 0.1 μg of A549 cell lysates with and without DDM. The error bars represent the standard deviation (n = 3).
Fig. 4
Fig. 4. Mimic nanoscale phosphoproteome analysis using tip-IMAC and iBASIL.
a The TMT experiment design for the phosphoproteomics analysis of tryptic digests (0.1, 1 and 10 ng) from three different types of AML cells (MOLM-14, K562 and CMK). b The numbers of quantified phosphopeptides (70% no-missing value in study samples) from 0.1, 1 and 10 ng of tryptic digests under different ion injection times (0.5 and 1.5 s). The TMT reporter ion intensity distribution (c), CV (%) of replicate experiments (d), PCA analysis (e), and heatmap of significantly changed phosphopeptides of the 10-ng input samples under different ion injection times (f).
Fig. 5
Fig. 5. Phosphoproteome analysis of 100 MCF10A cells sorted by FACS using the streamlined SOP/C18-IMAC-C18/iBASIL workflow.
a The TMT experiment design. b The number of quantified phosphopeptides (70% no-missing value in study samples) and the enrichment specificity in each TMT experiment. c PCA analysis shows the cells cluster under the two different conditions. d Volcano plot shows significantly changed phosphopeptides between EGF-treated cells and mock cells (t-test, n = 8 for each condition; s0 = 1 and FDR = 0.05% were used as cut-off values) (e) The significantly altered phosphorylation sites in the ErbB signaling pathway. Y-axis means the normalized TMT intensity after medium centering and batch correction by Combat (t-test, n = 8).
Fig. 6
Fig. 6. Phosphoproteome analysis of LCM-dissected human spleen tissue voxels.
a The optical image and the TMT experiment design of the white (TMT132C, TMT131N, TMT133C, and TMT134N), and red pulp regions (TMT130C, TMT131N, TMT131C, and TMT132N), and the number of quantified phosphopeptides from IMAC eluent and proteins from IMAC flow-through (FT). b The overlap of quantified proteins between IMAC eluent and FT. c PCA of the phosphoproteome data. d Volcano plot (t-test, n = 8 for each condition; s0 = 1 and FDR = 0.05% were used as cut-off values) shows significantly changed phosphopeptides in white pulp and red pulp. e The significantly altered phosphorylation sites in the MSFA1 (CD20) proteins. f The annotated pathway for the significantly up-regulated phosphorylation peptides in white or red pulp regions by STRING. g The quantitation correlation between global and phosphoproteome. h Known signaling transduction for triggering apoptosis in activated B cells.

References

    1. Woo J, et al. Author correction: high-throughput and high-efficiency sample preparation for single-cell proteomics using a nested nanowell chip. Nat. Commun. 2021;12:7075. doi: 10.1038/s41467-021-27110-0. - DOI - PMC - PubMed
    1. Specht H, et al. Single-cell proteomic and transcriptomic analysis of macrophage heterogeneity using SCoPE2. Genome Biol. 2021;22:50. doi: 10.1186/s13059-021-02267-5. - DOI - PMC - PubMed
    1. Cong Y, et al. Ultrasensitive single-cell proteomics workflow identifies >1000 protein groups per mammalian cell. Chem. Sci. 2020;12:1001–1006. doi: 10.1039/D0SC03636F. - DOI - PMC - PubMed
    1. Schoof EM, et al. Quantitative single-cell proteomics as a tool to characterize cellular hierarchies. Nat. Commun. 2021;12:3341. doi: 10.1038/s41467-021-23667-y. - DOI - PMC - PubMed
    1. Polat AN, Ozlu N. Towards single-cell LC-MS phosphoproteomics. Analyst. 2014;139:4733–4749. doi: 10.1039/C4AN00463A. - DOI - PubMed

Publication types