. 2023 Feb;614(7946):125-135.
doi: 10.1038/s41586-022-05620-1. Epub 2023 Jan 18.

The person-to-person transmission landscape of the gut and oral microbiomes

Affiliations

The person-to-person transmission landscape of the gut and oral microbiomes

Mireia Valles-Colomer et al. Nature. 2023 Feb.

Abstract

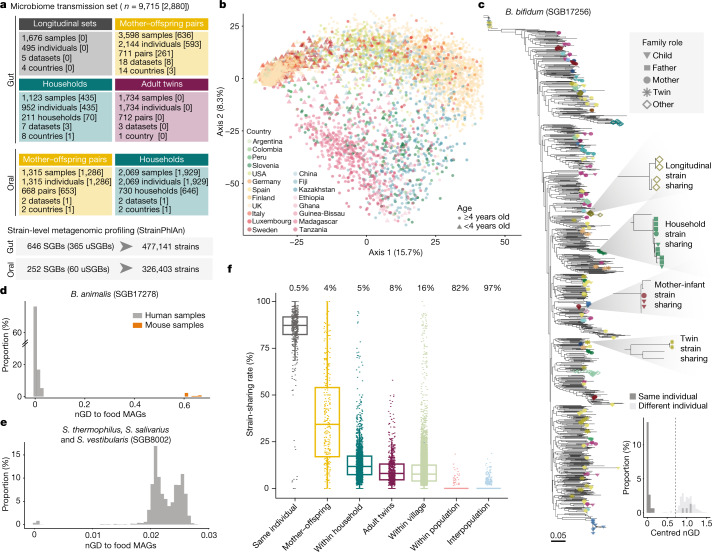
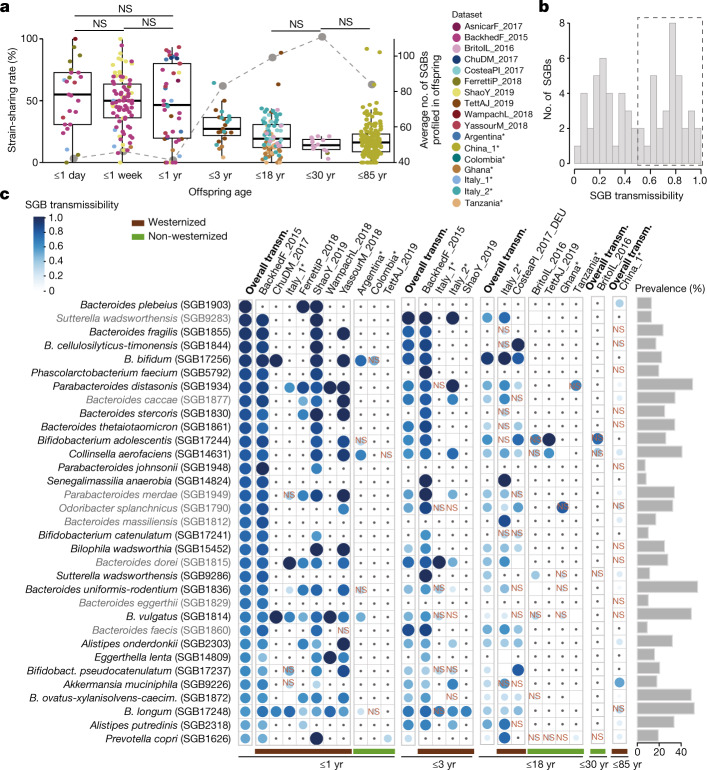
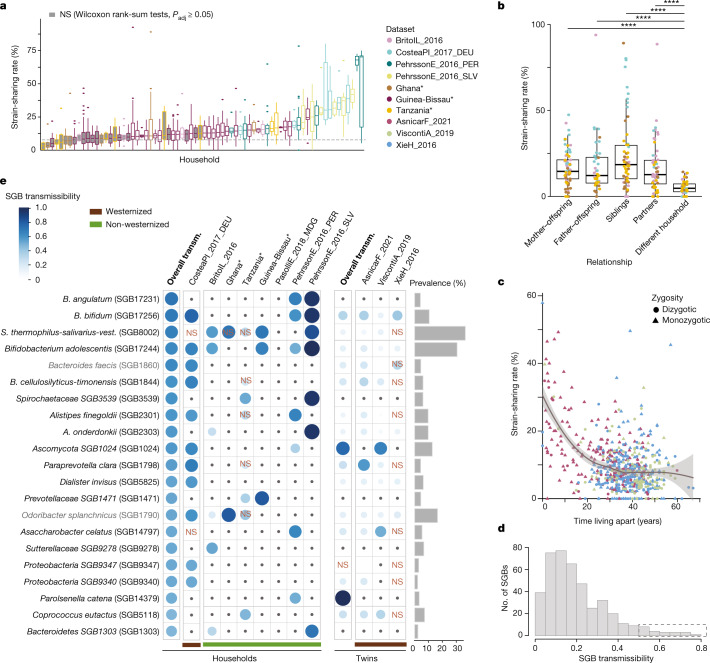
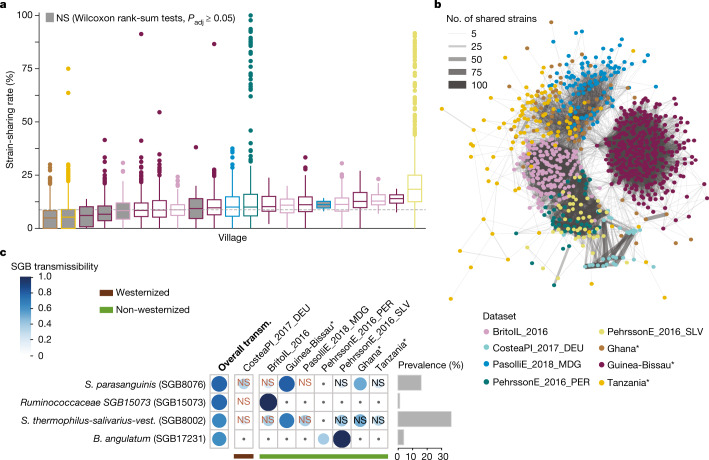
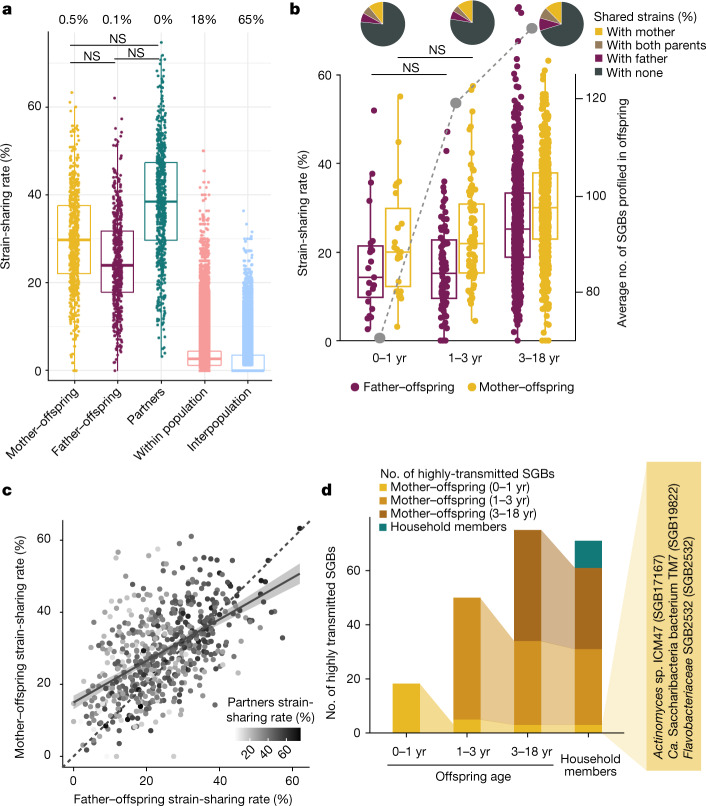
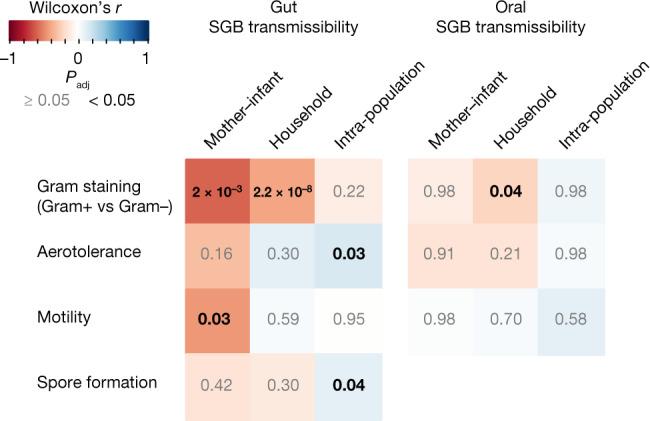
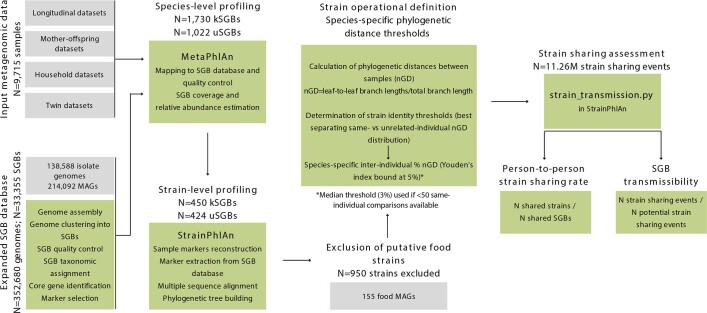
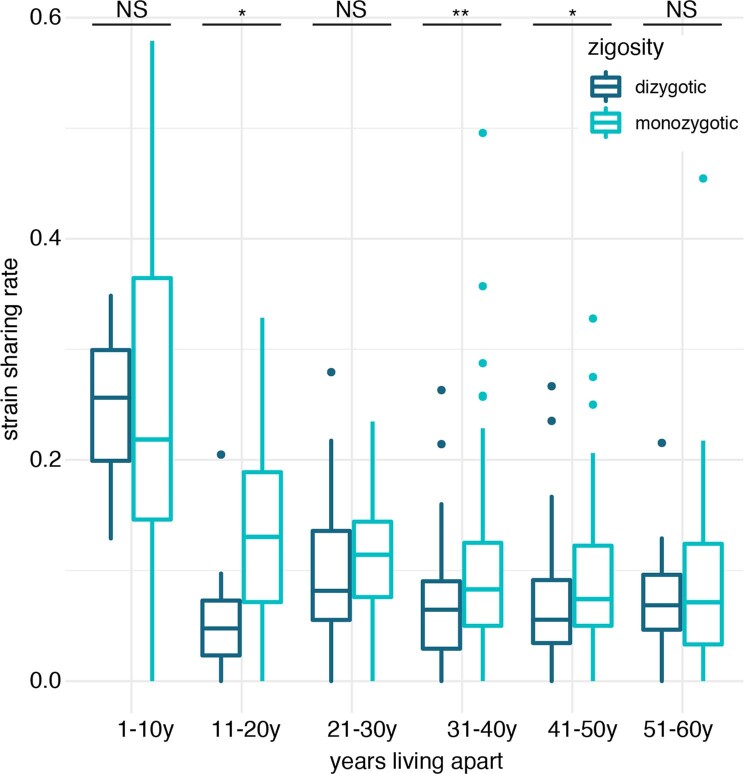
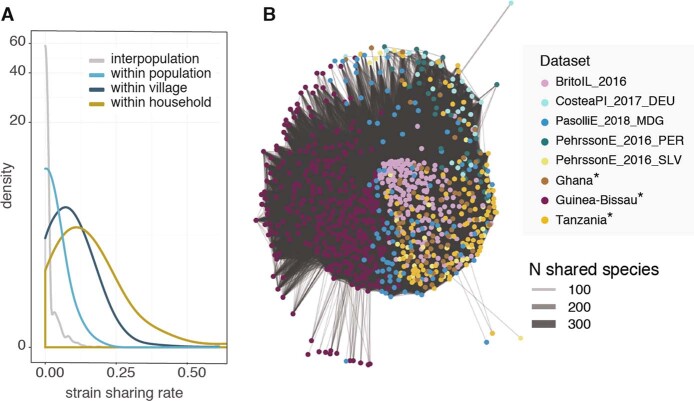
The human microbiome is an integral component of the human body and a co-determinant of several health conditions1,2. However, the extent to which interpersonal relations shape the individual genetic makeup of the microbiome and its transmission within and across populations remains largely unknown3,4. Here, capitalizing on more than 9,700 human metagenomes and computational strain-level profiling, we detected extensive bacterial strain sharing across individuals (more than 10 million instances) with distinct mother-to-infant, intra-household and intra-population transmission patterns. Mother-to-infant gut microbiome transmission was considerable and stable during infancy (around 50% of the same strains among shared species (strain-sharing rate)) and remained detectable at older ages. By contrast, the transmission of the oral microbiome occurred largely horizontally and was enhanced by the duration of cohabitation. There was substantial strain sharing among cohabiting individuals, with 12% and 32% median strain-sharing rates for the gut and oral microbiomes, and time since cohabitation affected strain sharing more than age or genetics did. Bacterial strain sharing additionally recapitulated host population structures better than species-level profiles did. Finally, distinct taxa appeared as efficient spreaders across transmission modes and were associated with different predicted bacterial phenotypes linked with out-of-host survival capabilities. The extent of microorganism transmission that we describe underscores its relevance in human microbiome studies5, especially those on non-infectious, microbiome-associated diseases.


Conflict of interest statement

The authors declare no competing interests.

Figures

Fig. 1
Fig. 1. A metagenomic framework to survey person-to-person microbiome strain transmission.
a, Overview of the study and dataset based on the SGB framework (Methods). Numbers in square brackets are the number of units sequenced in this study. b, Overall species-level structure of the gut samples (principal component analysis on Aitchison distance, one random sample per individual, n = 4,840). Samples are coloured by country and shapes indicate age. c, Phylogeny of B. bifidum (SGB17256) (Methods), a low-prevalence highly transmitted species (Supplementary Table 9), showing the genetic diversity of strains and the shared strains between samples of the same individual and between different individuals. One example of strain sharing is highlighted for each relationship type. Tree leaves involved in strain-sharing instances are coloured by dataset (Extended Data Fig. 1b) and their shapes reflect kinship. Bottom, the distribution of pairwise centred nGDs of the species in individuals sampled at two time points (less than six months apart, ‘same individual’) and in unrelated individuals (‘different individual’; Extended Data Fig. 3 and Methods), confirming the suitability of the methodology to infer strain identity. d,e, The distribution of pairwise nGDs between B. animalis (SGB17278) (d) and S. thermophilus, S. salivarius and S. vestibularis (SGB8002) (e) strains reconstructed from human gut metagenomes or mouse samples and MAGs reconstructed from fermented food. The presence of B. animalis in humans is associated with the consumption of commercial dietary products (Extended Data Fig. 4a), whereas only a subset of S. thermophilus, S. salivarius and S. vestibularis strains is associated with fermented food intake (Extended Data Fig. 4b). f, Person-to-person strain-sharing rates (number of shared strains/number of shared SGBs × 100%) across relationship types. All comparisons are statistically significant (Kruskal–Wallis test, n = 26,218, χ2 = 11,420, P < 2.2 × 10−16, post hoc Dunn tests, Padj < 0.05; Supplementary Table 7). In box plots, box edges delineate lower and upper quartiles, the centre line represents the median and whiskers extend to 1.5 times the interquartile range (IQR). The number along the top is the percentage of pairs between which no strain-sharing event was detected.
Fig. 2
Fig. 2. Mother–offspring sharing of the gut microbiome.
a, Mother–offspring strain-sharing rates (left axis; box plots and non-grey dots) decrease, whereas species richness (right axis; grey dots) in offspring increases, as a function of offspring age (17 datasets in 14 countries). The median number of SGBs profiled by StrainPhlAn in the offspring is used as a proxy for richness (right axis). Kruskal–Wallis test, n = 448, χ2 = 156, P < 2.2 × 10−16, post hoc Dunn tests; NS, not significant (Padj ≥ 0.05); all other comparisons are significant (Supplementary Table 10). In box plots, box edges delineate lower and upper quartiles, the centre line represents the median and whiskers extend to 1.5 times the IQR. Novel datasets from the present study are highlighted with asterisks. b, The distribution of mother–infant SGB transmissibility in the first year of life. c, A panel of 33 SGBs that are highly maternally transmitted during their first year of life (SGB transmissibility >0.5 and significantly higher mother–infant transmissibility than unrelated mother–infant transmissibility; Methods) showing their transmissibility (transm.) in specific datasets (separated by westernized-lifestyle status) and in other age categories. NS, non-significant SGB transmissibility in the category (χ2 test on the number of transmitted and non-transmitted SGBs between mother–offspring pairs and between unrelated mother and offspring pairs, Supplementary Table 16). Only comparisons with at least three possible transmissions (species shared by at least three mother–offspring pairs) are shown; comparisons with less than three possible transmissions are marked with a dot. Prevalence is defined as the percentage of mother–offspring samples in which the SGB was detected. Novel datasets from the present study are highlighted with asterisks. SGB names in grey use a strain identity threshold of 5% inter-individual nGD (Supplementary Table 4). B. cellulosilyticus-timonensis, Bacteroides cellulosilyticus and Bacteroides timonensis; Bacteroides uniformis-rodentium, Bacteroides uniformis and Bacteroides rodentium; B. pseudocatenulatum, Bifidobacterium pseudocatenulatum; B. ovatus-xylanisolvens-caecim., Bacteroides caecimuris.
Fig. 3
Fig. 3. Within-household and between-household gut microbiome transmission.
a, Pairwise person-to-person strain-sharing rates (number of shared strains/number of SGBs in common × 100%) in 72 households with at least four cohabiting individuals (n = 883). The dashed line shows the median sharing rate among individuals in different households of the same village. Grey-filled boxes represent households with intra-household strain-sharing rates that are not significantly higher than inter-household sharing rates in the same population (Wilcoxon rank-sum two-sided tests, Padj ≥ 0.05; Supplementary Table 17). In box plots, box edges delineate lower and upper quartiles, the centre line represents the median and whiskers extend to 1.5 times the IQR. Novel datasets from the present study are highlighted with asterisks. b, Strain-sharing rates between individuals in households. Post hoc Dunn two-sided tests, n = 282, ****Padj < 10−4 (Supplementary Table 18). In box plots, box edges delineate lower and upper quartiles, the centre line represents the median and whiskers extend to 1.5 times the IQR. c, Strain-sharing rate in non-cohabiting adult twins (n = 1,734) decreases as a function of the time spent living apart (loess curve). The shaded area shows the 95% confidence interval. d, Histogram of household SGB transmissibility. e, A panel of 21 SGBs that are highly transmitted in households (SGB transmissibility >0.5 and significantly higher intra-household than inter-household transmissibility) showing their transmissibility in specific datasets and in non-cohabiting adult twins. NS, non-significant SGB transmissibility in the category (Chi-squared test on the number of transmitted and non-transmitted SGBs between household pairs and between pairs in different households; Supplementary Table 20). Only comparisons with at least three possible transmissions (species shared by at least three cohabiting pairs) are shown; comparisons with less than three possible transmissions are marked with a dot. Prevalence is defined as the percentage of samples in which the SGB was detected. Novel datasets from the present study are highlighted with asterisks. SGB names in grey use a strain identity threshold of 5% inter-individual nGD (Supplementary Table 4). S. thermophilus-salivarius-vest., S. thermophilus, S. salivarius and S. vestibulari.
Fig. 4
Fig. 4. Gut microbiome transmission along villages and populations.
a, Person-to-person strain-sharing rates in different households of a village (n = 1,132). The dashed line shows the median strain-sharing rate among individuals in different villages of the same dataset. In box plots, box edges delineate lower and upper quartiles, the centre line represents the median and whiskers extend to 1.5 times the IQR. Grey-filled boxes show non-significant differences between the within village and inter-village person-to-person strain-sharing rate (Wilcoxon rank-sum two-sided tests, Padj ≥ 0.05; Supplementary Table 23). b, Gut microbiome strain-sharing unsupervised network of individuals in household datasets displaying population structure. Line width is proportional to the number of shared strains. c, Highly transmitted SGBs between individuals in different households (SGB transmissibility >0.5 and significantly higher intra-population than inter-population transmissibility), and transmissibility of these SGBs in specific datasets (classified by westernization status). NS, non-significant SGB transmissibility in the category (Chi-squared two-sided tests on the number of transmitted and non-transmitted SGBs between inter-household pairs and between pairs in different datasets; Supplementary Table 24). Only comparisons with at least three possible transmissions (species shared by at least three pairs) are shown; comparisons with less than three possible transmissions appear with a dot. Prevalence is defined as the percentage of samples in which the SGB was detected. Novel datasets from the present study are highlighted with asterisks.
Fig. 5
Fig. 5. Transmission of the oral microbiome.
a, Person-to-person strain-sharing rates (number of shared strains/number of SGBs in common × 100%) across relationships (n = 2,069). All comparisons are statistically significant unless stated otherwise (Kruskal–Wallis test, n = 26,218, χ2 = 11,420, P < 2.2 × 10−16, post hoc Dunn two-sided tests, Padj < 0.05; Supplementary Table 28). Numbers along the top show the percentage of pairs between which no strain-sharing event was detected. b, Mother–offspring and father–offspring sharing rates (number of shared strains/number of SGBs in common × 100%) (n = 2,069) (left axis; box plot and non-grey dots) and median number of SGBs detected in the offspring (right axis; grey dots). Post hoc Dunn two-sided tests, Supplementary Table 29. All comparisons are statistically significant after correction for multiple testing unless stated otherwise. In box plots, box edges delineate lower and upper quartiles, the centre line represents the median and whiskers extend to 1.5 times the IQR. Pie charts show the percentage of strains shared between pairs of individuals. c, Strain sharing across cohabiting individual relationships are positively correlated (Spearman’s two-sided tests, mother–offspring and father–offspring: n = 637, ρ = 0.52, P < 2.2 × 10−16; mother–offspring and partners: n = 611, ρ = 0.21, P = 1.2 × 10−7; father–offspring and partners: n = 611, ρ = 0.38, P < 2.2 × 10−16). Dashed line is the diagonal, where mother–offspring strain-sharing rate is equal to father–offspring strain-sharing rate. The shaded area shows the 95% confidence interval. d, The persistence of highly transmitted SGBs (SGB transmissibility >0.5 and significantly higher intra-household than inter-household transmissibility) between mother and offspring across age categories and among household members who are at least four years of age. Ca., Candidatus.
Fig. 6
Fig. 6. Association between gut and oral species transmissibility and phenotypical properties.
SGB phenotypes were inferred using Traitar (Methods). Association between SGB transmissibility and predicted phenotypes was assessed with Wilcoxon rank-sum two-sided tests on the 25% of SGBs displaying the highest transmissibility and compared with the 25% of SGBs displaying the lowest transmissibility for each transmission mode and environment. Colours represent the Wilcoxon r statistics; significant Padj values are shown in black (Padj < 0.05) and in grey otherwise.
Extended Data Fig. 1
Extended Data Fig. 1. Data overview.
A) Species-level ordination (PCoA on Aitchison distance, N = 2,069 samples) reflecting the overall microbiome diversity spanned by the oral microbiome samples considered. Samples are coloured by country, while shapes depict age. B) Colour code of the samples in the phylogenetic tree in Fig. 1c, representing the datasets they belong to.
Extended Data Fig. 2
Extended Data Fig. 2. Strain sharing workflow.
Workflow used to assess strain sharing in the current manuscript.
Extended Data Fig. 3
Extended Data Fig. 3. Species-specific operational definitions of strain.
Comparison of same-individual (green) to unrelated individual (purple) genetic distance comparisons for the 25 most prevalent SGBs in gut metagenome longitudinal datasets. Strain identity thresholds were set as the Youden’s index (black dashed line) or as the 5th percentile of the unrelated individual comparisons (red dashed line) when the first was above 5% (e.g. Parabacteroides merdae [SGB1949]). Centred nGD: normalised phylogenetic distance divided by the median nGD of the phylogenetic tree. The N in each histogram corresponds to the number of same-individual comparisons in which each SGB was profiled at strain-level.
Extended Data Fig. 4
Extended Data Fig. 4. Phylogenetic trees of species containing strains found in food.
A) Phylogeny of Bifidobacterium animalis (SGB17278) produced with StrainPhlAn (Methods) including strains reconstructed from human gut metagenomes, from mice samples (grey dots) and MAGs reconstructed from fermented food 32 (yellow dots). Differently from strains found in mice, 94% of human-derived strains are at ≤0.0015 single nucleotide variation (SNV) rate to MAGs obtained from fermented food (Methods), suggesting that the presence of this species in humans is associated with consumption of commercial dietary products, and were consequently excluded from further analyses (horizontal grey bars). B) Phylogeny of Streptococcus thermophilus-salivarius-vestibularis (SGB8002) produced with StrainPhlAn (Methods) including strains reconstructed from human gut metagenomes together with MAGs reconstructed from fermented food 32 (yellow dots), suggesting only a subset of strains found in the human gut is associated with fermented food intake. Only the leaves in the enlarged subtree (“Fermented food subtree”) were at ≤0.0015 single nucleotide variation (SNV) rate to MAGs obtained from fermented food (Methods) and were consequently excluded from further analyses.
Extended Data Fig. 5
Extended Data Fig. 5. Strain and species-level similarity across relationships.
A) Gut microbiome strain sharing rates and species-level similarity metrics (Aitchison similarity, Bray-Curtis similarity, and Jaccard binary similarity) between individuals in the same household (“within household”) as compared to unrelated non-cohabiting individuals in different villages of the same population (“within population”) and individuals in different populations (“interpopulation”). For comparability with strain sharing rates, species-level comparisons are depicted as similarity indices (1 - distance or dissimilarity). All comparisons are significant (Padj<0.05, Kruskal-Wallis tests with Post-hoc Dunn tests, Table S8). The social-distance based gradient followed by strain sharing rates is notably stronger than that observed by species-level similarity metrics (Table S8). Boxes: lower and upper quartiles, middle line: median; whiskers: 1.5 × IQR. B) Oral microbiome strain sharing rates and species-level similarity metrics (Aitchison, Bray-Curtis, and Jaccard binary similarities) between individuals in the same household (“within household”) as compared to unrelated non-cohabiting individuals in different villages of the same population (“within population”) and individuals in different populations (“interpopulation”). For comparability with strain sharing rates, species-level comparisons are depicted as similarity indices (1 - distance or dissimilarity). All comparisons are significant (Padj<0.05, Kruskal-Wallis tests with Post-hoc Dunn tests, Table S28). Boxes: lower and upper quartiles, middle line: median; whiskers: 1.5 × IQR.
Extended Data Fig. 6
Extended Data Fig. 6. Mother to offspring gut microbiome transmission.
A) Strain acquisition rates by the offspring tend to decrease as a function of the offspring’s age. Strain acquisition rates by the offspring are defined as the proportion of strains profiled in the offspring that are shared with their mother, computed in 17 datasets from 14 different countries across pre-defined age categories. Kruskal-Wallis test, Chi2=65, P = 3.57e-12, Post-hoc Dunn tests, NS corresponds to Padj≥0.05, all other comparisons are significant (Table S10). Boxes: lower and upper quartiles, middle line: median; whiskers: 1.5 × IQR. Novel datasets are highlighted with asterisks. B) Strain sharing rates between senior individuals and their non-cohabiting mothers as compared to strain sharing rates between unrelated mother-offspring pairs. Wilcoxon rank-sum test, N = 17,177, r = 0.09, P = 4.1e-35. Boxes: lower and upper quartiles, middle line: median; whiskers: 1.5 × IQR. C) Observed richness (number of SGBs detected with MetaPhlAn) in age categories of offspring from Westernized as compared to non-Westernized populations. Wilcoxon rank-sum tests, N = 721, ***Padj <0.001 and **Padj<0.01, Table S11. Boxes: lower and upper quartiles, middle line: median; whiskers: 1.5 × IQR. D) Mother-offspring strain sharing rates in age categories of offspring delivered by C-section as compared to vaginally-delivered offspring. Wilcoxon rank-sum tests, **Padj<0.01, NS Padj≥0.05, Table S14. Boxes: lower and upper quartiles, middle line: median; whiskers: 1.5 × IQR.
Extended Data Fig. 7
Extended Data Fig. 7. Gut microbiome strain sharing among adult twins.
Dizygotic and monozygotic twin gut microbiome strain sharing rates after decades since cohabitation. Wilcoxon rank-sum tests, N = 708, **Padj<0.01, *Padj<0.05, NS Padj≥0.05, Table S19. Boxes: lower and upper quartiles, middle line: median; whiskers: 1.5 × IQR.
Extended Data Fig. 8
Extended Data Fig. 8. Gut microbiome species and strain sharing among individuals.
A) Density distributions of gut microbiome strain sharing rates between household members (within household), individuals in different households in the same village (within village), individuals in different villages of the same population (within population), and in different populations (interpopulation). B) Gut microbiome species sharing unsupervised network of household datasets. Line width is proportional to the number of shared species. Only connections with ≥50 shared species are shown.
Extended Data Fig. 9
Extended Data Fig. 9. Highly-transmitted SGBs in oral samples.
Same-family (green) to different-family (purple) genetic distance comparisons for the three SGBs consistently and significantly highly-transmitted in oral metagenomes. Strain identity thresholds were set as the 3rd percentile of the unrelated individual comparisons (dashed line).
Extended Data Fig. 10
Extended Data Fig. 10. Assessment of strain identity thresholds.
A) Centred nGD (normalised phylogenetic distance divided by the median nGD of the phylogenetic tree) used as a threshold for strain identity (corresponding to the percentiles of interindividual distributions) by strain definition used, for the 646 SGBs profiled in stool samples. The different percentiles do not result in significant differences in nGD values (Kruskal-Wallis test, Chi2=2.34, P = 0.31). Boxes: lower and upper quartiles, middle line: median; whiskers: 1.5 × IQR. B) Distribution of centred nGD thresholds (normalised phylogenetic distance divided by the median nGD of the phylogenetic tree) by phylum, showing lack of statistically-significant association (Kruskal-Wallis test, Chi2=6.6, P = 0.25). Boxes: lower and upper quartiles, middle line: median; whiskers: 1.5 × IQR. C) Strain identity thresholds (percentile of interindividual nGD distribution) calculated for each of the SGBs prevalent in longitudinal datasets (N = 145 SGBs profiled in at least 50 same-individual pairs) calculated on single datasets compared to the threshold used in the study (determined on all samples).

References

    1. Falony G, et al. Population-level analysis of gut microbiome variation. Science. 2016;352:560–564. doi: 10.1126/science.aad3503. - DOI - PubMed
    1. Asnicar F, et al. Microbiome connections with host metabolism and habitual diet from 1,098 deeply phenotyped individuals. Nat. Med. 2021;27:321–332. doi: 10.1038/s41591-020-01183-8. - DOI - PMC - PubMed
    1. Browne HP, Neville BA, Forster SC, Lawley TD. Transmission of the gut microbiota: spreading of health. Nat. Rev. Microbiol. 2017;15:531–543. doi: 10.1038/nrmicro.2017.50. - DOI - PMC - PubMed
    1. Robinson CD, Bohannan BJ, Britton RA. Scales of persistence: transmission and the microbiome. Curr. Opin. Microbiol. 2019;50:42–49. doi: 10.1016/j.mib.2019.09.009. - DOI - PMC - PubMed
    1. Finlay BB, CIFAR Humans and the Microbiome. Are noncommunicable diseases communicable? Science. 2020;367:250–251. doi: 10.1126/science.aaz3834. - DOI - PubMed

Publication types