. 2023 Jan;613(7945):712-720.
doi: 10.1038/s41586-022-05623-y. Epub 2023 Jan 18.

A molecular network of conserved factors keeps ribosomes dormant in the egg

Affiliations

A molecular network of conserved factors keeps ribosomes dormant in the egg

Friederike Leesch et al. Nature. 2023 Jan.

Abstract

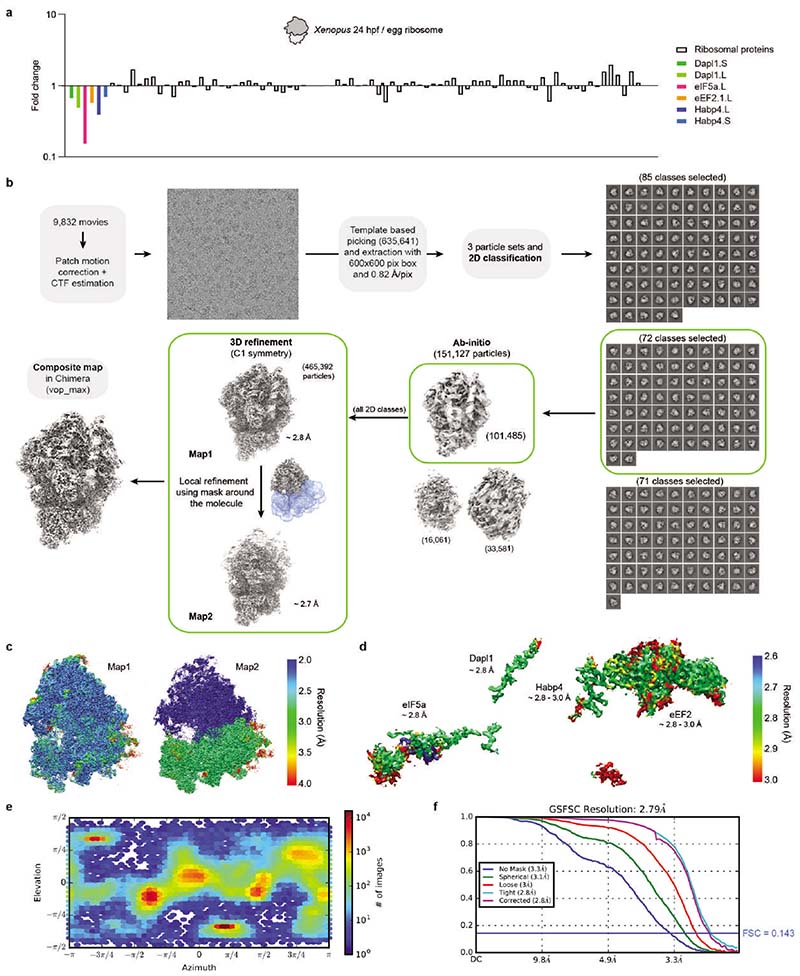
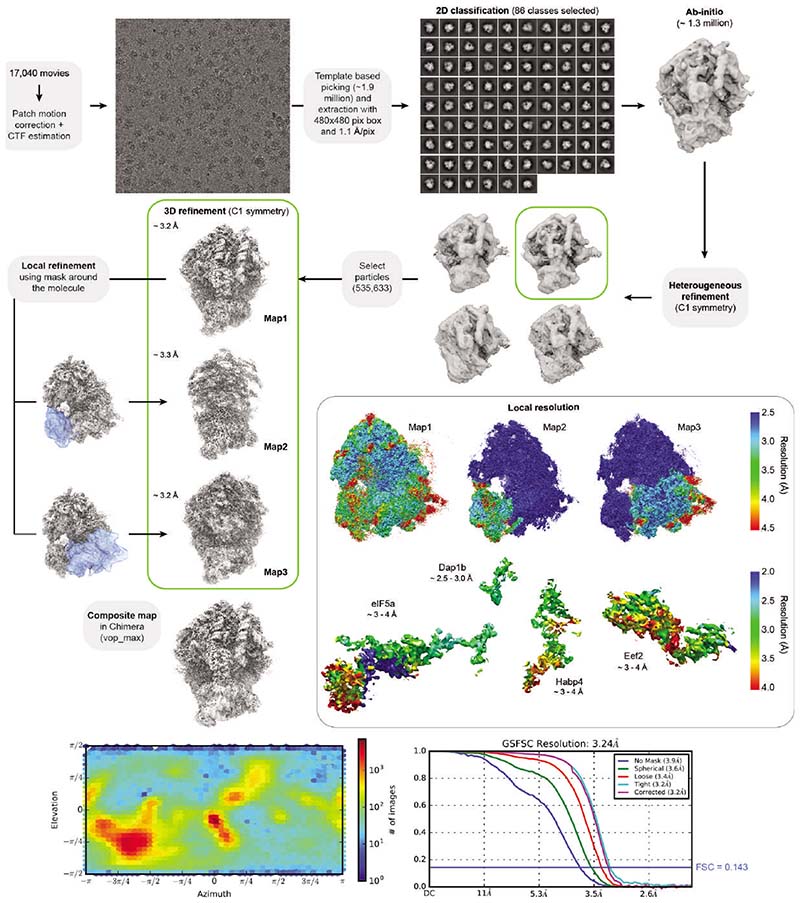
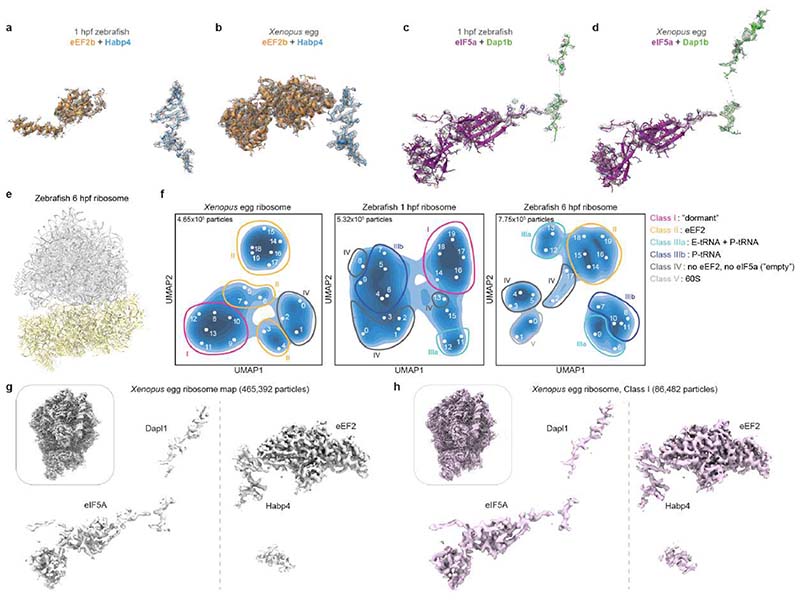
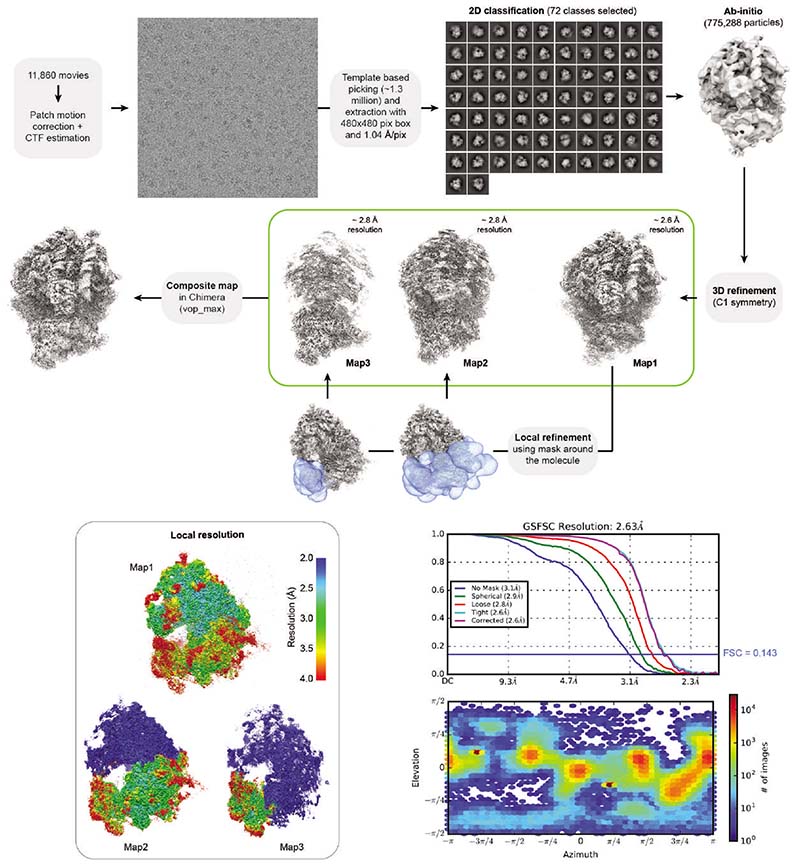
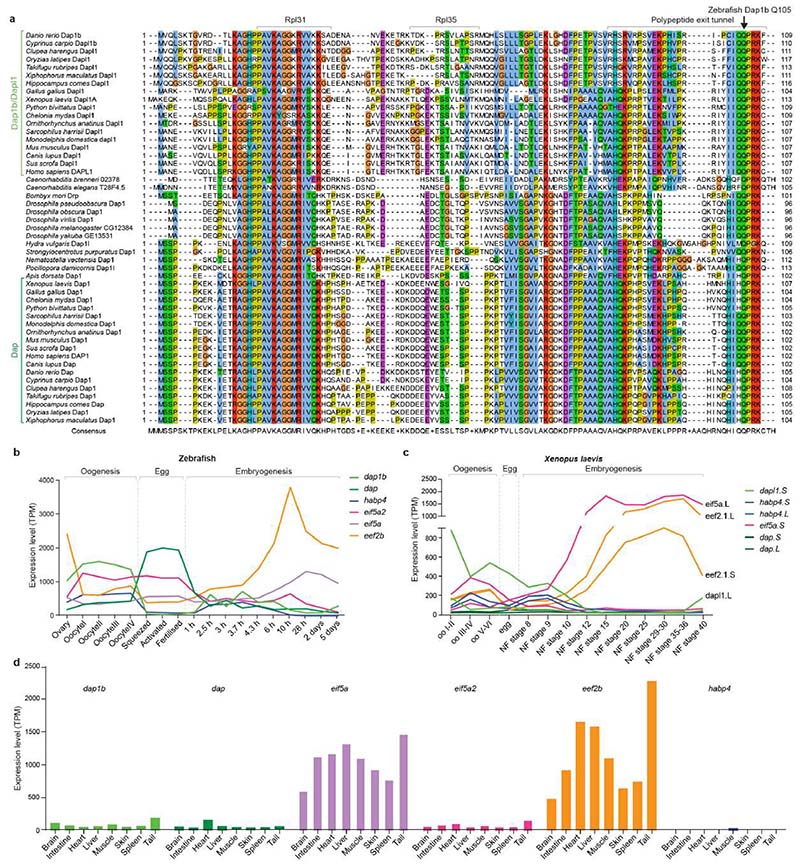
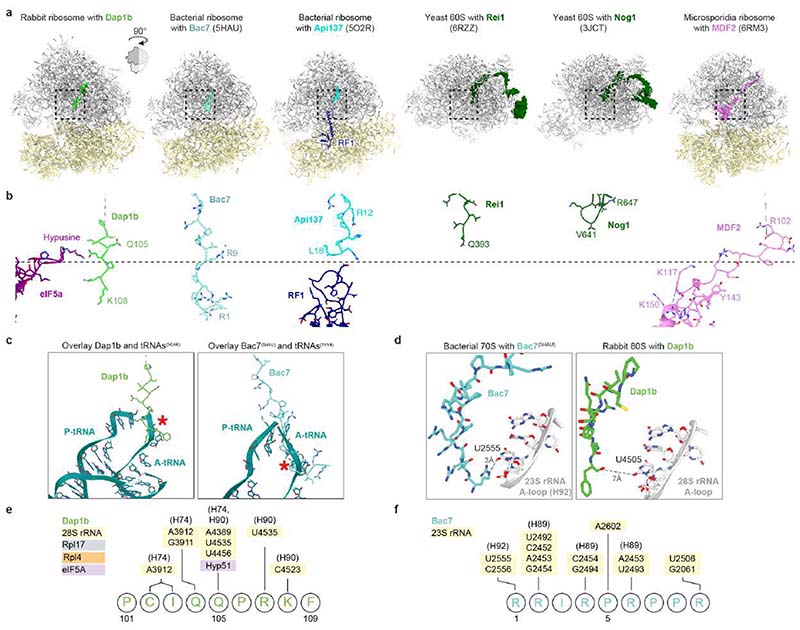
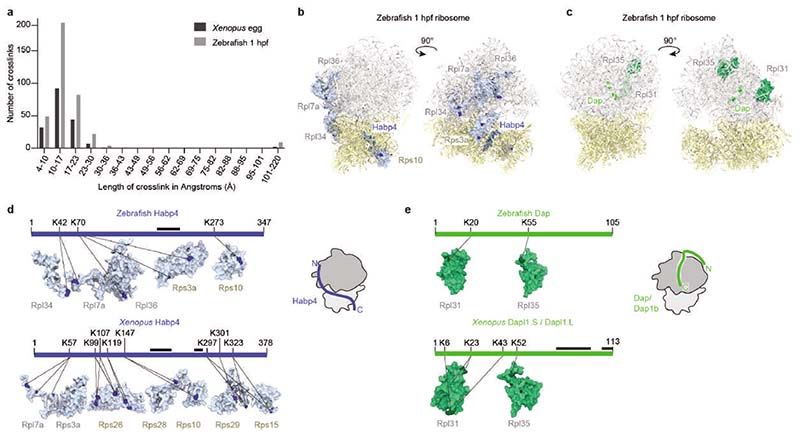
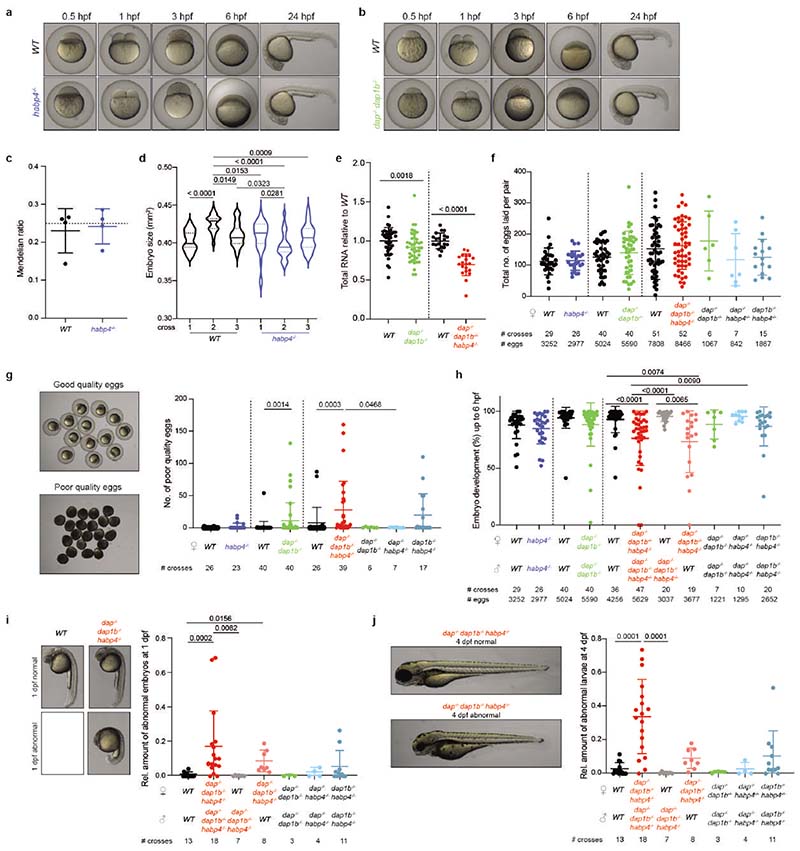
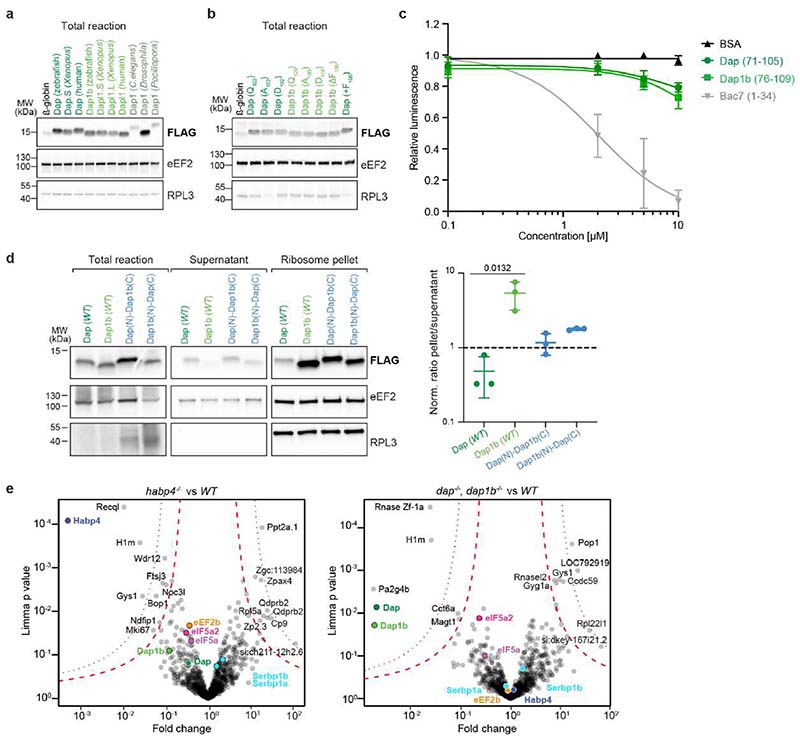
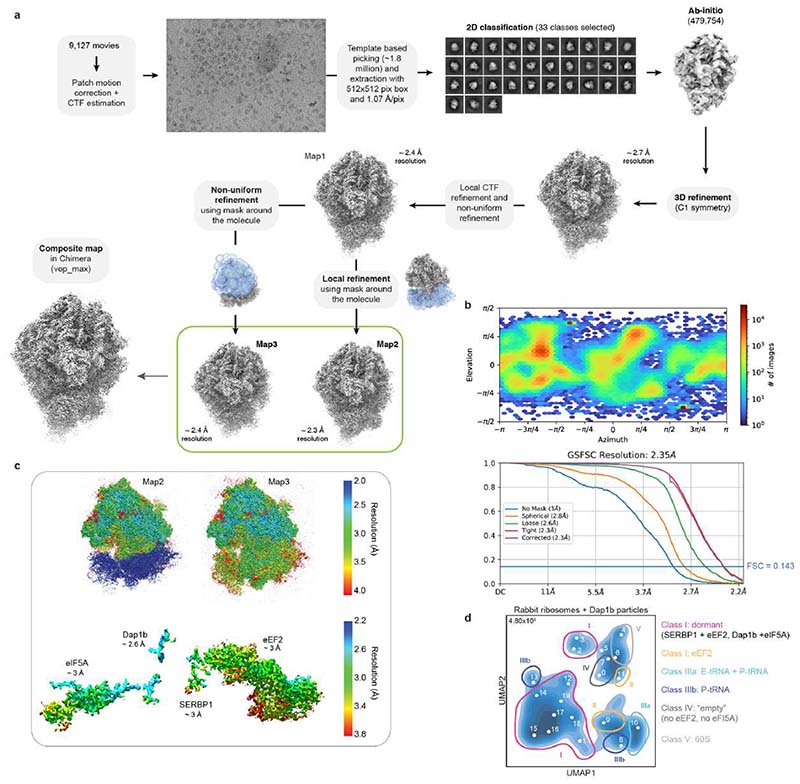
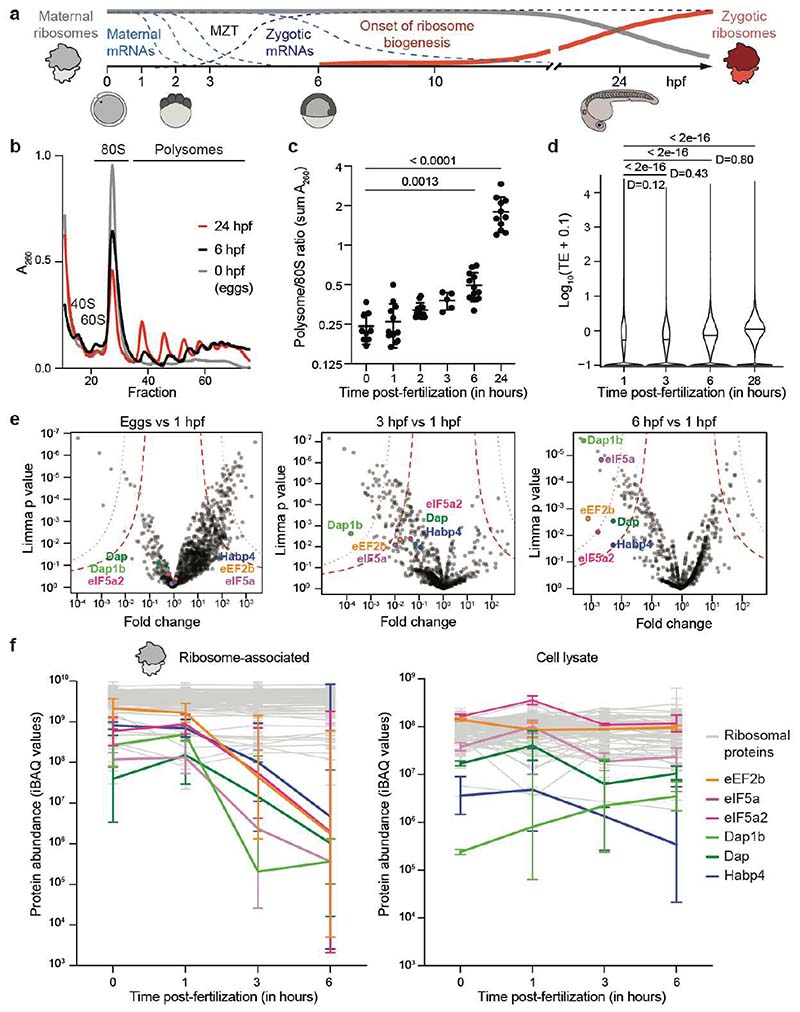
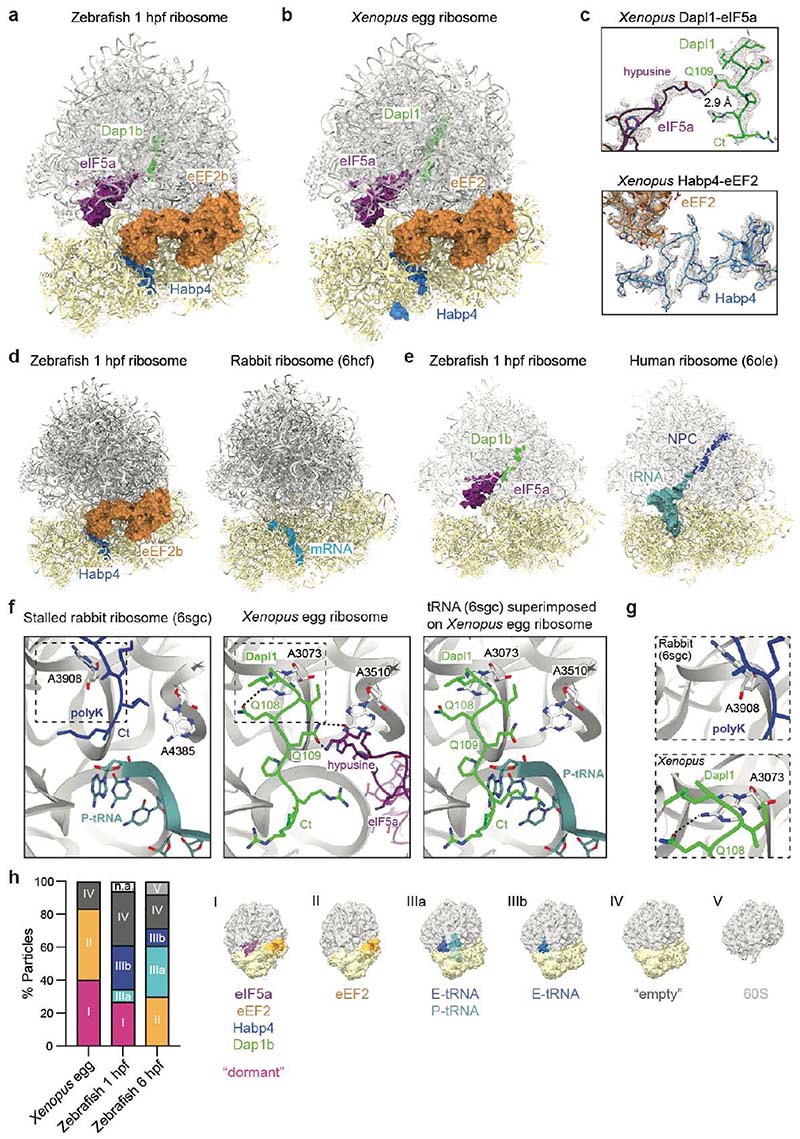
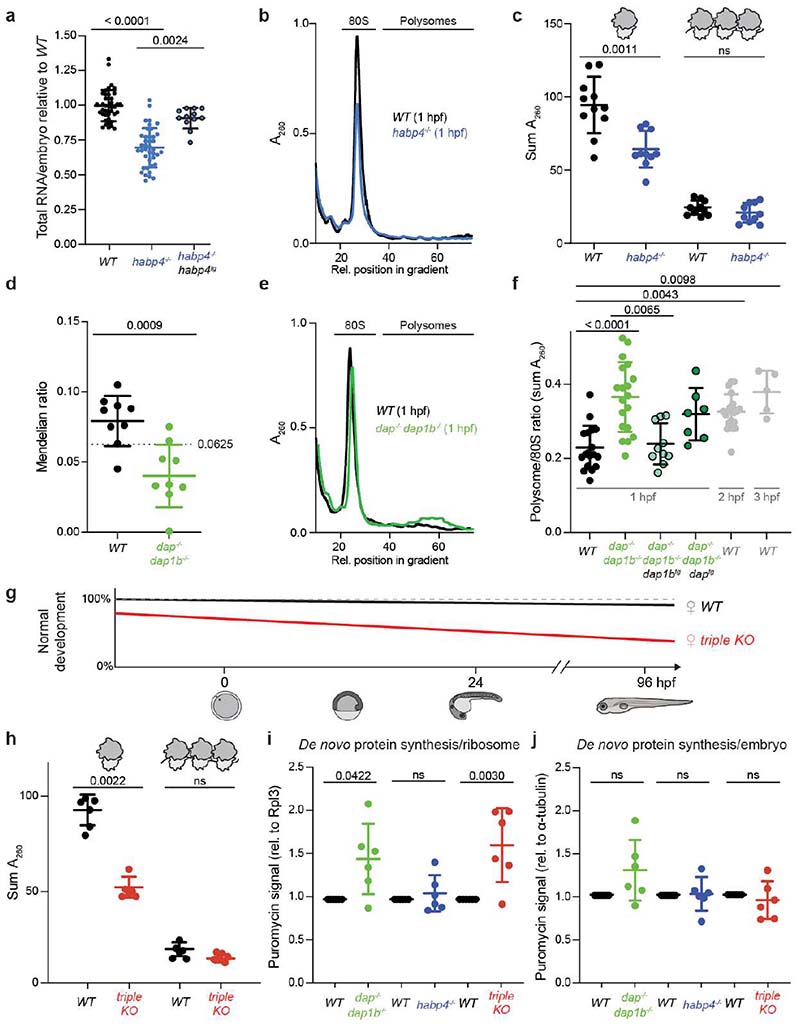
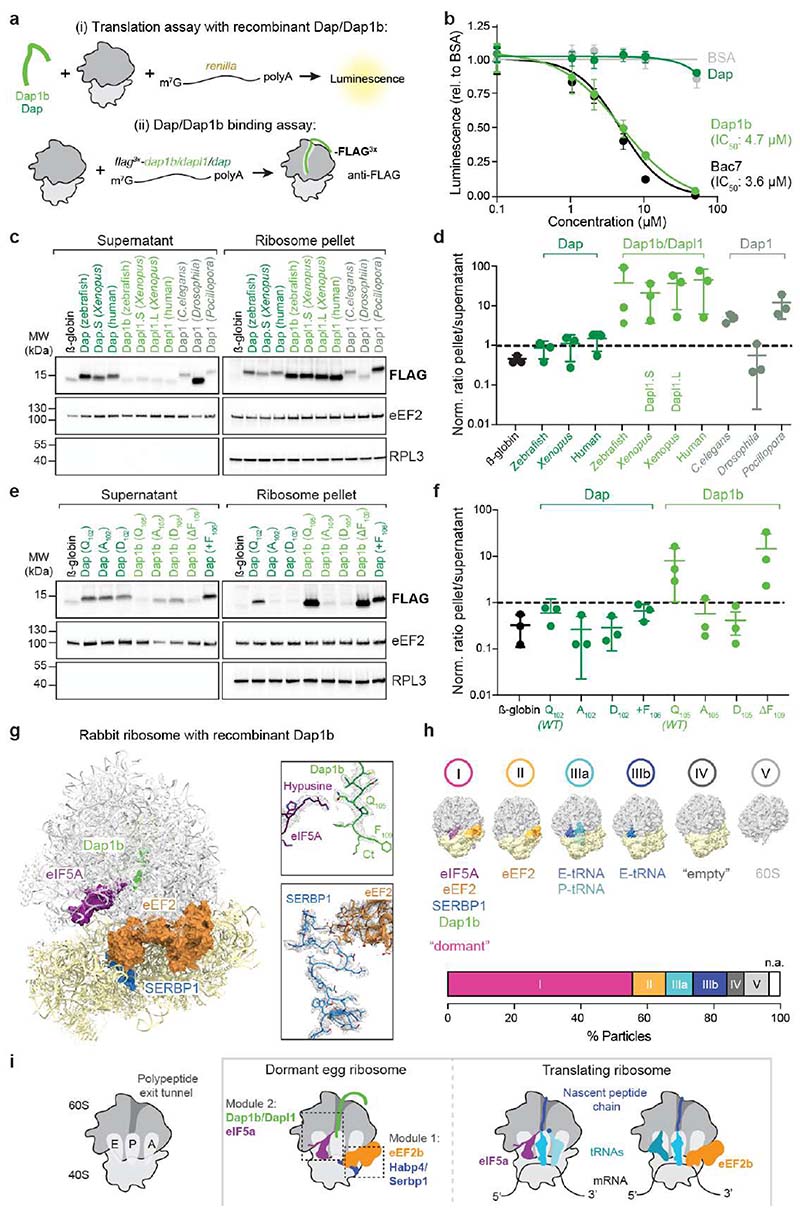
Ribosomes are produced in large quantities during oogenesis and are stored in the egg. However, the egg and early embryo are translationally repressed1-4. Here, using mass spectrometry and cryo-electron microscopy analyses of ribosomes isolated from zebrafish (Danio rerio) and Xenopus laevis eggs and embryos, we provide molecular evidence that ribosomes transition from a dormant state to an active state during the first hours of embryogenesis. Dormant ribosomes are associated with four conserved factors that form two modules, consisting of Habp4-eEF2 and death associated protein 1b (Dap1b) or Dap in complex with eIF5a. Both modules occupy functionally important sites and act together to stabilize ribosomes and repress translation. Dap1b (also known as Dapl1 in mammals) is a newly discovered translational inhibitor that stably inserts into the polypeptide exit tunnel. Addition of recombinant zebrafish Dap1b protein is sufficient to block translation and reconstitute the dormant egg ribosome state in a mammalian translation extract in vitro. Thus, a developmentally programmed, conserved ribosome state has a key role in ribosome storage and translational repression in the egg.


Conflict of interest statement

Competing interests. The authors declare no competing interests.

Figures

Extended Data Fig. 1
Extended Data Fig. 1. Mass-spectrometry and cryo-EM analysis of Xenopus egg ribosomes.
a, Fold change of ribosome-associated factors and core ribosomal proteins after comparing mass spectrometry data of purified ribosomes from unfertilized Xenopus eggs and 24 hpf larvae (stage 14) (n = 1 experiment). b, Processing pipeline of the Xenopus egg ribosome. All steps were done in Cryosparc v3.2.0. Maps are shown in grey, masks in blue. c-d, Maps showing the local resolution of Map1 and Map2 (c), and of the four factors associated with Xenopus egg ribosomes (d). Note that the resolution of the large subunit in Map2 (in c) is 0 (shown in blue) since this region was outside the mask used for obtaining this map (see b). e, Orientation distribution plot for all particles contributing to Map1. f, Gold-Standard Fourier Shell Correlation (GSFSC) of Map1.
Extended Data Fig. 2
Extended Data Fig. 2. Processing pipeline of the 1 hpf zebrafish ribosome.
All steps were done in Cryosparc v3.2.0. Maps are shown in grey, masks in blue. The orientation distribution plot for all particles contributing to Map1 and the Gold-Standard Fourier Shell Correlation (GSFSC) of the respective map is shown on the bottom. Local resolution maps were calculated for Map1, Map2, Map3, and for the four ribosome-associated factors. Note that in the box with local resolution maps, the resolution of the large subunit in Map2 and Map3, and of the small subunit’s head in Map3 is 0 (shown in blue) since these regions were outside the masks used for generating these maps.
Extended Data Fig. 3
Extended Data Fig. 3. Characterization of the dormant ribosome state in zebrafish 1 hpf and Xenopus egg ribosomes.
a-d, Densities of the two modules, namely Habp4-eEF2b/eEF2 (a-b), and Dap1b/Dapl1-eIF5a (c-d), that are characteristic for dormant ribosomes in zebrafish 1 hpf embryos and Xenopus eggs. e, Overview of the ribosome structure isolated from 6 hpf zebrafish embryos lacking the specific egg ribosome-associated factors. f, Latent space representations of ribosomal particles from Xenopus eggs (left), 1 hpf zebrafish embryos (middle) and 6 hpf zebrafish embryos (right) as UMAP embeddings after training a cryoDRGN latent variable model. Classes are depicted with circles in Roman numbers, map volumes are indicated with Arabic numbers. Total particle numbers are shown on the top left of each graph. g, Densities of ribosome-associated factors from Xenopus eggs. An overview of the map is shown on the top left. h, Densities of ribosome-associated factors in a map reconstructed from class I particles from Xenopus eggs obtained with cryoDRGN. An overview of the map is shown on the top-left.
Extended Data Fig. 4
Extended Data Fig. 4. Processing pipeline of the 6 hpf zebrafish ribosome.
All steps were done in Cryosparc v3.2.0. Maps are shown in grey, masks in blue. The orientation distribution plot for all particles contributing to Map1 and the Gold-Standard Fourier Shell Correlation (GSFSC) of the respective map is shown on the bottom-right. Local resolution maps were calculated for Map1, Map2 and Map3. Note that in the box with local resolution maps, the resolution of the large subunit in Map2 and Map3, and of the small subunit’s body in Map3 is 0 (shown in blue) since these regions were outside the masks used for generating these maps.
Extended Data Fig. 5
Extended Data Fig. 5. Sequence conservation of the Dap/Dap1b/Dapl1 protein family and RNA expression of ribosome-associated factors.
a, Protein sequence alignment of the Dap/Dap1b/Dapl1 protein family illustrates conserved motifs. Vertebrates have two paralogs, namely Dap1b/Dapl1 and Dap. Invertebrates only encode one homolog (Dap1) that clusters in between Dap1b/Dapl1 and Dap proteins. b, Zebrafish mRNA expression levels (PolyA+ RNA-seq,) of eif5a/eif5a2 (purple), eef2 (orange), dap1b/dap (green) and habp4 (blue) during oogenesis and embryogenesis. c, Xenopus mRNA expression levels of all paralogs of eif5a, eef2, dap, dapl1 and habp4 derived from riboMinus-seq data. d, mRNA expression levels of zebrafish eif5a/eif5a2, eef2, dap1b/dap and habp4 in adult tissues. TPM, transcripts per million.
Extended Data Fig. 6
Extended Data Fig. 6. Structural comparison of Dap1b and other factors that insert into the polypeptide exit tunnel (PET).
a, Structures of ribosomes with proteins and peptides inserted into the PET. From left to right: zebrafish Dap1b inserted into the rabbit ribosome, Bac7 (5HAU), Api137 (5O2R), Rei1 (6RZZ), Nog1 (3JCT9) and MDF2 (6RM3). Models were clipped to have a better view of the PET. Boxed areas (dashed boxes) are shown at higher magnification in b. b, Detail of the peptidyl-transferase center (PTC) of the ribosomes shown in a. The dashed line indicates the position of the PTC. All previously known factors use different mechanisms than Dap1b to achieve their functions: Bac7 interacts with the ribosomal A-loop via its N-terminus (see below) to block translation initiation, Api137 interacts with the release factors RF1 or RF2 to block termination of bacterial ribosomes, Rei1 and Nog1 insert into the PET of 60S subunits during ribosome biogenesis and their C-termini do not extend beyond the PTC, and MDF2’s C-terminus interferes with P-tRNA and eIF5A binding to establish dormancy in the microsporidian ribosome. c, Superimposition of Dap1b (left) and Bac7 (right) with eukaryotic (5GAK) and prokaryotic (1VY4) A- and P-tRNAs, respectively. Red asterisks denote clashes of Dap1b and Bac7 with the A-tRNA. d, Dap1b’s C-terminus does not interact with the A-loop (right), in contrast to Bac7 (left). Dashed lines mark distances between Arg1 of Bac7 and Phe109 of Dap1b with a conserved uracil of the A-loop. e, Scheme of the interactions of Dap1b’s C-terminus within the ribosome. Dap1b interacts with helix 74 (H74) and H90 of the 28S rRNA. f, Scheme of the interactions of Bac7’s N-terminus within the ribosome. Bac7 interacts with H89 and the A-loop (H92).
Extended Data Fig. 7
Extended Data Fig. 7. Crosslinking and mass spectrometry (MS) analysis of ribosomes from 1 hpf zebrafish embryos and Xenopus eggs.
a, Cα-Cα distance distribution of the DSSO-induced crosslinks identified in Xenopus egg and zebrafish 1 hpf ribosomes. b-c, Proteins crosslinked to zebrafish Habp4 (b) or Dap (c) are shown on the 1 hpf zebrafish ribosome as surface representations, with crosslinked residues depicted in darker color. d, Crosslinking mapping of Habp4 (shown as a scheme; modeled regions highlighted with a black line) to proteins of the zebrafish embryo (top) and Xenopus egg (bottom) ribosome. Crosslinked proteins are shown as surface representations, with crosslinked residues depicted in dark blue. A cartoon (right) shows a model of Habp4 on the ribosome. e, Crosslinking mapping of zebrafish Dap (top) and Xenopus Dapl1 (bottom; for details, see d).
Extended Data Fig. 8
Extended Data Fig. 8. Characterization of single (habp4-/-), double, and triple (dap-/-, dap1b-/-, habp4-/-) zebrafish mutants.
a-b, Early embryo development of habp4-/- (a) and dap-/ -, dap1b-/- mutants (b) compared to wildtype (WT). c, Mendelian ratio analysis of fin-clips from adult fish obtained from heterozygous habp4+/- parents (25% expected to be habp4-/-; n = 4 for both genotypes). d, Size of WT and habp4-/- embryos at 6 hours post-fertilization (hpf) (WT-1: n = 31; WT-2: n = 22; WT-3: n = 35; habp4-/--1: n = 36; habp4-/--2: n = 24; habp4-/--3: n = 33). e, Total RNA of 1-3 hpf embryos (WT: n = 42; dap-/-, dap1b-/-: n = 41; WT and triple KO: n = 20 for both genotypes). f, Number of eggs laid by single, double, and triple KO females compared to matching WT. g, Representative images (left) and quantification (right) of poor quality eggs. h, Percentage of embryos from single, double, and triple KO mutant pairs displaying normal embryo development until 6 hpf compared to matching WT pairs. i-j, Relative number of embryos and larvae (in relation to the embryos that developed normally up to 6 hpf; see h) that showed abnormalities at 1 (i) and 4 (j) days post-fertilization (dpf). Example images are shown on the left. Data in c and e-j are represented as scatter dot plots with means ± standard deviation (SD). Data in d are represented as a violin plot with median and quartiles. In f-h, dotted vertical lines indicate separate experiments. Significance was determined using Kruskal-Wallis and Dunn’s two-sided test (d, f-j; for more than 2 sample group comparisons) or Mann-Whitney test (c, and in e-h for pairwise comparisons between habp4-/- or dap-/-, dap1b-/- versus WT). For c and f, n are independent crosses; for d, n are individual embryos; for e, n are biologically independent samples. #, number of crosses.
Extended Data Fig. 9
Extended Data Fig. 9. Recombinant Dap1b binds to the polypeptide exit tunnel of rabbit ribosomes.
a-b, Western blot of the total in vitro translation reaction shown in Fig. 4c (a) and Fig. 4e (b). Uncropped images of membranes are provided in Supplementary Fig. 2a, b. c, Translation activity assays (Fig. 4a top) of renilla luciferase mRNA upon addition of increasing concentrations of C-terminal Dap and Dap1b peptides. BSA and N-terminal Bac7 are used as negative and positive controls, respectively (n = 4 biologically independent samples). Dots represent means and error bars are standard deviation (SD). d, Ribosome binding assays (Fig. 4a bottom) of in vitro translated FLAG-tagged Dap-Dap1b chimeras compared to full-length (WT) Dap and Dap1b. A representative Western blot from a single experiment is shown on the left; quantification of three independent experiments is shown on the right. Data are represented as scatter dot plots with means ± standard deviation (SD. Significance was assessed with Kruskal-Wallis followed by Dunn’s two-sided test. Uncropped images of membranes are provided in Supplementary Fig. 2d. e, Mass spectrometry data of ribosomes isolated from habp4-/- and WT (left), and from dap-/-, dap1b-/- and WT (right) embryos at 1 hpf, represented as volcano plots (n = 3 independent experiments). Permutation-based false discovery rates (FDRs) are displayed as dotted (FDR < 0.01) and dashed (FDR < 0.05) lines.
Extended Data Fig. 10
Extended Data Fig. 10. Processing pipeline of the rabbit ribosome with recombinant zebrafish Dap1b.
a, Processing pipeline for obtaining an 80S density map of the rabbit ribosome with zebrafish Dap1b. b, Orientation distribution plot (top) and Gold-Standard Fourier Shell Correlation (GSFSC; bottom) of Map1. c, Local resolution maps calculated for Map2 and Map3. Densities and local resolutions of eIF5A, Dap1b, eEF2 and SERBP1 are shown on the bottom. Note that the resolution of the small subunit in Map2 is 0 (shown in blue) since this region was outside the mask used for generating this map. d, Latent space representation of particles from rabbit ribosomes with zebrafish Dap1b as a UMAP embedding after training a cryoDRGN latent variable model. Classes are depicted with circles in Roman numbers, map volumes are indicated with Arabic numbers. Total particle number is shown on the top left of the graph.
Fig. 1
Fig. 1. Translation increase during zebrafish embryogenesis anti-correlates with the presence of ribosome-bound factors.
a, Schematic of the maternal-to-zygotic transition (MZT). Clearance of maternal mRNAs is coordinated with the activation of transcription during the first hours post-fertilization (hpf). In zebrafish, replacement of maternal by zygotic ribosomes takes several days. b, Representative zebrafish polysome profiles. A260, absorbance at 260 nm. c, Quantification of polysome-to-monosome ratios (0 hpf: n = 9; 1 hpf: n = 13; 2 hpf: n = 13, 3 hpf: n = 5; 6 hpf: n = 12; 24 hpf: n = 11). Significance was determined with Kruskal-Wallis and Dunn’s two-sided test. Data are mean ± standard deviation (SD). d, Violin plots showing the distribution of the median translation efficiency (TE) during embryogenesis. Significance was assessed by the two-sided Wilcoxon pairwise test and effect size was estimated by Cohen’s D (< 0.2: “negligible”; [0.2-0.5]: “small”; [0.5-0.8]: “medium”; > 0.8: “large”). e, Volcano plots based on mass spectrometry data showing fold enrichments of proteins in the ribosome fraction of 1 hpf embryos compared to eggs (left), 3 hpf (middle) and 6 hpf (right) embryos (n = 3 for each time-point). All significantly enriched or depleted proteins are listed in Supplementary Table 1. Permutation-based false discovery rates (FDRs) are displayed as dotted (FDR < 0.01) and dashed (FDR < 0.05) lines. f, Abundance changes of a subset of factors relative to ribosomal proteins in the ribosome-associated proteome (left) and cell lysate (right) (n = 3). Abundances are reported as iBAQ values. 74 ribosomal proteins are plotted in grey. Error bars correspond to geometric SD. For c, e and f, n are biologically independent samples.
Fig. 2
Fig. 2. A conserved set of factors blocks functionally important sites of the egg ribosome.
a-b, Overview of the dormant ribosome structure from 1 hpf zebrafish (a) and Xenopus egg (b). Ribosome-associated factors are shown as surface representations; eEF2b and eIF5a correspond to PDB-6MTE and PDB-5DAT. c, Density maps (in mesh) of the two modules of the Xenopus dormant ribosome. d, Habp4 and eEF2b (6MTE) are shown as surface representations in the zebrafish dormant ribosome (left). A rabbit ribosome stalled on an mRNA (6HCF) is shown for comparison (right). e, Clipping of the zebrafish dormant ribosome shows eIF5a (5DAT) and Dap1b bound within the polypeptide exit tunnel (left). The structure of a stalled human ribosome (6OLE) containing a nascent polypeptide chain (NPC) and a P/E-tRNA is shown for comparison (right). f, Comparison of the peptidyl-transferase center of a rabbit 80S ribosome stalled with a poly-Lysine NPC and a P/E-tRNA (6SGC, left) and of the Xenopus dormant ribosome (middle). For comparison, the P/E-tRNA (6SGC), absent in dormant ribosomes, was superimposed onto the Xenopus egg ribosome (right; eIF5A is hidden). Critical amino acids and 28S rRNA nucleotides are labeled; interactions are depicted with dashed lines. Boxed areas are shown at higher magnification in g. g, A3073 of Xenopus 28S rRNA (bottom; equivalent to A3908 of rabbit 28S, top) displays a different conformation when interacting with Gln108 of Dapl1. h, Distribution of ribosomal particles among the classes obtained with cryoDRGN. Representative filtered maps of the major classes are shown (Extended Data Fig. 3g, h; Supplementary Table 3; n.a refers to “non-assigned” particles). Ct, C-terminus.
Fig. 3
Fig. 3. Habp4 stabilizes monosomes, while Dap1b/Dap represses translation in embryos.
a, RNA isolated from wild-type (WT), habp4-/- and transgenic habp4-/- embryos expressing Habp4 (habp4-/-, habp4tg) (WT: n = 40; habp4-/-: n = 40; habp4-/-, habp4tg: n = 12). b, Representative polysome profiles from WT and habp4-/- embryos at 1 hour post-fertilization (hpf). A260, absorbance at 260 nm. c, Quantification of monosomes and polysomes from 1 hpf embryos (WT: n = 11; habp4-/-: n = 10). d, Mendelian ratio analysis of fin-clipped adult fish. Adult dap-/-, dap1b-/- and WT fish are expected at 6.25% from a dap+/-, dap1b+/- incross (n = 9 independent crosses; heterozygous combinations are not shown; total number of fish genotyped: 1029). e, Representative polysome profiles from 1 hpf WT and dap-/-, dap1b-/- embryos. f, Quantification of polysome-to-monosome ratios of 1 hpf embryos derived from WT, dap-/-, dap1b-/-, and transgenic dap-/-, dap1b-/- expressing Dap or Dap1b (WT, 1 hpf: n = 18; dap-/-, dap1b-/-: n = 19; dap-/-, dap1b-/-, daptg: n = 7; dap-/-, dap1b-/-, dap1btg: n = 10; WT, 2 hpf: n = 21; WT, 3 hpf: n = 5). g, Scheme of the percentage of WT and dap-/-, dap1b-/-, habp4-/- (triple KO) embryos that developed into larvae (Extended Data Fig. 8g-j). h, Quantification of monosomes and polysomes from 1 hpf embryos (n = 6 per genotype; representative profile in Supplementary Fig. 1j). i-j, Quantification of protein synthesis rates normalized to Rpl3 (i) or alpha-Tubulin (j) (n = 6 per genotype; Supplementary Fig. 1l; for uncropped images of membranes see Supplementary Fig. 2c). For a, c, f and h-j, n are biologically independent samples. In a, c, d, f and h-j, data are scatter dot plots with mean ± standard deviation (SD); ns, not significant. Statistical analysis was performed with Kruskal-Wallis followed by Dunn’s two-sided tests (a, f), two-sided Mann-Whitney (c, d, h), and one-way ANOVA followed by one-sided Tukey’s multiple comparisons test (i, j).
Fig. 4
Fig. 4. Dap1b/Dapl1 binding to mammalian ribosomes blocks translation and reconstitutes the egg-like dormant ribosome state.
a, Scheme of the assays performed in rabbit reticulocyte lysate (RRL). (Top) Recombinant zebrafish Dap or Dap1b and in vitro synthesized renilla mRNA were added to RRL. Translation was assessed by measuring Luciferase activity. (Bottom) In vitro synthesized mRNAs encoding FLAG-tagged proteins were translated in RRL. Ribosomes were pelleted and proteins were quantified by Western blot. b, IC50 analyses of Dap1b and Dap (a, top). Bac7 and BSA were used as controls (n = 4; plot shows mean ± standard deviation (SD)). c, Ribosome binding assays of in vitro translated proteins (a, bottom). β-globin was used as control. eEF2 and RPL3 were used as a readout of fractionation and for normalization. Total reaction is shown in Extended Data Fig. 9a. d, Quantification of the blots shown in c. Values are normalized to loading (eEF2 or RPL3) and levels of the FLAG-tagged factors (n = 3). e, Ribosome binding assays with β-globin (control), wild-type and mutant versions of zebrafish Dap and Dap1b. Total reaction is shown in Extended Data Fig. 9b. f, Quantification of the blots shown in e (n = 3). g, Structure of the rabbit ribosome with zebrafish Dap1b. Ribosome-associated factors are shown as surface representations. Densities (in mesh) are shown on the right. Critical amino acids are indicated. Ct, C-terminus. h, Distribution of ribosomal particles from RRL among the classes obtained with cryoDRGN. Representative filtered maps of the major classes (top) with superimposed colored densities for eEF2, eIF5A and tRNAs (Supplementary Table 3; n.a refers to “non-assigned” particles). i, Scheme depicting the main features of the dormant ribosomes identified in this study. (Left) Cartoon of important functional sites of the ribosome. (Middle) Dormant ribosomes are associated with four factors. (Right) Translating ribosomes. For b, d and f, n are independent experiments. In d and f, data are scatter plots with mean ± SD, and statistical analysis was performed with Kruskal-Wallis followed by Dunn’s two-sided test. Uncropped images of membranes shown in c and e are provided in Supplementary Fig. 2a, b.

References

    1. Woodland HR. Changes in the polysome content of developing Xenopus laevis embryos. Developmental Biology. 1974;40:90–101. - PubMed
    1. Brandis JW, Raff RA. Translation of oogenetic mRNA in sea urchin eggs and early embryos. Demonstration of a change in translational efficiency following fertilization. Dev Biol. 1978;67:99–113. - PubMed
    1. Kronja I, et al. Widespread Changes in the Posttranscriptional Landscape at the Drosophila Oocyte-to-Embryo Transition. Cell Reports. 2014;7:1495–1508. - PMC - PubMed
    1. Bachvarova R, De Leon V. Stored and polysomal ribosomes of mouse ova. Developmental Biology. 1977;58:248–254. - PubMed
    1. Burkholder GD, Comings DE, Okada TA. A storage form of ribosomes in mouse oocytes. Experimental Cell Research. 1971;69:361–371. - PubMed

Publication types

LinkOut - more resources