. 2023 Jan;29(1):209-218.
doi: 10.1038/s41591-022-02122-5. Epub 2023 Jan 18.

Genetic predictors of lifelong medication-use patterns in cardiometabolic diseases

Affiliations

Genetic predictors of lifelong medication-use patterns in cardiometabolic diseases

Tuomo Kiiskinen et al. Nat Med. 2023 Jan.

Abstract

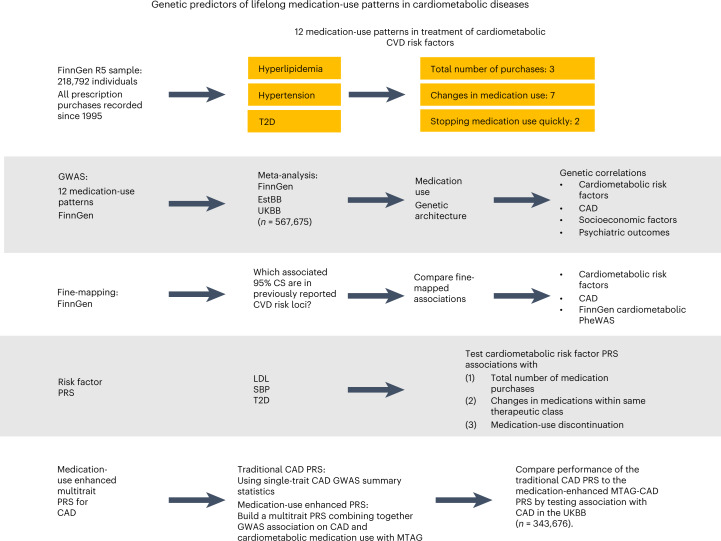
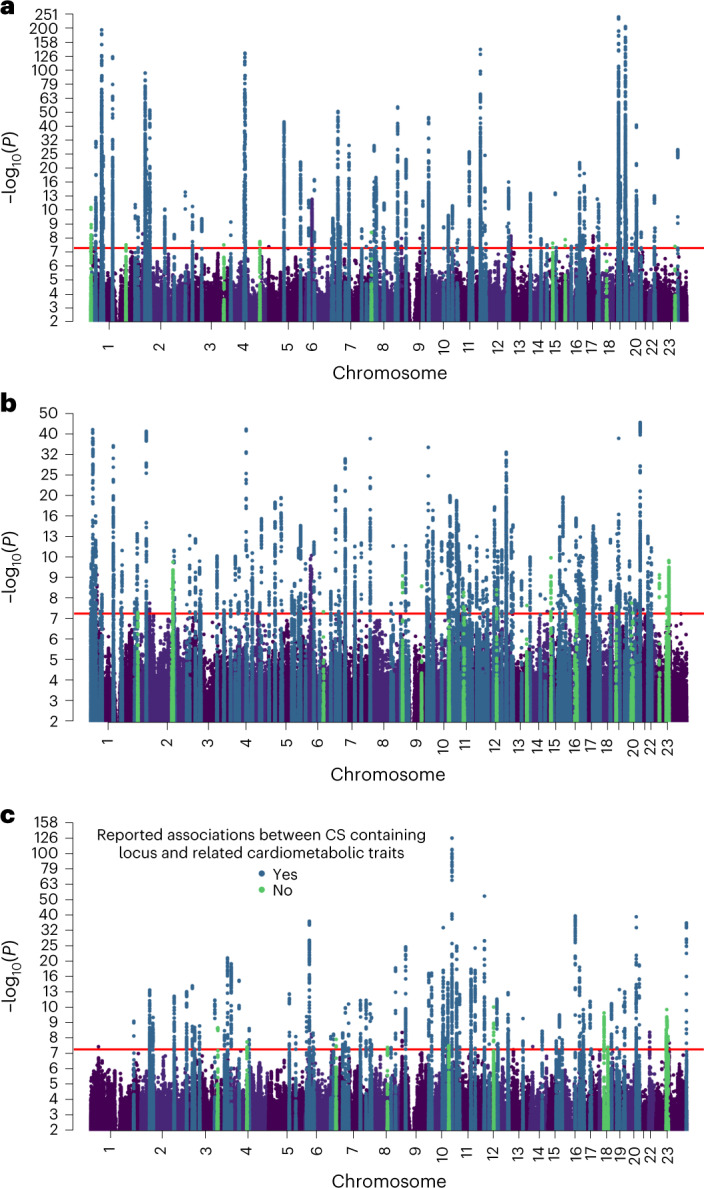
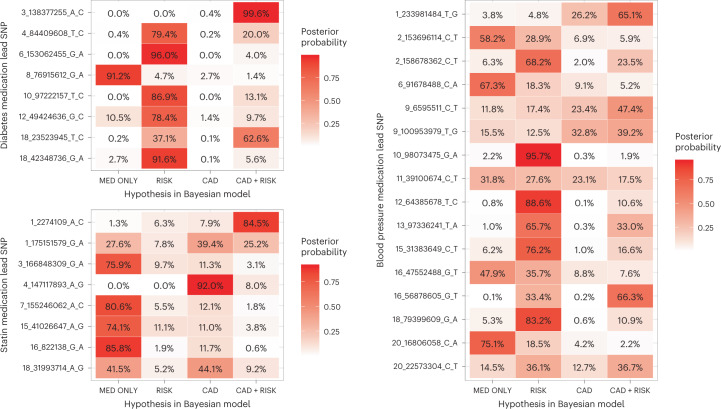
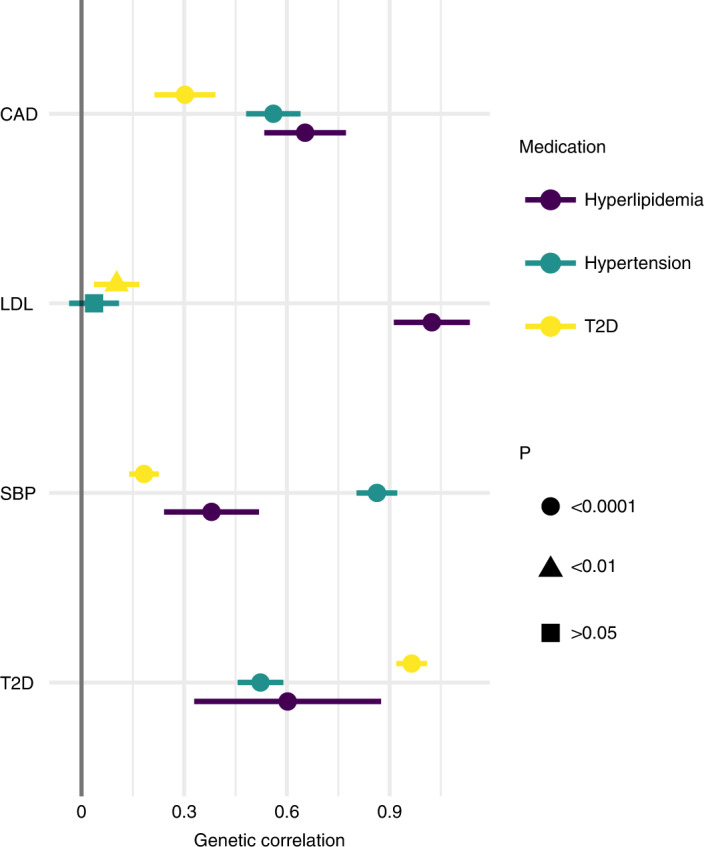
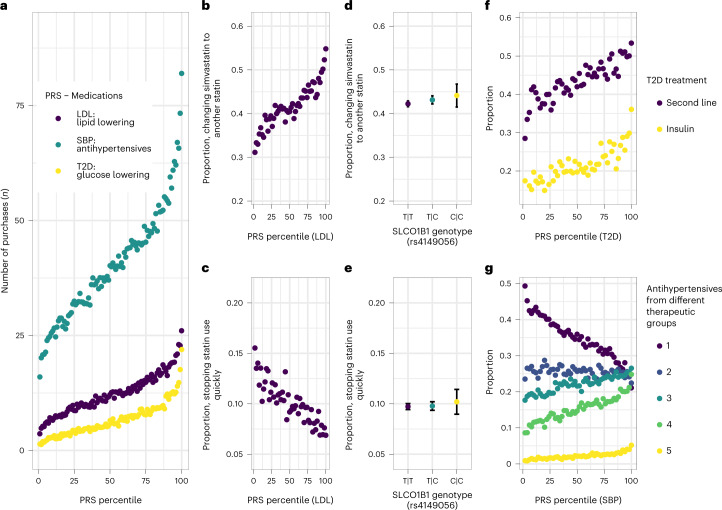
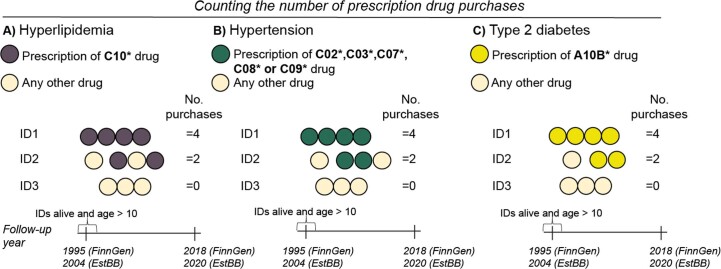
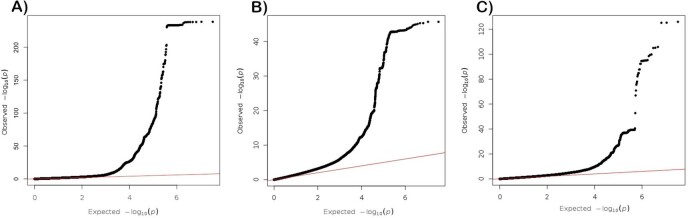
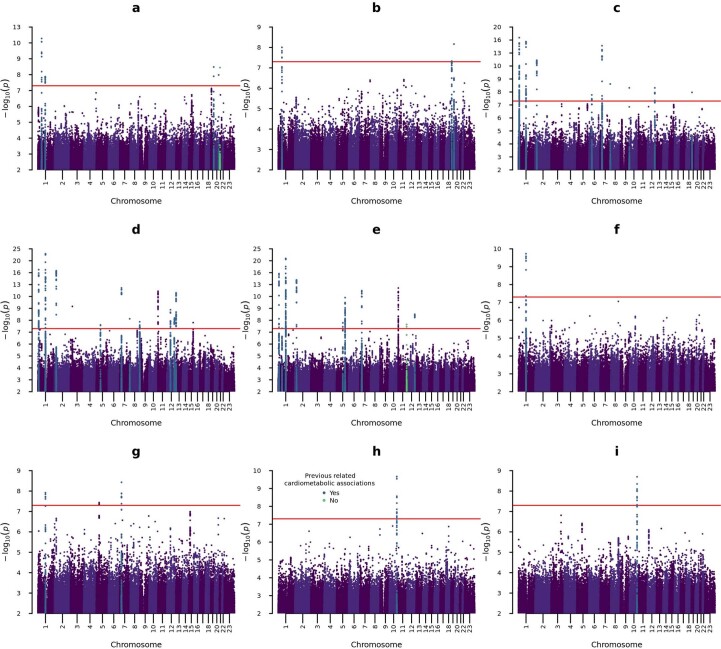
Little is known about the genetic determinants of medication use in preventing cardiometabolic diseases. Using the Finnish nationwide drug purchase registry with follow-up since 1995, we performed genome-wide association analyses of longitudinal patterns of medication use in hyperlipidemia, hypertension and type 2 diabetes in up to 193,933 individuals (55% women) in the FinnGen study. In meta-analyses of up to 567,671 individuals combining FinnGen with the Estonian Biobank and the UK Biobank, we discovered 333 independent loci (P < 5 × 10⁻⁹) associated with medication use. Fine-mapping revealed 494 95% credible sets associated with the total number of medication purchases, changes in medication combinations or treatment discontinuation, including 46 credible sets in 40 loci not associated with the underlying treatment targets. The polygenic risk scores (PRS) for cardiometabolic risk factors were strongly associated with the medication-use behavior. A medication-use enhanced multitrait PRS for coronary artery disease matched the performance of a risk factor-based multitrait coronary artery disease PRS in an independent sample (UK Biobank, n = 343,676). In summary, we demonstrate medication-based strategies for identifying cardiometabolic risk loci and provide genome-wide tools for preventing cardiovascular diseases.


Conflict of interest statement

The authors declare no competing interests.

Figures

Fig. 1
Fig. 1. Workflow of the study.
GWAS were performed for 12 phenotypes of medication-use patterns in treating hyperlipidemia, hypertension and T2D (three continuous analyses of the total number of medication purchases and nine binary analyses of medication changing and fast discontinuation) in FinnGen, with data capturing all medication purchases since 1 January 1995. Meta-analyses of up to 567,671 participants combined data in FinnGen (n = 29,990–193,933), EstBB (n = 5,110–184,892) and UKBB (n = 188,846). Fine-mapping was performed in FinnGen for all associated (P < 5 × 10−8) regions. Genetic architectures between medication-use traits and the underlying cardiometabolic risk were juxtaposed by comparing genome-wide significant associations, calculating LDSC regression genetic correlations and testing associations between PRS for LDL, SBP and T2D and the medication-use phenotypes. A medication-use enhanced multitrait PRS for CAD was built using MTAG method and its performance was compared to a traditional CAD PRS by testing associations with CAD in an independent sample (UKBB, n = 343,676).
Fig. 2
Fig. 2. GWAS association analysis results for the total number of medication purchases in FinnGen.
ac, Manhattan plots with two-sided P values of quantitative SAIGE mixed-model GWAS (n = 193,933) for the number of recorded purchases of drugs used in the treatment of hyperlipidemia (a), hypertension (b) and T2D (c). All loci containing one or more 95% CS are highlighted according to their previously reported related cardiometabolic associations; loci that have been previously associated with lipid-related traits (a), blood pressure-related traits (b) or blood glucose-related traits (c). The horizontal line signifies genome-wide significance (P < 5 × 10−8) without additional multiple testing correction.
Fig. 3
Fig. 3. Shared effect between medically treated cardiometabolic risk factor, CAD and lead SNPs from GWAS of the total number of purchases of medications for hyperlipidemia, hypertension and T2D.
Bayesian posterior probabilities of hypothetical models are displayed on the x axis for the number of purchases of T2D (upper left), hyperlipidemia (lower left) and hypertension (right) medications lead SNPs (y axis). MED ONLY, SNP affects medication use only model; RISK, correlated effect model across medication use and risk factor but not CAD; CAD, correlated effect model across medication use and CAD but not the risk factor; CAD + RISK, correlated effect model across medication use, risk factor and CAD. The variant association statistics used to compute the posterior probabilities for LDL, SBP and T2D and came from previous studies,, with sample sizes of 340,951, 757,601 and 898,130, respectively. For CAD, a meta-analysis including FinnGen, UKBB and CARDIoGRAMplusC4D (n = 811,555) was used.
Fig. 4
Fig. 4. Genetic correlations between total numbers of drugs purchased for cardiometabolic indications and the underlying cardiometabolic risk factors and CAD.
Genetic correlations between the total number of hyperlipidemia, hypertension and T2D medication purchases (n = 193,933) and CAD (CARDIoGRAMplusC4D, n = 194,427), LDL (n = 340,951), SBP (n = 757,601) and T2D (n = 898,130) estimated with LDSC. The association statistics for LDL, SBP, T2D and CAD used to compute genetic correlations came from previous studies. Point estimates of genetic correlation and their 95% CI, indicated using error bars, are presented. The genetic correlation between LDL and the total number of hypertension medications was not significant, whereas all other genetic correlations were significant (two-sided P < 0.05 at 5% FDR).
Fig. 5
Fig. 5. Associations between cardiovascular risk-factor PRS and medication-use patterns.
Associations between PRS for LDL, SBP and T2D and medication-use patterns of hyperlipidemia, hypertension and T2D are presented, respectively. a, Associations between PRS percentiles and the number of medication purchases (LDL PRS and hyperlipidemia medications, SBP PRS and hypertension medications, T2D PRS and T2D medications, n = 193,933). be, LDL PRS and prevalence of changing simvastatin to another statin (n = 45,134) (b) and discontinuation of statin use (n = 76,499) (c), in comparison with differences in statin-associated myopathy-related SLCO1B1 genotypes (n = 45,134, P = 0.11 (d); n = 76,499, P = 0.22 (e)). f, Associations between T2D PRS and use of second-line T2D treatments (n = 31,665) and insulin (n = 29,990). g, Association between SBP PRS and use of hypertension medications from different numbers of distinct medication groups (n = 125,586). PRS are split into bins of 1% (a) and 2% (b,c,f,g). The LDL, SBP and T2D PRS were computed from the GWAS association statistics from previous studies,, with sample sizes of 340,951, 757,601 and 898,130, respectively. The error bars signify 95% CI.
Extended Data Fig. 1
Extended Data Fig. 1. Drug use quantitative phenotypes.
Drugs used in the treatment of a) Hyperlipidemia b) Hypertension and c) Type 2 diabetes. Dots indicate the prescriptions and text in bold indicates the drug ATC code for the specific phenotype. We added all the single purchases in underlying drug groups, the non-users were included with 0 purchases of the specific drug. Participants dead before or less than 10 years old at the start of follow-up (Jan 1st, 1995 for FinnGen and Jan 1st, 2004 for EstBB) were excluded from the analysis.
Extended Data Fig. 2
Extended Data Fig. 2. Drug use binary phenotypes.
Drugs used in the treatment of a, e) Hyperlipidemia b, e) Hypertension and c-e) Type 2 diabetes.Dots indicate the prescriptions and text in bold indicates the drug ATC code for the specific phenotype. a) Cases for simvastatin switching were defined as individuals who started statin treatment with simvastatin but were later prescribed another statin and control participants who purchased only simvastatin. At least 3 purchases of statins were required for both the cases and controls. b) Cases for the analysis of four thresholds of drugs purchased from different hypertension medicine subgroups were defined as participants with purchases of drugs from >1, >2, >3, and >4 different hypertension drug subgroups. Controls were individuals with records of subgroup purchases that are less than in the case-defining groups. c) For the analysis of T2D second-line treatments, cases were defined as individuals with prescriptions of A10BD*, A10BH*, A10BJ*, or A10JK* and controls with prescriptions of any of the remaining A10B* drugs. Individuals with prescriptions for both did not qualify for the analysis. d) In the analysis of insulin users, cases are first prescribed A10B* (non-insulin diabetes drugs) and later A10A* (insulin) and controls only with A10B* prescriptions. Participants with first insulin prescriptions and later A10B* did not qualify. e) For the analysis of rapid stop of drug use done separately for the drug use phenotypes, cases were participants with only 1 or 2 prescriptions of the specific drug group and controls with 3 or more prescriptions. Individuals with the last purchase less than 1 year before the end of follow-up did not qualify for the analysis.
Extended Data Fig. 3
Extended Data Fig. 3. Correlation metrics between the medication use pattern phenotypes.
HL = Hyperlipidemia, HT = Hypertension, T2D = Type 2 Diabetes. a) Sample overlap displayed by the Jaccard Index (the intersection of samples divided by the union of samples) for each phenotype. b) Correlation between each phenotype combination calculated in the overlapping sample intersection (Pearson’s correlation coefficient for continuous-continuous phenotype pairs, Point-biserial correlation coefficient for continuous-binary pairs, and Phi-coefficient for binary-binary pairs.
Extended Data Fig. 4
Extended Data Fig. 4. QQ-plots, number of purchases (FinnGen).
Two-sided -log10-transformed P values of quantitative SAIGE mixed-model GWAS analyses for the total number of prescriptions of a) Drugs used in the treatment of hyperlipidemia b) Drugs used in the treatment of hypertension c) Drugs used in the treatment of type 2 diabetes (excluding insulins) in 193,933 FinnGen R5 participants.
Extended Data Fig. 5
Extended Data Fig. 5. Manhattan plots, binary analyses (FinnGen).
Manhattan plots, binary analyses (FinnGen). Two-sided -log10-transformed P values of binary SAIGE mixed-model GWASs for a) Changing simvastatin to another statin b) Discontinuation of statin use c) Hypertension medications from more than 1 different therapeutic group d) Hypertension medications from more than 2 different therapeutic groups e) Hypertension medications from more than 3 different therapeutic groups f) Hypertension medications from all 5 therapeutic groups g) Discontinuation of hypertension medication use h) Using 2nd line type 2 diabetes medications i) Using insulin in type 2 diabetes. All loci containing ≥1 95% credible set(s) are highlighted related to their previously reported related cardiometabolic associations; loci that have been previously associated with lipid-related traits (a-b), blood pressure-related traits (c-g), or blood glucose-related traits (h-i) in blue and potentially novel associations in green. The red horizontal line signifies genome-wide significance (p < 5 × 10-8) without multiple testing corrections.
Extended Data Fig. 6
Extended Data Fig. 6. QQ-plots, binary analyses (FinnGen).
Two-sided -log10-transformed P values of binary SAIGE mixed-model GWASs for a) Changing simvastatin to another statin b) Discontinuation of statin use c) Discontinuation of hypertension medication use d) Hypertension medications from more than 1 different therapeutic group e) Hypertension medications from more than 2 different therapeutic groups f) Hypertension medications from more than 3 different therapeutic groups g) Hypertension medications from all 4 therapeutic groups h) Using 2nd line type 2 diabetes medications i) Using insulin in type 2 diabetes. The error bands indicate 95% confidence intervals for the quantiles of a normal distribution.
Extended Data Fig. 7
Extended Data Fig. 7. Effect sizes in sex-stratified genome-wide association analyses.
Effect sizes (regression coefficient betas) with 95% confidence intervals (error bars) of the lead variants in genome-wide significant loci (in the analyses of all participants) for females (n = 107,231) and males (n = 86,702) in sex-stratified genome-wide analyses for the total number of prescriptions of drugs used in the treatment of hyperlipidemia, and type 2 diabetes (excluding insulins) in 193,933 FinnGen R5 participants.
Extended Data Fig. 8
Extended Data Fig. 8. LDSC genetic correlations.
Linkage disequilibrium score regression (LDSC) genetic correlation estimates: the total number of medication purchases (hyperlipidemia, hypertension, and type 2 diabetes) and selected cardiometabolic and socioeconomic, psychological, and psychiatric traits.
Extended Data Fig. 9
Extended Data Fig. 9. Betas in EstBB without and with educational attainment.
Effects of the independent 289 medication use lead association (in FinnGen) found in EstBB without (x-axis) and with (y-axis) the inclusion of educational attainment as a covariate in the GWAS models. Including educational attainment had no effect on either effect directions or sizes.

Comment in

References

    1. James SL, et al. Global, regional, and national incidence, prevalence, and years lived with disability for 354 diseases and injuries for 195 countries and territories, 1990–2017: a systematic analysis for the Global Burden of Disease Study 2017. Lancet. 2018;392:1789–1858. doi: 10.1016/S0140-6736(18)32279-7. - DOI - PMC - PubMed
    1. Marenberg ME, Risch N, Berkman LF, Floderus B, de Faire U. Genetic susceptibility to death from coronary heart disease in a study of twins. N. Engl. J. Med. 1994;330:1041–1046. doi: 10.1056/NEJM199404143301503. - DOI - PubMed
    1. Yusuf S, et al. Effect of potentially modifiable risk factors associated with myocardial infarction in 52 countries (the INTERHEART study): case-control study. Lancet. 2004;364:937–952. doi: 10.1016/S0140-6736(04)17018-9. - DOI - PubMed
    1. Virani SS, et al. Heart disease and stroke statistics—2020 update: a report from the American Heart Association. Circulation. 2020;141:e139–e596. doi: 10.1161/CIR.0000000000000757. - DOI - PubMed
    1. Arnett DK, et al. 2019 ACC/AHA guideline on the primary prevention of cardiovascular disease: a report of the American College of Cardiology/American Heart Association Task Force on Clinical Practice Guidelines. J. Am. Coll. Cardiol. 2019;74:e177–e232. doi: 10.1016/j.jacc.2019.03.010. - DOI - PMC - PubMed

Publication types

MeSH terms