. 2023 Mar;30(3):507-520.
doi: 10.1038/s41417-022-00572-0. Epub 2023 Jan 19.

Genetic trajectory and clonal evolution of multiple primary lung cancer with lymph node metastasis

Affiliations

Genetic trajectory and clonal evolution of multiple primary lung cancer with lymph node metastasis

He Tian et al. Cancer Gene Ther. 2023 Mar.

Abstract

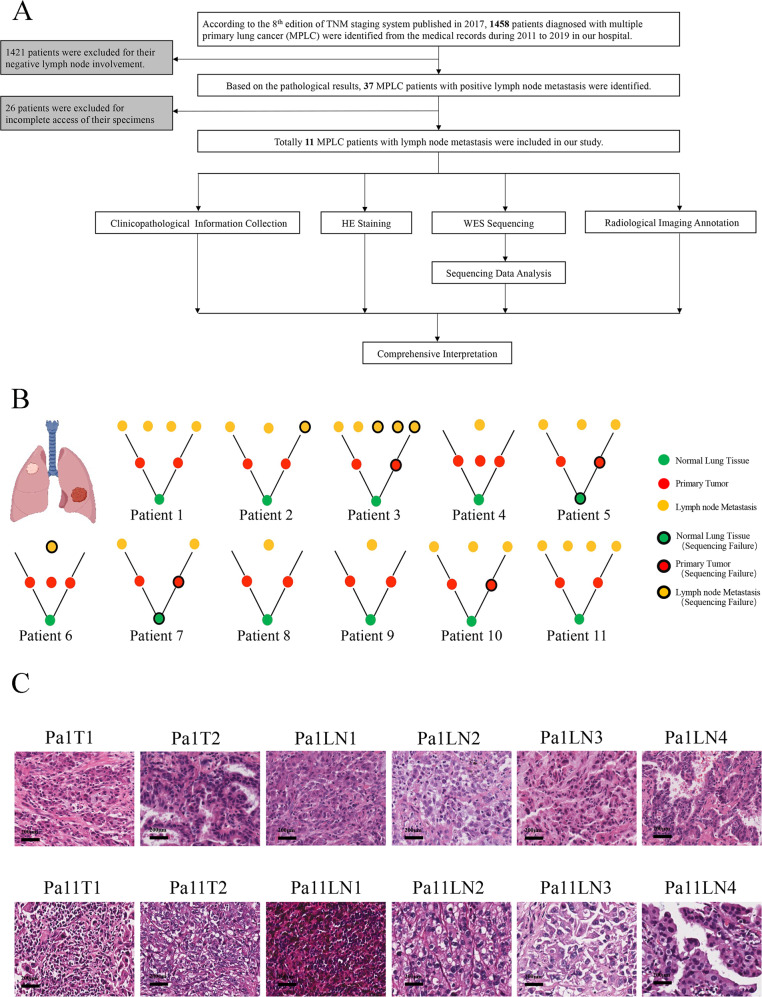
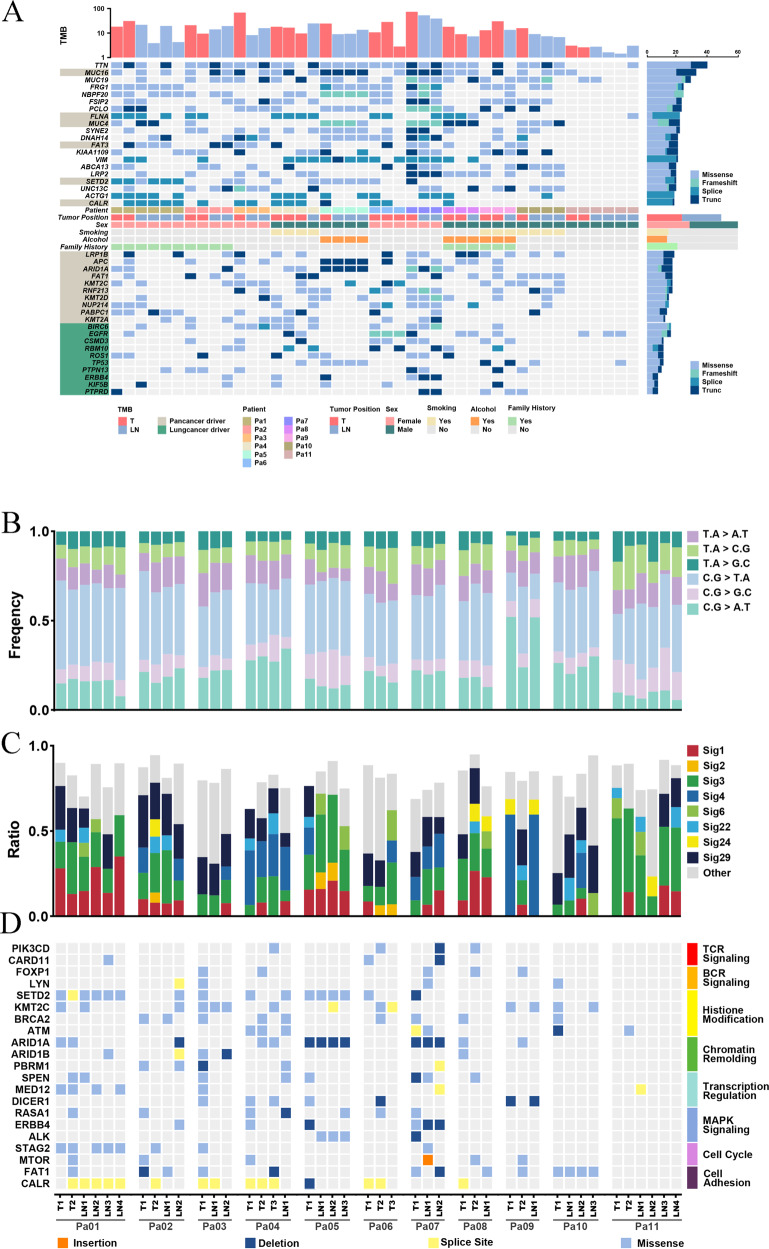
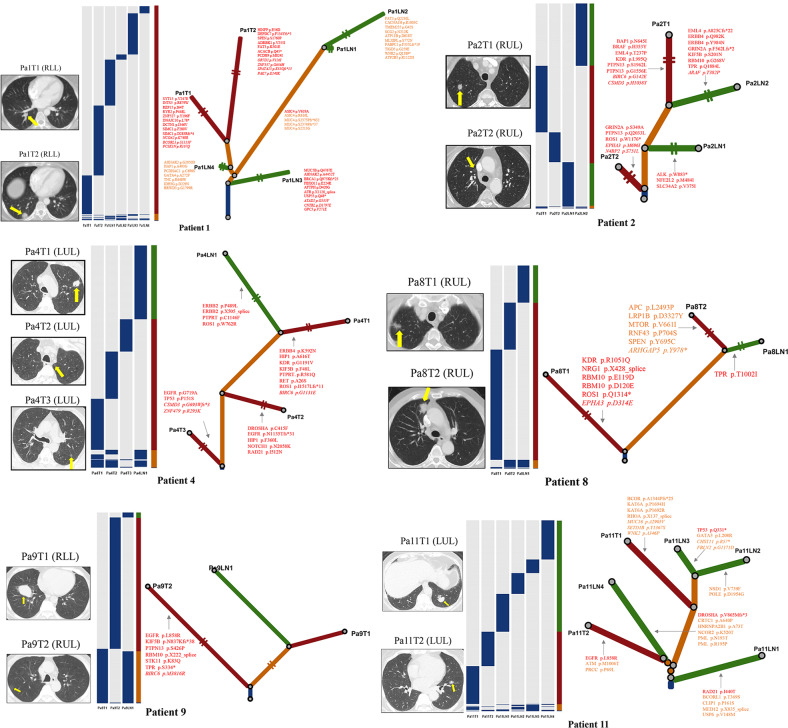
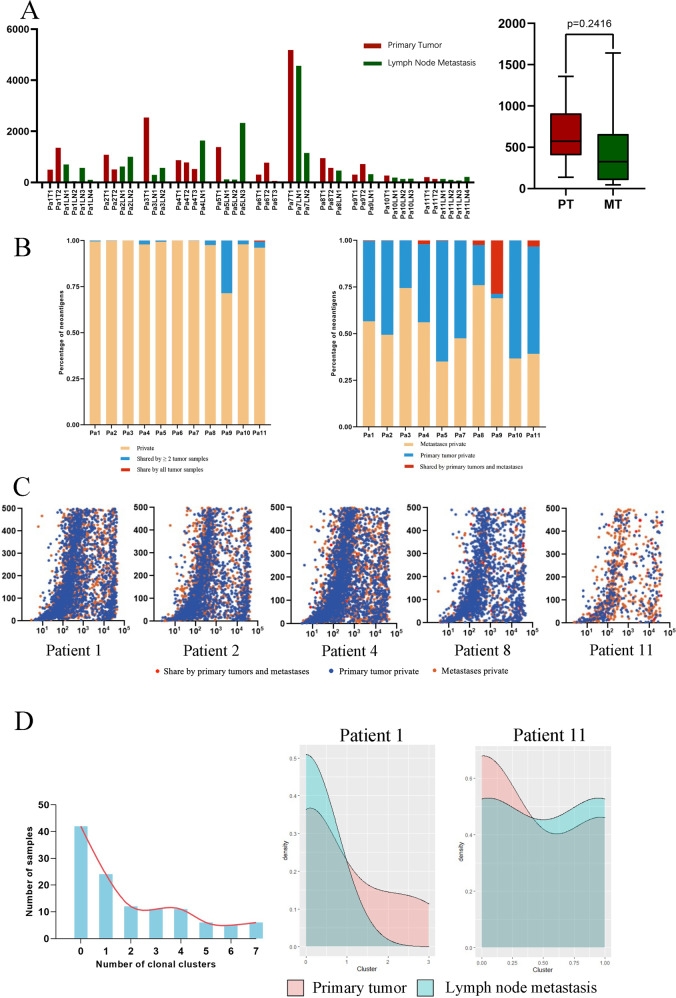
Multiple primary lung cancer (MPLC) with lymph node metastasis (LNM) is a rare phenomenon of multifocal lung cancer. The genomic landscapes of MPLC and the clonal evolution pattern between primary lung lesions and lymph node metastasis haven't been fully illustrated. We performed whole-exome sequencing (WES) on 52 FFPE (Formalin-fixed Paraffin-Embedded) samples from 11 patients diagnosed with MPLC with LNM. Genomic profiling and phylogenetic analysis were conducted to infer the evolutional trajectory within each patient. The top 5 most frequently mutated genes in our study were TTN (76.74%), MUC16 (62.79%), MUC19 (55.81%), FRG1 (46.51%), and NBPF20 (46.51%). For most patients in our study, a substantial of genetic alterations were mutually exclusive among the multiple pulmonary tumors of the same patient, suggesting their heterogenous origins. Individually, the genetic profile of lymph node metastatic lesions overlapped with that of multiple lung cancers in different degrees but are more genetically related to specific pulmonary lesions. SETD2 was a potential metastasis biomarker of MPLC. The mean putative neo-antigen number of the primary tumor (646.5) is higher than that of lymph node metastases (300, p = 0.2416). Primary lung tumors and lymph node metastases are highly heterogenous in immune repertoires. Our findings portrayed the comprehensive genomic landscape of MPLC with LNM. We characterized the genomic heterogeneity among different tumors. We offered novel clues to the clonal evolution between MPLC and their lymphatic metastases, thus advancing the treatment strategies and preventions of MPLC with LNM.


Conflict of interest statement

The authors declare no competing interests.

Figures

Fig. 1
Fig. 1. Study design and patient description.
A The flow chart showed the design and workflow of our research. B The cartoons showed the concept of multiple primary lung cancer, the different colors of the two tumors indicated they are genetically independent. Pattern diagrams constituted by dots of different colors showed the tumor architecture within each patient. The green, red, and orange dots represented standard samples, primary lung tumors, and lymph node metastases sites. The black circle indicated that the sample existed but failed to produce valid data in WES. C Representative HE staining image of patient 1 and patient 11 (Magnification: 100X. Scale bars: 200 μm).
Fig. 2
Fig. 2. Mutational landscape of MPLC with lymph node metastasis.
A Significantly mutated genes (SMGs). Upper: Top 20 genes with the highest mutation frequency. Middle: Demographic and clinical information of the 11 patients. Bottom: Highly mutated pan-cancer driver genes (light brown) and lung cancer driver genes (green), ranked according to their frequency. Driver gene identification is based on the COSMIC Cancer Gene Census (Sep. 2021, https://cancer.sanger.ac.uk/census). B Six-type mutation spectra of all samples. C Signature contributions of all samples based on the COSMIC database. D Putative driver genes (based on MSK-IMPACT 468 gene panel) with somatic mutations in all 11 patients were classified according to the functional categories.
Fig. 3
Fig. 3. Genomic heterogeneity among different samples.
A Upset map and Venn diagrams of representative patients showing the distribution of nonsynonymous somatic mutations among different tumors within individuals (Patient 1 and 11: Upset Venn diagrams. Patient 2, 4, 8, and 9: Venn diagrams). The putative pathogenic mutations were marked with different colors and typefaces according to the oncogene list in COSMIC Cancer Gene Census (https://cancer.sanger.ac.uk/census). Orange, Pan-cancer driver gene; Red, NSCLC/lung cancer driver gene; Blue, genes are not pan-cancer driver genes or NSCLC/lung cancer driver gene. Roman type, Tie 1 gene in COSMIC (gene possessing a documented activity relevant to cancer, along with evidence of promoting oncogenic transformation); Italic, Tie 2 gene in COSMIC (genes with strong indications of a role in cancer but with less extensive available evidence). B Distributions of mutations. Left: within each individual patient, the percentages of mutations shared by all the tumor samples (Red), mutations shared by two or more tumor samples (Blue), and mutations private to only one tumor sample (Yellow), respectively. For each patient, both the primary lung tumors and the lymph node metastases tumors are identified as tumor samples, regardless of their locations. Right: within each individual patient, the percentages of mutations shared by primary lung tumors and lymph node metastases (Red), mutations private to primary lung tumor samples (Blue), and mutations private to lymph node metastasis samples (Yellow), regardless of the number of tumor samples. C The unsupervised clustering of all 11 patients based on non-synonymous mutations. All 11 patients are distinguished with different colors. Red, primary tumor. Blue, lymphatic metastasis tumors.
Fig. 4
Fig. 4. Clonal architecture and evolution of representative patients.
Left: CT (computerized tomography) images of each patient, with yellow arrows marking the tumor’s location. Middle: Heatmaps show the distribution of all non-silent mutations; presence (blue), and absence (gray). Colum next to the heatmap shows the distribution of mutations within each individual patient; mutations present in all tumor samples (blue), shared in more than one but not all tumor samples (orange), in only one lung tumor sample (red), and in only one lymph node metastasis tumor sample (green). Right: Phylogenetic trees based on the distribution of all detected mutations. Trunk and branch lengths are proportional to the number of non-silent mutations acquired. Putative driver genes are indicated next to the trunk or with an arrow pointing to the branches where they were detected. Orange, Pan-cancer driver gene; Red, known NSCLC/lung cancer driver gene; Roman type and Italic represent tie 1 gene and tie 2 genes in COSMIC, respectively.
Fig. 5
Fig. 5. Immunogenicity heterogeneity across and within individuals.
A Left: The number of all predicted neoantigens in each tumor of 11 patients. Right: The difference in the mean number of potential neoantigens in primary tumors and lymph node metastasis tumors based on Patient 1, 2, 4, 8, 9, and 11 (p value = 0.2416). The X-axis represents the sample, and the Y-axis represents the number of predicted neoantigens of each sample. B. Distributions of predicted neoantigens. Left: within each individual patient, the percentages of neoantigens shared by all the tumor samples (Red), shared by two or more tumor samples (Blue), and private to only one tumor sample (Yellow) in each patient, respectively. For each patient, both the primary lung tumors and the lymph node metastases tumors are identified as tumor samples, regardless of their locations. Right: within each individual patient, the percentages of neoantigens shared by primary lung tumors and lymph node metastases (Red), private to primary lung tumor samples (Blue), and private to lymph node metastasis samples (Yellow), regardless of the number of tumor samples. C Predictions of neoantigen binding affinity across all 9-11 amino acids peptides generated from nonsynonymous mutations and the matched wild-type peptides using NetMHCpan algorithms. Red, neoantigens shared by both primary and lymph node metastasis tumors within one individual patient; Blue, neoantigens private to primary lung tumor samples of one individual patient; Orange, neoantigens private to lymph node metastasis tumor samples of one individual patient. D Histograms and density plots of SciClone inferred clonal clusters. Left: Clonal clusters of all 11 patients. Right: Clonal clusters density plots of Patient 1 and 11.

References

    1. Siegel RL, Miller KD, Fuchs HE, Jemal A. Cancer statistics, 2022. CA Cancer J Clin. 2022;72:7–33. doi: 10.3322/caac.21708. - DOI - PubMed
    1. Hirsch FR, Scagliotti GV, Mulshine JL, Kwon R, Curran WJ, Jr, Wu YL, et al. Lung cancer: current therapies and new targeted treatments. Lancet. 2017;389:299–311. doi: 10.1016/S0140-6736(16)30958-8. - DOI - PubMed
    1. Herbst RS, Morgensztern D, Boshoff C. The biology and management of non-small cell lung cancer. Nature. 2018;553:446–54. doi: 10.1038/nature25183. - DOI - PubMed
    1. Leventakos K, Peikert T, Midthun DE, Molina JR, Blackmon S, Nichols FC, et al. Management of multifocal lung cancer: results of a survey. J Thorac Oncol. 2017;12:1398–402. doi: 10.1016/j.jtho.2017.05.013. - DOI - PMC - PubMed
    1. Zheng R, Shen Q, Mardekian S, Solomides C, Wang ZX, Evans NR., 3rd Molecular profiling of key driver genes improves staging accuracy in multifocal non-small cell lung cancer. J Thorac Cardiovasc Surg. 2020;160:e71–e9. doi: 10.1016/j.jtcvs.2019.11.126. - DOI - PubMed

Publication types