

Transcriptomic survey of key reproductive and metabolic tissues in mouse models of polycystic ovary syndrome
- PMID: 36653487
- PMCID: PMC9849269
- DOI: 10.1038/s42003-022-04362-0
Transcriptomic survey of key reproductive and metabolic tissues in mouse models of polycystic ovary syndrome
Abstract
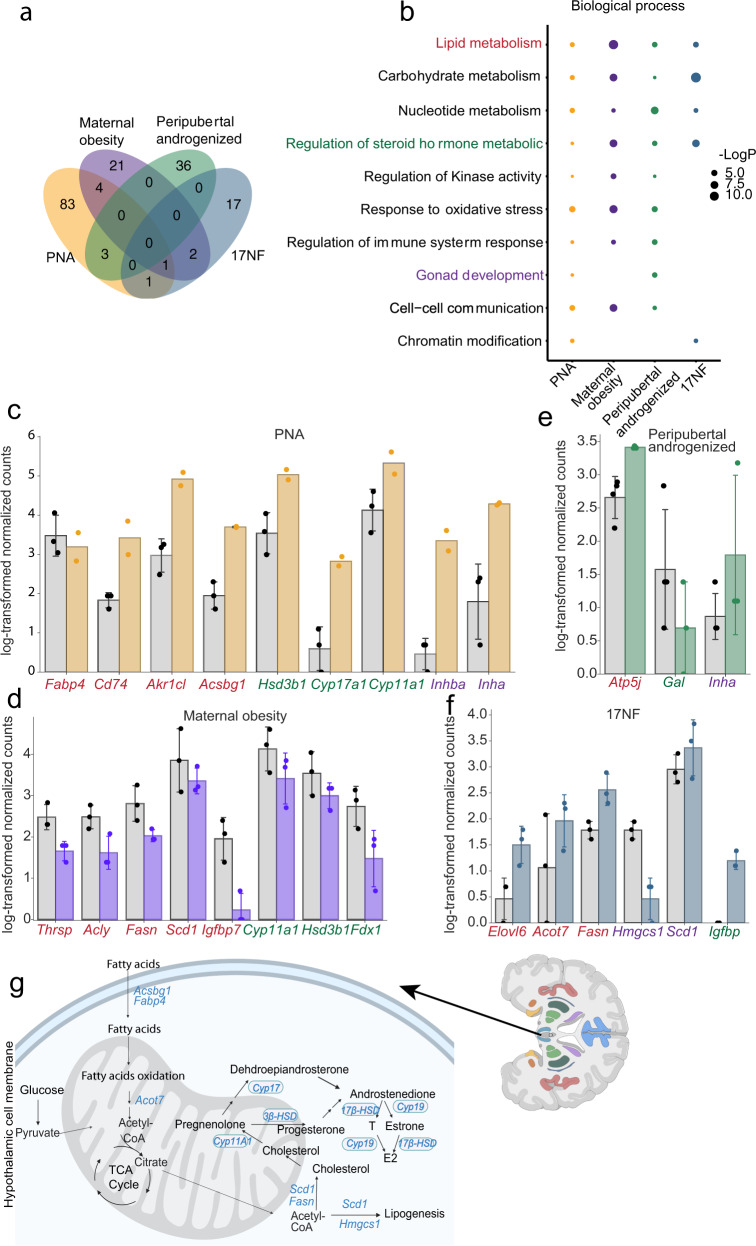
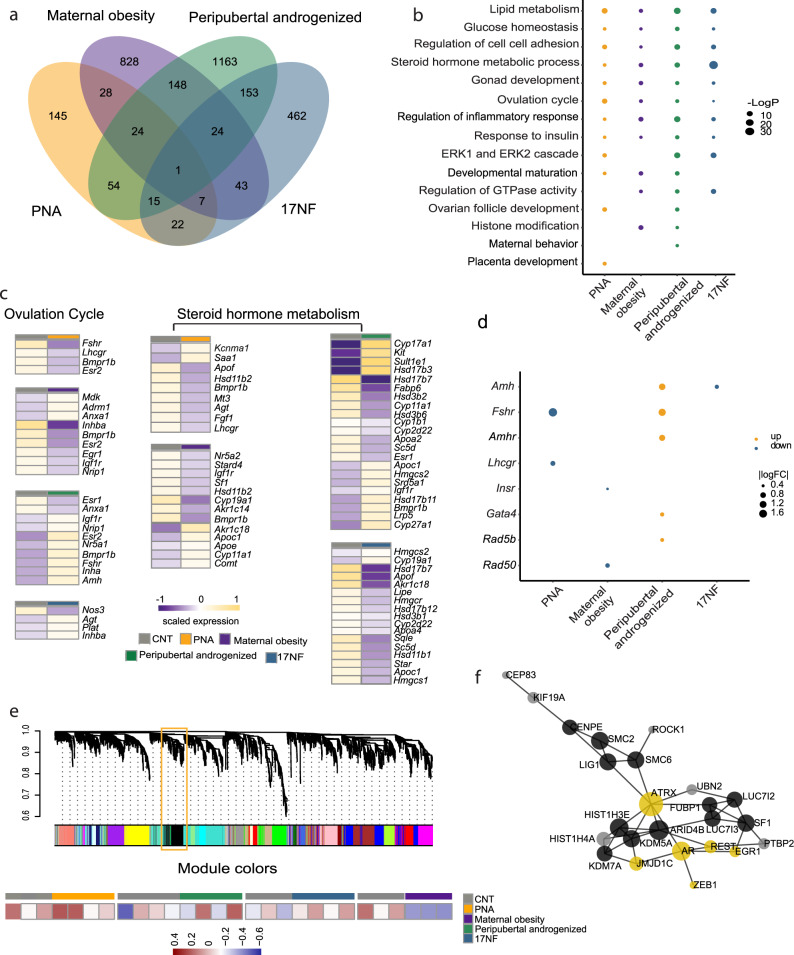
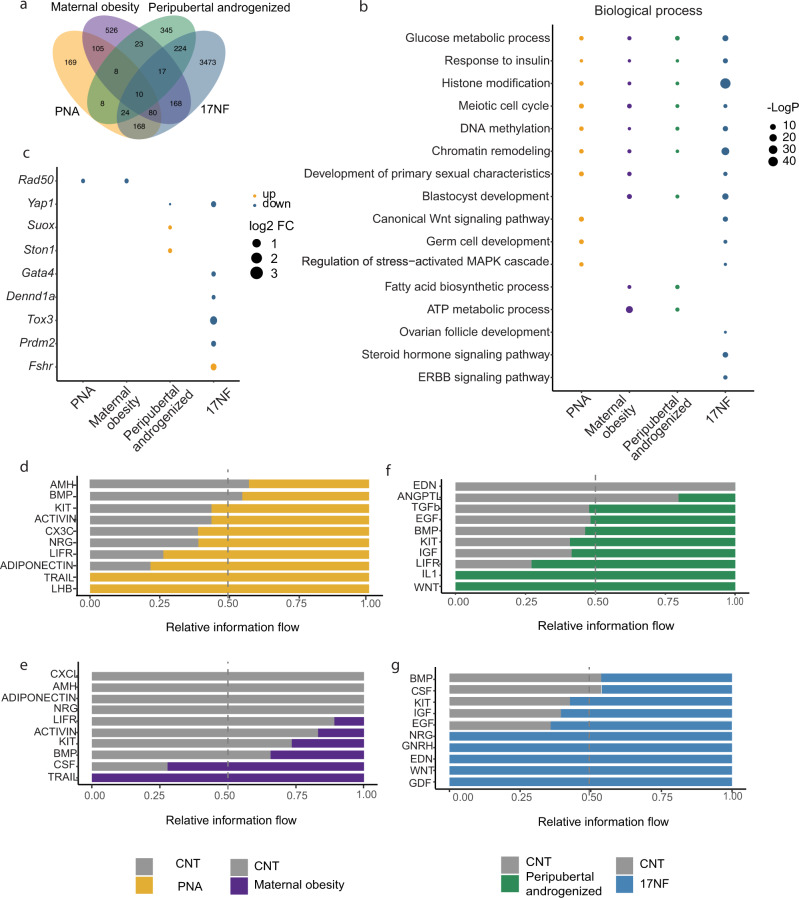
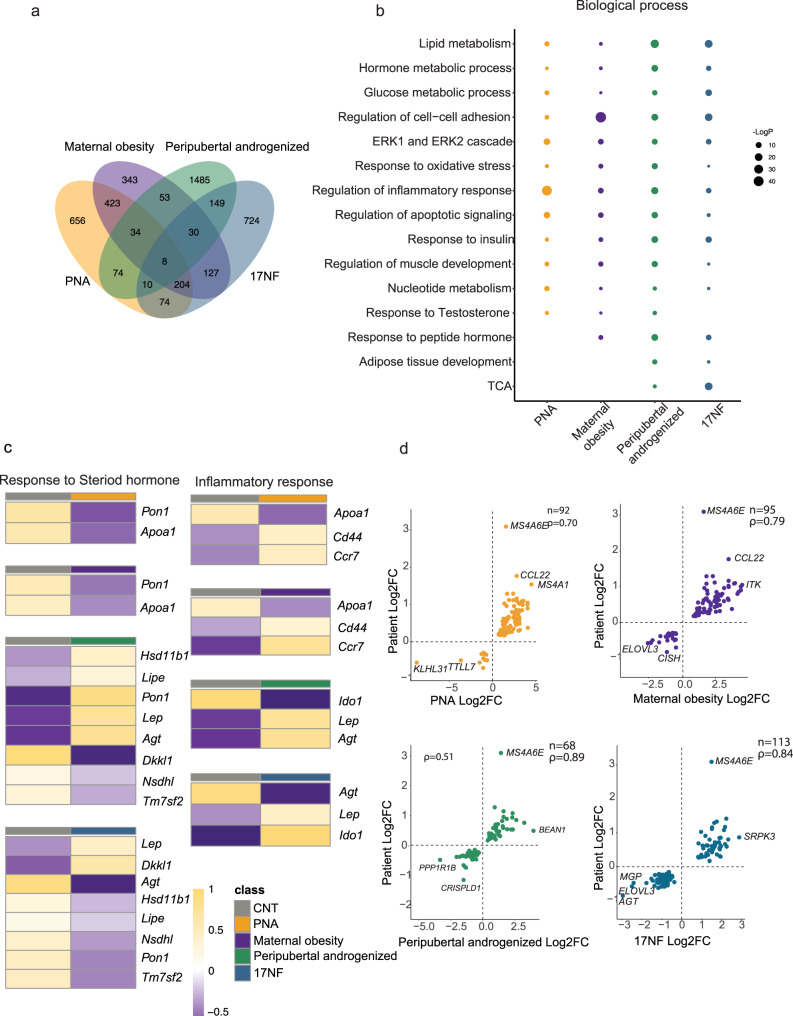
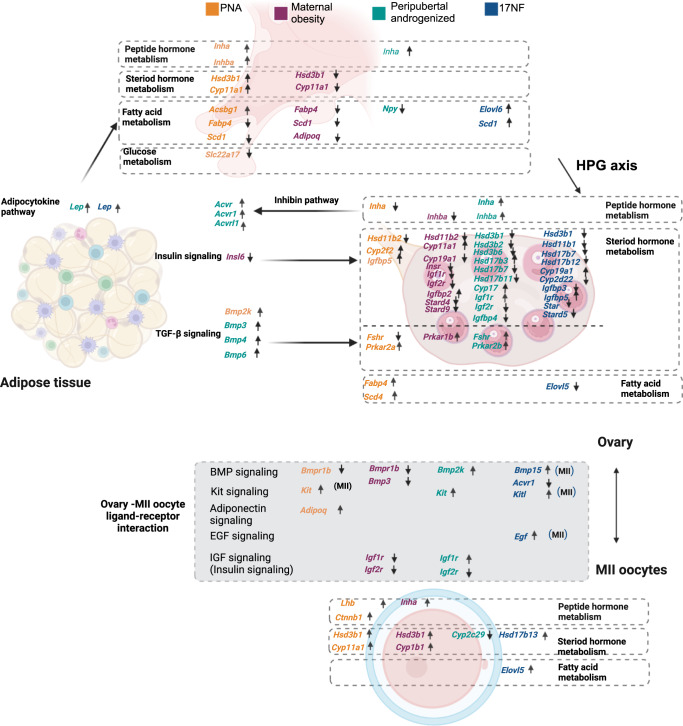
Excessive androgen production and obesity are key to polycystic ovary syndrome (PCOS) pathogenesis. Prenatal androgenized (PNA), peripubertal androgenized, and overexpression of nerve growth factor in theca cells (17NF) are commonly used PCOS-like mouse models and diet-induced maternal obesity model is often included for comparsion. To reveal the molecular features of these models, we have performed transcriptome survey of the hypothalamus, adipose tissue, ovary and metaphase II (MII) oocytes. The largest number of differentially expressed genes (DEGs) is found in the ovaries of 17NF and in the adipose tissues of peripubertal androgenized models. In contrast, hypothalamus is most affected in PNA and maternal obesity models suggesting fetal programming effects. The Ms4a6e gene, membrane-spanning 4-domains subfamily A member 6E, a DEG identified in the adipose tissue in all mouse models is also differently expressed in adipose tissue of women with PCOS, highlighting a conserved disease function. Our comprehensive transcriptomic profiling of key target tissues involved in PCOS pathology highlights the effects of developmental windows for androgen exposure and maternal obesity, and provides unique resource to investigate molecular mechanisms underlying PCOS pathogenesis.
© 2023. The Author(s).
Conflict of interest statement
The authors declare no competing interests.
Figures


Similar articles
-
Investigating GABA Neuron-Specific Androgen Receptor Knockout in two Hyperandrogenic Models of PCOS.Endocrinology. 2024 May 27;165(7):bqae060. doi: 10.1210/endocr/bqae060. Endocrinology. 2024. PMID: 38788194 Free PMC article.
-
Androgen receptor actions on AgRP neurons are not a major cause of reproductive and metabolic impairments in peripubertally androgenized mice.J Neuroendocrinol. 2024 Mar;36(3):e13370. doi: 10.1111/jne.13370. Epub 2024 Feb 12. J Neuroendocrinol. 2024. PMID: 38344844
-
Prenatal androgen exposure and transgenerational susceptibility to polycystic ovary syndrome.Nat Med. 2019 Dec;25(12):1894-1904. doi: 10.1038/s41591-019-0666-1. Epub 2019 Dec 2. Nat Med. 2019. PMID: 31792459
-
Metabolic dysfunction in polycystic ovary syndrome: Pathogenic role of androgen excess and potential therapeutic strategies.Mol Metab. 2020 May;35:100937. doi: 10.1016/j.molmet.2020.01.001. Epub 2020 Feb 5. Mol Metab. 2020. PMID: 32244180 Free PMC article.
-
Review: fetal programming of polycystic ovary syndrome by androgen excess: evidence from experimental, clinical, and genetic association studies.J Clin Endocrinol Metab. 2006 May;91(5):1660-6. doi: 10.1210/jc.2005-2757. Epub 2006 Mar 7. J Clin Endocrinol Metab. 2006. PMID: 16522691 Review.
Cited by
-
Androgen excess: a hallmark of polycystic ovary syndrome.Front Endocrinol (Lausanne). 2023 Dec 13;14:1273542. doi: 10.3389/fendo.2023.1273542. eCollection 2023. Front Endocrinol (Lausanne). 2023. PMID: 38152131 Free PMC article. Review.
-
A Cross-Sectional Study of Alzheimer-Related Proteins in Women with Polycystic Ovary Syndrome.Int J Mol Sci. 2024 Jan 18;25(2):1158. doi: 10.3390/ijms25021158. Int J Mol Sci. 2024. PMID: 38256230 Free PMC article.
-
A study on the immunological vitality of an inflammatory biomarker explored with rs5743708 polymorphism in TLR2 gene among Saudi women confirmed with polycystic ovarian syndrome.Saudi J Biol Sci. 2023 Jul;30(7):103687. doi: 10.1016/j.sjbs.2023.103687. Epub 2023 May 19. Saudi J Biol Sci. 2023. PMID: 37485450 Free PMC article.
-
MS4A superfamily molecules in tumors, Alzheimer's and autoimmune diseases.Front Immunol. 2024 Dec 9;15:1481494. doi: 10.3389/fimmu.2024.1481494. eCollection 2024. Front Immunol. 2024. PMID: 39717774 Free PMC article. Review.
-
Dissecting the Impact of Maternal Androgen Exposure on Developmental Programming through Targeting the Androgen Receptor.Adv Sci (Weinh). 2024 Sep;11(36):e2309429. doi: 10.1002/advs.202309429. Epub 2024 Jul 29. Adv Sci (Weinh). 2024. PMID: 39075722 Free PMC article.
References
Publication types
MeSH terms
Substances
LinkOut - more resources
Full Text Sources
Medical
Molecular Biology Databases
