. 2023 Jan 18;6(1):66.
doi: 10.1038/s42003-022-04327-3.

Acclimatization of a coral-dinoflagellate mutualism at a CO2 vent

Affiliations

Acclimatization of a coral-dinoflagellate mutualism at a CO2 vent

Fiorella Prada et al. Commun Biol. .

Abstract

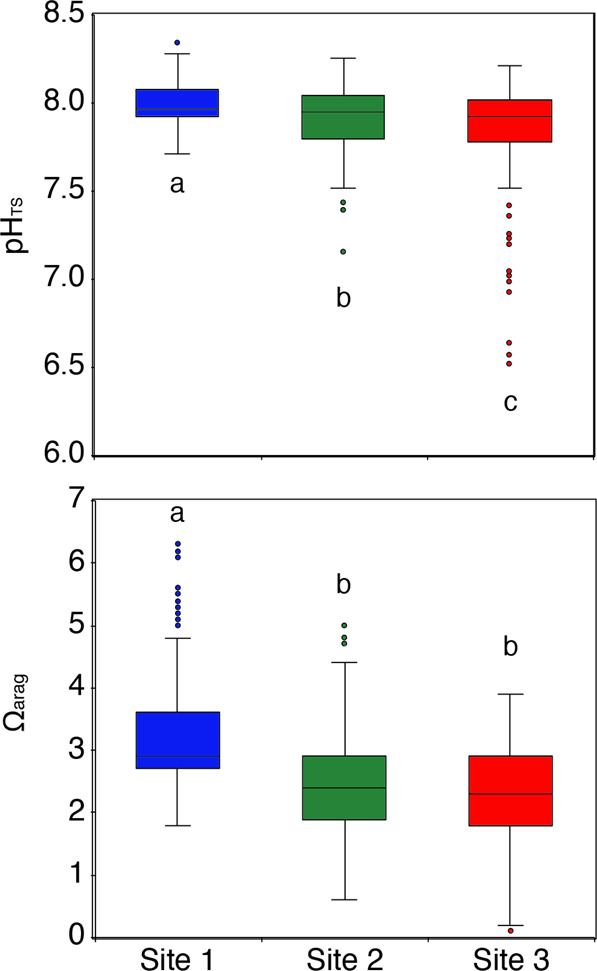
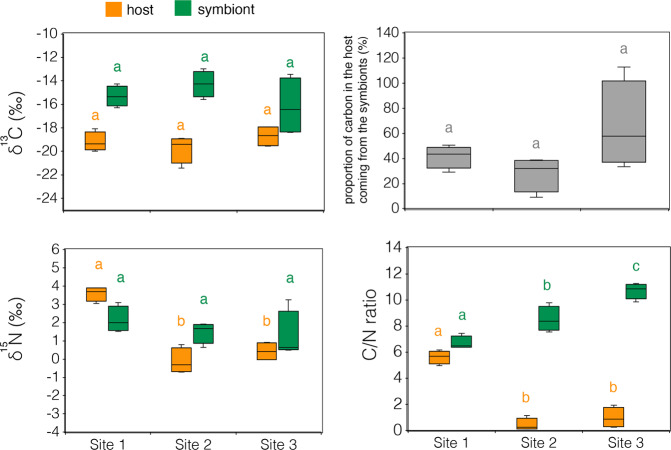
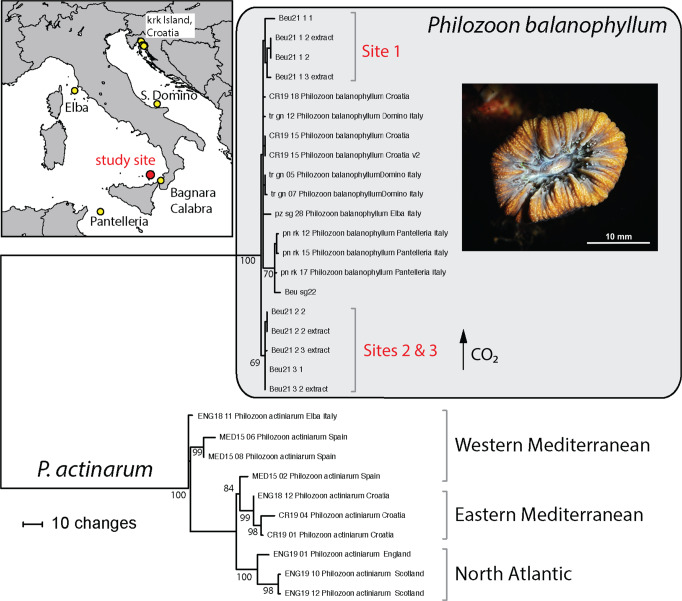
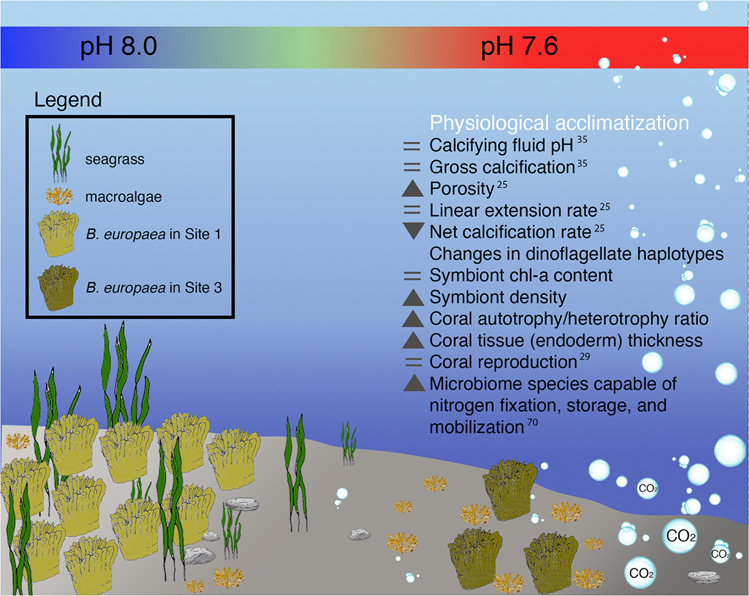
Ocean acidification caused by shifts in ocean carbonate chemistry resulting from increased atmospheric CO2 concentrations is threatening many calcifying organisms, including corals. Here we assessed autotrophy vs heterotrophy shifts in the Mediterranean zooxanthellate scleractinian coral Balanophyllia europaea acclimatized to low pH/high pCO2 conditions at a CO2 vent off Panarea Island (Italy). Dinoflagellate endosymbiont densities were higher at lowest pH Sites where changes in the distribution of distinct haplotypes of a host-specific symbiont species, Philozoon balanophyllum, were observed. An increase in symbiont C/N ratios was observed at low pH, likely as a result of increased C fixation by higher symbiont cell densities. δ13C values of the symbionts and host tissue reached similar values at the lowest pH Site, suggesting an increased influence of autotrophy with increasing acidification. Host tissue δ15N values of 0‰ strongly suggest that diazotroph N2 fixation is occurring within the coral tissue/mucus at the low pH Sites, likely explaining the decrease in host tissue C/N ratios with acidification. Overall, our findings show an acclimatization of this coral-dinoflagellate mutualism through trophic adjustment and symbiont haplotype differences with increasing acidification, highlighting that some corals are capable of acclimatizing to ocean acidification predicted under end-of-century scenarios.


Conflict of interest statement

The authors declare no competing interests.

Figures

Fig. 1
Fig. 1. Ranges of measured pHTS and Ωarag values showing consistent decreases from Site 1 to Site 3.
The boxes indicate the 25th and 75th percentiles and the line within the boxes mark the medians. Whisker length is equal to 1.5 × interquartile range (IQR). Circles represent outliers. Different letters indicate statistical differences (p < 0.05; number of observations: pHTS = 185-198 per Site; Ωarag = 184–195 per Site).
Fig. 2
Fig. 2. Boxplots of fluorescence parameters obtained by PAM measurements at the three Sites and at three time intervals.
a Effective quantum yield (ΔF/Fm´), b minimum fluorescence (F), and c maximum fluorescence (Fm´). For each parameter, significant differences (p < 0.01) between time intervals are indicated by different colors (significantly higher mean value is ranked as white->light gray->dark grey). The boxes indicate the 25th and 75th percentiles and the line within the boxes mark the medians. Whisker length is equal to 1.5 × interquartile range (IQR). Circles represent outliers. Different letters indicate statistical differences (p < 0.05; number of specimens measured is reported in Supplementary Table 3).
Fig. 3
Fig. 3. Symbiont cells in B. europaea polyps sampled along the Panarea pH gradient.
ac Histological transverse sections of representative polyps in Sites 1-3 (x 4 magnification). df Symbiont cells within the endoderm of the mesentery highlighted by x40 magnification. z: zooxanthellae; ec: ectoderm; m: mesoglea; en: endoderm. g Symbiont cell density and h chlorophyll-a (chl-a) concentration normalized over cell count or i polyp area. The boxes indicate the 25th and 75th percentiles and the line within the boxes mark the medians. Whisker length is equal to 1.5 × interquartile range (IQR). Circles represent outliers. Different letters indicate statistical differences (p < 0.05; number of corals = 4 per Site).
Fig. 4
Fig. 4. δ13C, δ15N, C/N ratios, and proportion of carbon in the host coming from the symbionts in B. europaea tissue from Sites 1 (control), 2 (intermediate pH) and 3 (low pH).
The proportion of carbon in the host supplied by the symbionts was calculated using the formula: δ13Ctissue=(δ13Csymbiont)x+(1x)(δ13Czooplankton/POC). We assume δ13Czooplankton/POC = −22‰. The boxes indicate the 25th and 75th percentiles and the line within the boxes mark the medians. Whisker length is equal to 1.5 × interquartile range (IQR). Different letters indicate statistical differences (p < 0.05) between Sites (number of corals = 4 per Site).
Fig. 5
Fig. 5. Philozoon balanophyllum phylogeny.
Philozoon balanophyllum halpotypes in B. europaea specimens from Sites 1-3 along the Panarea pH gradient and from around the Tyrrhenian and Adriatic Seas. Haplotypes of Philozoon actinarum, the symbiont of the sea anemone Anemonia viridis, common to the Mediterranean, are provided as the outgroup. (Photograph by Francesco Sesso).
Fig. 6
Fig. 6. Conceptual scheme summarizing the effects of life-long physiological acclimatization to low pH/high pCO2 conditions in B. europaea at the Panarea CO2 vent.
Under low pH conditions, coral population density decreases, net calcification is depressed, while linear extension rate is maintained constant, allowing the coral to reach critical size at sexual maturity and reproduce. Moreover, an overall rearrangement of the coral holobiont is documented by: (i) an increase in symbiont cell density, triggered by thickening of the coral tissue and the establishment of novel dinoflagellate haplotypes possibly better adapted to lower pH conditions, and (ii) an increase, within the coral tissue/mucus in microbial communities capable of dinitrogen fixation as well as N storage and mobilization. Variations displayed by corals living at average pH 7.6 compared to corals at average pH 8.0 are shown with grey symbols and are listed in the following order: skeleton (from micro to macro), symbionts (from micro to macro), trophic strategy, reproduction, tissue/mucus microbial community. Darker and lighter shades of green in the coral sketches represent higher and lower symbiont cell density. The color scale bar highlighting the seawater pH change across the gradient does not match the color scale of pH test strips. Image was assembled using Adobe Photoshop CC (19.1.6).

References

    1. Steffen W. Introducing the Anthropocene: The human epoch. Ambio. 2021;50:1784–1787. doi: 10.1007/s13280-020-01489-4. - DOI - PMC - PubMed
    1. Keys PW, et al. Anthropocene risk. Nat. Sustain. 2019;2:667–673. doi: 10.1038/s41893-019-0327-x. - DOI
    1. Bell G. Evolutionary rescue and the limits of adaptation. Philos. Trans. R. Soc. B Biol. Sci. 2013;368:20120080. doi: 10.1098/rstb.2012.0080. - DOI - PMC - PubMed
    1. Byrne M, Przeslawski R. Multistressor impacts of warming and acidification of the ocean on marine invertebrates’ life histories. Integr. Comp. Biol. 2013;53:582–596. doi: 10.1093/icb/ict049. - DOI - PubMed
    1. Feely RA, et al. Impact of anthropogenic CO2 on the CaCO3 system in the oceans. Science. 2004;305:362–366. doi: 10.1126/science.1097329. - DOI - PubMed

Publication types