. 2022 Dec 21;26(1):105852.
doi: 10.1016/j.isci.2022.105852. eCollection 2023 Jan 20.

Activation-induced cytidine deaminase expression by thymic B cells promotes T-cell tolerance and limits autoimmunity

Affiliations

Activation-induced cytidine deaminase expression by thymic B cells promotes T-cell tolerance and limits autoimmunity

Félix Lombard-Vadnais et al. iScience. .

Abstract

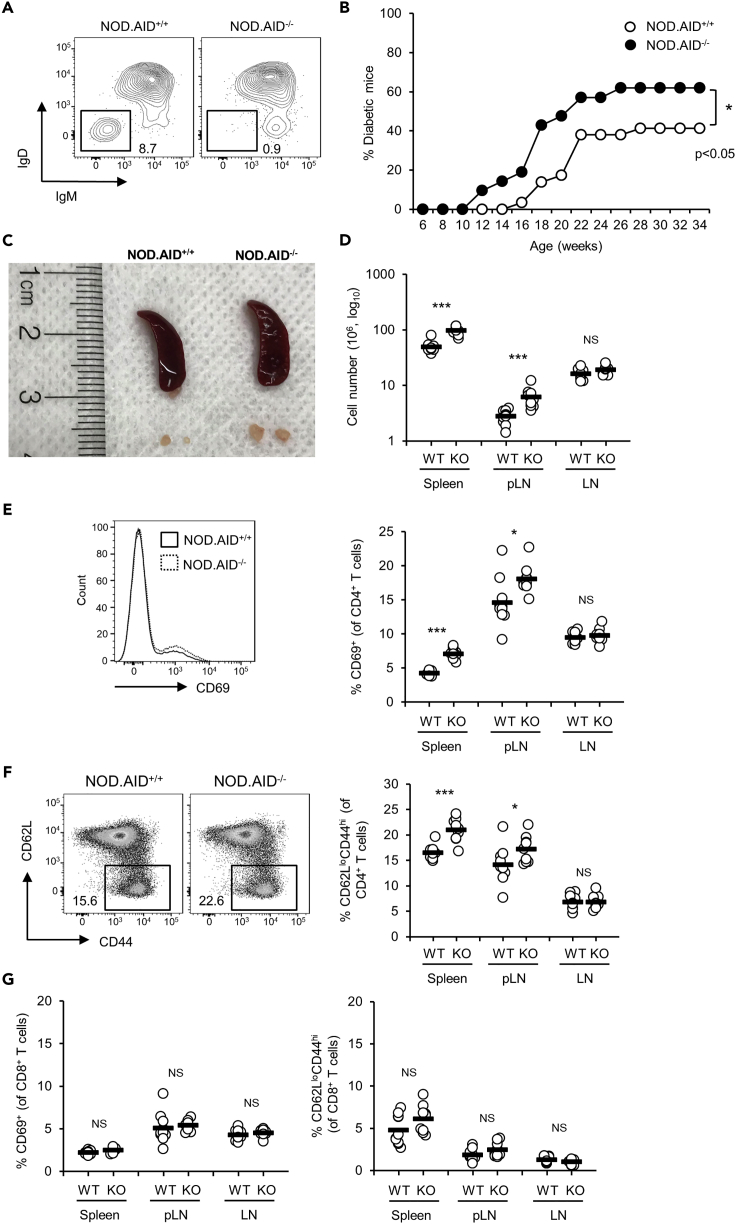
Elimination of self-reactive T cells in the thymus is critical to establish T-cell tolerance. A growing body of evidence suggests a role for thymic B cells in the elimination of self-reactive thymocytes. To specifically address the role of thymic B cells in central tolerance, we investigated the phenotype of thymic B cells in various mouse strains, including non-obese diabetic (NOD) mice, a model of autoimmune diabetes. We noted that isotype switching of NOD thymic B cells is reduced as compared to other, autoimmune-resistant, mouse strains. To determine the impact of B cell isotype switching on thymocyte selection and tolerance, we generated NOD.AID-/- mice. Diabetes incidence was enhanced in these mice. Moreover, we observed reduced clonal deletion and a resulting increase in self-reactive CD4+ T cells in NOD.AID-/- mice relative to NOD controls. Together, this study reveals that AID expression in thymic B cells contributes to T-cell tolerance.

Keywords: Immunity; Immunology.


Conflict of interest statement

The authors declare no competing interests.

Figures

None
Graphical abstract
Figure 1
Figure 1
Unique characteristics of thymic B cells from NOD mice (A) Representative flow cytometry profiles and (B) quantification of MHC II expression on B cells from the spleen and the thymus of B6 and NOD mice (n = 7-8, Mann-Whitney U test), measured by mean fluorescence intensity (MFI). (C) Representative flow cytometry profiles of CD80 expression on splenic and thymic B cells (CD19+B220+) from B6 and NOD mice. (D) Compilation of the percentage of CD80+ B cells from the spleen and thymus of B6 and NOD mice (n > 14, Mann-Whitney U test). (E) Representative flow cytometry profiles of IgM and IgD expression on thymic B cells from B6 and NOD mice. Scaling = 5% with outliers shown for contour plots. (F) Compilation of the percentage of IgMIgD thymic B cells from B6 and NOD mice (n > 16, Mann-Whitney U test). (G) Compilation of the percentage of IgMIgD thymic B cells from genetically divergent mouse strains (n = 6, one-way ANOVA). (H) Distribution of antibody subclasses expressed by IgMIgD thymic B cells from the same mice as in (G). "Other" refers to B cells with a IgMIgDIgAIgG1IgG2b phenotype. The data was acquired in at least three independent experiments. Dots represent data from individual mice and the dash depicts the mean. ∗, p < 0.05; ∗∗, p < 0.01; ∗∗∗, p < 0.001. See also Figure S1.
Figure 2
Figure 2
NOD thymic B cell traits correlate with reduced T-cell tolerance to self-antigens Correlation between the percentage of isotype-switched thymic B cells and the expression of CD69 on (A) CD4SP and (B) CD8SP thymocytes from the same mice as in Figure 1G. Each color represents a different mouse strain. (C) Representative flow cytometry profiles (top panel) and compilation (bottom panel) of CD4SP and CD8SP subsets in the thymus of B6 and NOD mice (n = 10-11, Mann-Whitney U test). (D) Representative flow cytometry profiles (top panel) and percentage (bottom panel) of active caspase-3+ CD4SP thymocytes from B6 and NOD mice (n = 5, Mann-Whitney U test). (E) Schematic of the in vitro co-culture assay used in F-H. (F) Representative flow cytometry profiles of CFSE and CD44 expression on CD4SP thymocytes from the co-cultures. (G) Compilation of the percentage of CFSEloCD44hi cells in thymocytes from the co-cultures (n = 4-5, Mann-Whitney U test). (H) Proliferation index of the thymocytes at the end of the co-cultures (n = 4-5, Mann-Whitney U test). The data was acquired in at least two independent experiments. Dots represent data from individual mice and the dash denotes the mean. NS, non-significant p > 0.05; ∗, p < 0.05; ∗∗, p < 0.01; ∗∗∗, p < 0.001. See also Figure S1.
Figure 3
Figure 3
AID deficiency promotes the development of autoimmune diabetes (A) Representative flow cytometry profiles of IgM and IgD expression on thymic B cells from NOD.AID+/+ and NOD.AID−/− mice. Scaling = 5% with outliers shown for contour plots. (B) Diabetes incidence of female NOD.AID+/+ (n = 29) and NOD.AID−/− (n = 21) mice (Log Rank (Mantel-Cox) test). (C) Image of representative spleens and pancreatic lymph nodes from non-diabetic NOD.AID+/+ and NOD.AID−/− mice. (D) Absolute numbers of cells in the spleen, pancreatic and skin-draining lymph nodes from non-diabetic NOD.AID+/+ and NOD.AID−/− mice (n = 9-10, Mann-Whitney U test). (E) Representative flow cytometry profiles of CD69 expression on splenic CD4+ T cells (left panel) and compilation of the percentage (right panel) of CD69+ CD4+ T cells from the spleen, pancreatic lymph nodes, and skin-draining lymph nodes of non-diabetic NOD.AID+/+ and NOD.AID−/− mice (n = 9-10, Mann-Whitney U test). (F) Representative flow cytometry profiles of CD62L and CD44 expression on splenic CD4+ T cells (left panel) and compilation of the percentage (right panel) of CD62LloCD44hi CD4+ T cells from the spleen, pancreatic lymph nodes, and skin-draining lymph nodes of non-diabetic NOD.AID+/+ and NOD.AID−/− mice (n = 9-10, Mann-Whitney U test). (G) Compilation of the percentage of CD69+ (left panel) and CD62LloCD44hi (right panel) CD8+ T cells from the spleen, pancreatic lymph nodes, and skin-draining lymph nodes of non-diabetic NOD.AID+/+ and NOD.AID−/− mice (n = 9-10, Mann-Whitney U test). The data was acquired in at least three independent experiments. Dots represent data for individual mice and the dash denotes the mean. NS, non-significant p > 0.05; ∗, p < 0.05; ∗∗∗, p < 0.001. See also Figure S2.
Figure 4
Figure 4
AID deletion impacts T-cell diabetogenicity and enhances insulitis (A) Diabetes incidence of female NOD.Rag−/− mice that received 6-8 x 10⁶ total splenic T cells from age-matched non-diabetic female NOD.AID+/+ and NOD.AID−/− mice (n = 6-8, Log Rank [Mantel-Cox] test). (B) Representative images of an intact (left) and infiltrated (right) islet from the pancreas of a NOD.Rag−/− mouse 10 weeks after intravenous injection of 22 x 106 total NOD.AID−/− thymocytes (scale bar represents 25 μm). (C) Insulitis score for female NOD.Rag−/− mice 10 weeks post-injection of 22 x 106 total thymocytes from adult female NOD.AID+/+ or NOD.AID−/− mice (n = 6-7, Chi-square test). Scale: 0 = no infiltration, 1 = peri-insulitis, 2 = infiltration <50%, 3 = infiltration >50%, 4 = complete infiltration. Compilation of the percentage of CD69+ CD4+ (D) and CD8+ (E) T cells at 10 weeks post-injection of thymocytes for the mice described in (C) (n = 6-7, Mann-Whitney U test). The data was acquired in at least three independent experiments. NS, non-significant p > 0.05; ∗, p < 0.05; ∗∗, p < 0.01. Dots represent data from individual mice and the dash denotes the mean.
Figure 5
Figure 5
AID deletion impairs the negative selection of CD4SP thymocytes (A) Representative flow cytometry profiles of active Caspase-3 expression in CD4SP thymocytes and (B) compilation of the percentage of active caspase-3+ DP, CD4SP, and CD8SP thymocytes from NOD.AID+/+ and NOD.AID−/− mice (n = 8-10, Mann-Whitney U test). (C) Representative flow cytometry profiles and (D) compilation of the percentage of HELIOS+ CD4SP thymocytes from NOD.AID+/+ and NOD.AID−/− mice (n = 9-13, Mann-Whitney U test). (E) Representative flow cytometry profiles of ex vivo DP, CD4SP, and CD8SP thymocytes conjugated with thymic B cells from NOD.AID+/+ and NOD.AID−/− mice. (F) Compilation of the percentage of DP, CD4SP, and CD8SP thymocytes conjugated to thymic B cells from NOD.AID+/+ and NOD.AID−/− mice normalized to the percentage of total B cells in the thymus of each mouse (n = 8-9, Mann-Whitney U test). (G) Representative flow cytometry profiles of CFSE and CD44 expression on CD4SP thymocytes from NOD.AID+/+ and NOD.AID−/− mice co-cultured with activated splenic B cells from NOD.CD45.2+ mice. (H) Compilation of the percentage of CFSEloCD44hi cells in thymocytes from the co-cultures (n = 7, Mann-Whitney U test). (I) Proliferation index of the thymocytes at the end of the co-cultures (n = 7). The data was acquired in at least three independent experiments. Dots represent data from individual mice and the dash denotes the mean. NS, non-significant p > 0.05; ∗, p < 0.05; ∗∗, p < 0.01; ∗∗∗, p < 0.001. See also Figure S3.
Figure 6
Figure 6
AID expression promotes clonal deletion of self-reactive thymocytes (A) Representative flow cytometry profiles of 3A9 TCR-transgenic CD4SP thymocytes from single transgenic (3A9 TCR+HEL) and double transgenic (3A9 TCR+HEL+) B10.BR mice, deficient or not for AID (AID−/− or AID+/+ as indicated). (B) Compilation of the number of 3A9 TCR+ CD4SP thymocytes in the same mice presented in (A) (n = 5-9, Mann-Whitney U test). (C) Representative flow cytometry profiles (left panel) and compilation (right panel) of conjugates between 3A9 TCR+ CD4SP thymocytes and thymic B cells in HEL and HEL+ transgenic B10.BR mice (Mann-Whitney U test). (D) RFI (Relative fluorescence intensity) of the 3A9 TCR on the surface of 3A9 TCR+ CD4SP thymocytes, conjugated or not with thymic B cells (n = 16, paired t-test). RFI was calculated by normalizing to the average of the 3A9 TCR MFI on CD4SP single cells for each experiment. The data was acquired in at least three independent experiments. NS, non-significant p > 0.05; ∗, p < 0.05; ∗∗, ∗∗∗, p < 0.001. Dots represent data for individual mice and the dash represents the mean.
Figure 7
Figure 7
Deletion of AID in B6 mice limits apoptosis of CD4SP thymocytes and induces insulitis (A) Compilation of the percentage of active caspase-3+ post-selection DP, CD8SP, and CD4SP thymocytes from B6.AID+/+ and B6.AID−/− mice (n = 6-8, Mann-Whitney U test). (B) Compilation of the percentage of infiltrated pancreatic islets in 2-month-old and 12-month-old B6.AID+/+ and B6.AID−/− mice (n = 4-6, Mann-Whitney U test). (C) Representative fluorescence microscopy images of pancreatic islets from a 12-month-old B6.AID−/− mouse, with (bottom panels) and without (top panels) peri-insulitis (magnification 10X, scale bar represents 50 μm). The data was acquired in at least three independent experiments. NS, non-significant p > 0.05; ∗, p < 0.05; ∗∗∗, p < 0.001. Dots represent data for individual mice and the dash denotes the mean.

Similar articles

Cited by

References

    1. Labrecque N., Baldwin T., Lesage S. Molecular and genetic parameters defining T-cell clonal selection. Immunol. Cell Biol. 2011;89:16–26. doi: 10.1038/icb.2010.119. - DOI - PubMed
    1. Klein L., Kyewski B., Allen P.M., Hogquist K.A. Positive and negative selection of the T cell repertoire: what thymocytes see (and don't see) Nat. Rev. Immunol. 2014;14:377–391. doi: 10.1038/nri3667. - DOI - PMC - PubMed
    1. Sebzda E., Mariathasan S., Ohteki T., Jones R., Bachmann M.F., Ohashi P.S. Selection of the T cell repertoire. Annu. Rev. Immunol. 1999;17:829–874. doi: 10.1146/annurev.immunol.17.1.829. - DOI - PubMed
    1. Miyama-Inaba M., Kuma S., Inaba K., Ogata H., Iwai H., Yasumizu R., Muramatsu S., Steinman R.M., Ikehara S. Unusual phenotype of B cells in the thymus of normal mice. J. Exp. Med. 1988;168:811–816. doi: 10.1084/jem.168.2.811. - DOI - PMC - PubMed
    1. Isaacson P.G., Norton A.J., Addis B.J. The human thymus contains a novel population of B lymphocytes. Lancet. 1987;2:1488–1491. doi: 10.1016/s0140-6736(87)92622-5. - DOI - PubMed