. 2023 Jun 16;17(6):960-971.
doi: 10.1093/ecco-jcc/jjad006.

GATA6-AS1 Regulates Intestinal Epithelial Mitochondrial Functions, and its Reduced Expression is Linked to Intestinal Inflammation and Less Favourable Disease Course in Ulcerative Colitis

Affiliations

GATA6-AS1 Regulates Intestinal Epithelial Mitochondrial Functions, and its Reduced Expression is Linked to Intestinal Inflammation and Less Favourable Disease Course in Ulcerative Colitis

Katya E Sosnovski et al. J Crohns Colitis. .

Abstract

Background and aims: Widespread dysregulation of long non-coding RNAs [lncRNAs] including a reduction in GATA6-AS1 was noted in inflammatory bowel disease [IBD]. We previously reported a prominent inhibition of epithelial mitochondrial functions in ulcerative colitis [UC]. However, the connection between reduction of GATA6-AS1 expression and attenuated epithelial mitochondrial functions was not defined.

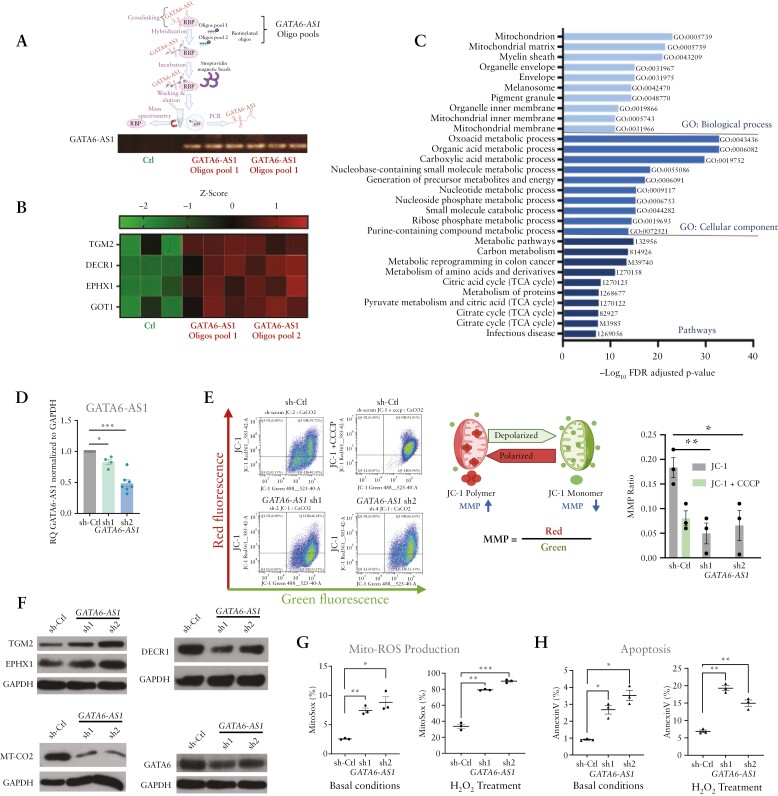
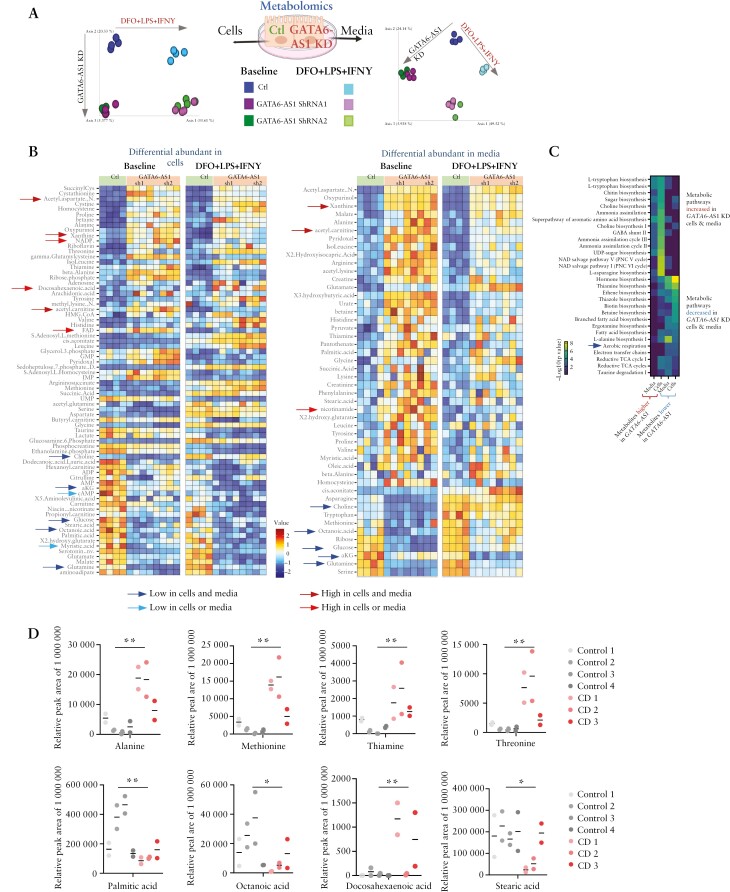
Methods: Mucosal transcriptomics was used to conform GATA6-AS1 reduction in several treatment-naïve independent human cohorts [n=673]. RNA pull-down followed by mass spectrometry was used to determine the GATA6-AS1 interactome. Metabolomics and mitochondrial respiration following GATA6-AS1 silencing in Caco-2 cells were used to elaborate on GATA6-AS1 functions.

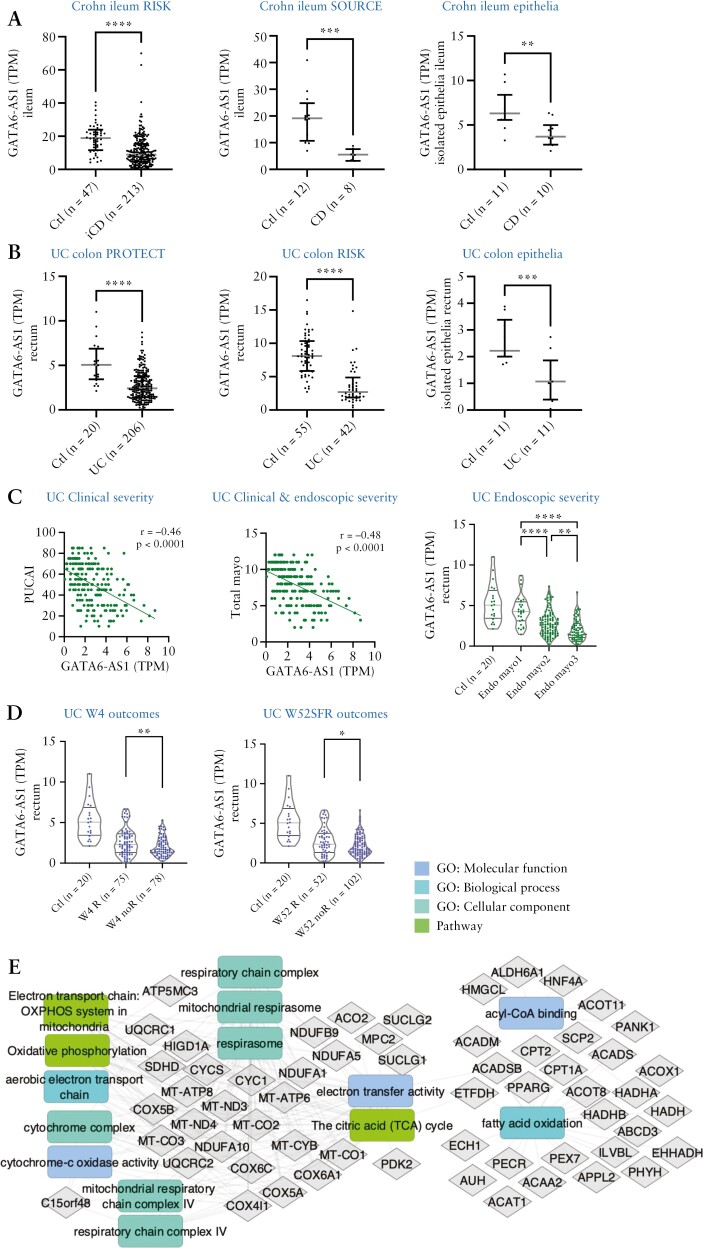
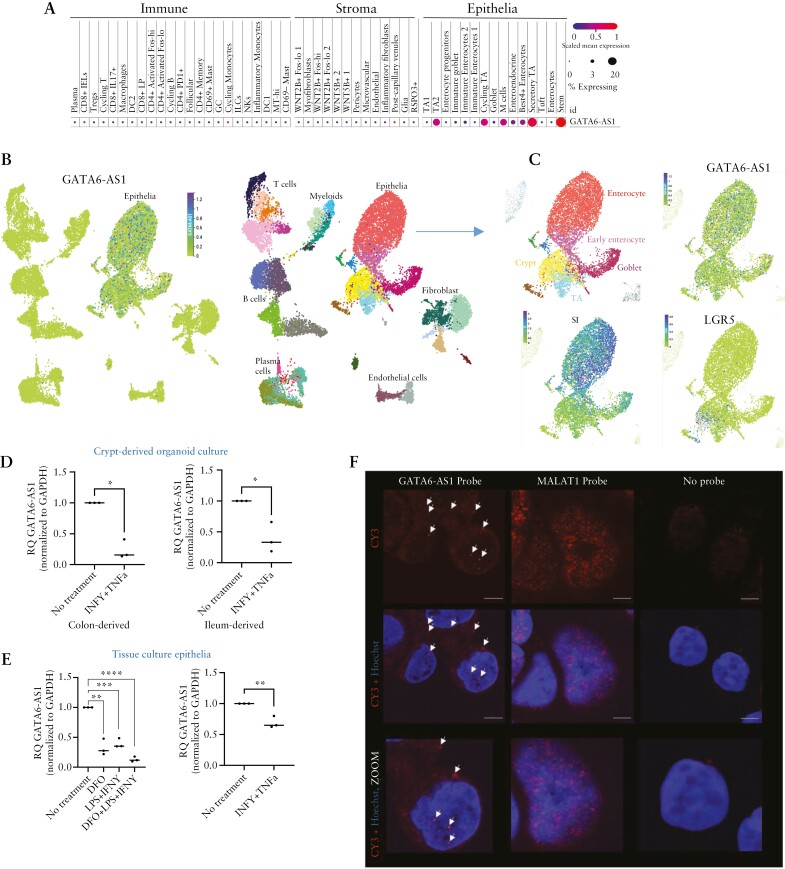
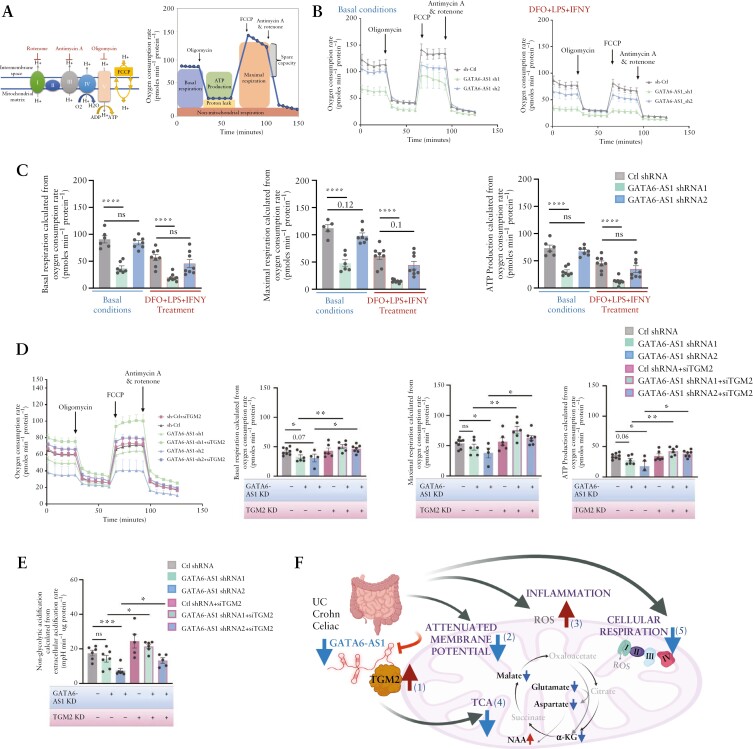
Results: GATA6-AS1 showed predominant expression in gut epithelia using single cell datasets. GATA6-AS1 levels were reduced in Crohn's disease [CD] ileum and UC rectum in independent cohorts. Reduced GATA6-AS1 lncRNA was further linked to a more severe UC form, and to a less favourable UC course. The GATA6-AS1 interactome showed robust enrichment for mitochondrial proteins, and included TGM2, an autoantigen in coeliac disease that is induced in UC, CD and coeliac disease, in contrast to GATA6-AS1 reduction in these cohorts. GATA6-AS1 silencing resulted in induction of TGM2, and this was coupled with a reduction in mitochondrial membrane potential and mitochondrial respiration, as well as in a reduction of metabolites linked to aerobic respiration relevant to mucosal inflammation. TGM2 knockdown in GATA6-AS1-deficient cells rescued mitochondrial respiration.

Conclusions: GATA6-AS1 levels are reduced in UC, CD and coeliac disease, and in more severe UC forms. We highlight GATA6-AS1 as a target regulating epithelial mitochondrial functions, potentially through controlling TGM2 levels.

Keywords: GATA6-AS1 long non-coding RNA; inflammatory bowel disease; mitochondria.


Conflict of interest statement

The following authors have no conflicts of interest: KES, TB, AA, MB, KLV, NL, HAE, KB, RBY, SAA, SRM, SK, IA, EGS, BW, IB, EG, TG, SBH, IU, LAD, YH. JSH: Advisory Board Janssen, consultant: Takeda, Pfizer, Bristol Myers Squibb, Boehringer Ingleheim, and Eli Lilly.

Figures

Figure 1.
Figure 1.
GATA6-AS1 is reduced in UC, CD and coeliac disease, in isolated epithelia in CD and UC, and is further reduced in UC cases with less favourable outcome. [A–C] GATA6-AS1 mRNA expression in CD ileum [A; RISK, SOURCE, isolated epithelia27] and UC colon [B; PROTECT, RISK, isolated epithelia]. Lines indicate median and upper and lower quartile. [C] GATA6-AS1 is further reduced in more severe UC cases based on clinical [PUCAI], combined clinical–endoscopic [Total Mayo score] and endoscopic disease severity [Endoscopic Mayo score] in the PROTECT cohort. [D] GATA6-AS1 mRNA reduction is linked to less favourable disease outcome [W4R or W52SFR] in the PROTECT cohort. GATA6-AS1 levels in controls are given as a reference. [E] Functional annotation enrichments using ToppGene/ToppCluster and Cytoscape of the GATA6-AS1 co-expression network in PROTECT using Euclidean distance [full list and FDR values are given in Supplementary Dataset S1].
Figure 2.
Figure 2.
GATA6-AS1 expression in the gut is confined to epithelia. [A–C] Cellular expression of GATA6-AS1 in single-cell dataset of human colon [A] and ileum [B and C]. The size and colour of the dots are proportional to the percentage of cells expressing the gene and the normalized expression level, respectively [A]. [B, C] Uniform manifold approximation and projection [UMAP] plot with the indicated cell types [B, left] and a map coloured by GATA6-AS1 expression [B, right] with further focus on epithelial cell types and expression of the mature epithelial and stem cell markers SI and LGR5 respectively [C], overall showing GATA6-AS1 specificity to epithelia. [D] GATA6-AS1 expression in patient-derived ileum and colon differentiated organoid culture, with and without 40 ng/ml IFNγ plus 20 ng/ml TNFα treatment. [E] GATA6-AS1 expression with and without 100 ng/ml LPS plus 40 ng/ml IFNγ and 100 µM DFO in HT29 [left] and 40 ng/ml IFNγ plus 20 ng/ml TNFα in Caco-2 cells. [F] Fluorescence in situ hybridization [FISH] showing GATA6-AS1 [red, arrows] distribution between the nucleus and cytoplasm in Caco-2 cells, compared to MALAT1 [red], which show predominant nuclear expression. Nuclei are stained with Hoechst [blue]; magnification ×63 oil; scale bar 10 µm. Results of a t-test or Spearman correlation with coefficients [r] are shown. All two-sided: *p < 0.05, **p < 0.01, ***p < 0.001, ****p < 0.0001.
Figure 3.
Figure 3.
GATA6-AS1 regulates epithelial mitochondrial genes and function. [A] Schematic representation of GATA6-AS1 interactome pull-down experiments by two independent pools of tiling antisense biotinylated oligos. Binding of GATA6-AS1 RNA was confirmed by PCR. [B, C] The GATA6-AS1 interactome in differentiated Caco-2 cells identified 285 proteins using mass spectrometry [t-test: delta LFQ ≥ 0.1 and FDR ≤ 0.05; Supplementary Dataset S2]. [B] Heatmap of GATA6-AS1 top curated interacting targets identified by mass spectrometry; green and red colours indicate low and high binding respectively; Ctl columns are binding to non-specific control oligos. [C] Functional enrichments of the 285 protein targets indicated enrichment of mitochondrial functions [ToppGene/ToppCluster58]. [D] GATA6-AS1 silencing [sh1, sh2] was compared to scrambled non-specific shRNA [Ctl] using qRT-PCR [normalized to GAPDH and to controls]. [E] JC1 staining and FACS analysis were used to define the mitochondrial membrane potential [MMP]; schematic representation of MMP calculated as the ratio of red/green fluorescence. The analysis was performed in the absence or presence of 50 µM CCCP [carbonyl cyanide 3 chlorophenylhydrazone], which reduces MMP. Representative FACS images are presented, and the summarized experiments [n = 3] are shown as a bar-graph. [F] Representative western blots using specific antibodies in GATA6-AS1 knockdown cells indicated reduction of DECR1, MT-CO2 and GATA6, with induction of TGM2 and EPHX proteins. GAPDH was used as a loading control [three to four independent experiments are shown in Supplementary Figure S3]. [G, H] Mitochondrial ROS levels and apoptosis were measured using MitoSOX [G] and annexin V [H] in GATA6-AS1 knockdown cells at baseline or after treatment with 500 µM H2O2 for 3 h. All two-sided paired t-tests: *p < 0.05, **p < 0.01, ***p < 0.001, ****p < 0.0001. Schemes were created with biorender.com.
Figure 4.
Figure 4.
GATA6-AS1 regulates cellular metabolism. [A–C] Untargeted metabolomics was used to capture cellular metabolites and metabolites secreted to the media in GATA6-AS1 knockdown and control cells, untreated or treated with 100 µM DFO + 100 ng/ml LPS + 40 ng/ml IFNγ. [A] Schematic representation of the experiment and PCoA plot of the extracted metabolites based on Canberra distance, indicating differences by both GATA6-AS1 expression and by treatment. [B] Heatmap representing significantly different metabolites in cells [left heatmap] and their media [right heatmap, rank-mean test and FDR < 0.1] between GATA6-AS1 knockdown [sh1 and sh2] and control cells, with visualization of the metabolites in both treated and untreated cells [full comparisons in Supplementary Dataset S3]. Blue and red arrows indicate metabolites that were lower or higher in cells and/or media respectively. [C] Heatmap of the –log10[FDR] enriched pathways obtained from metabolites increased [left two columns] or decreased in the media and cells [right two columns]. The pathways in the upper panel are increased and those in the lower panel are decreased in GATA6-AS1 silencing. [D] Peak area of specific faecal metabolites that differed in GATA6-AS1 knockdown vs controls and between CD and controls. Each case submitted two faecal samples at least 2 months apart and those are shown separately for each control and CD subject. Mann–Whitney test with *p < 0.05 and **p < 0.01.
Figure 5.
Figure 5.
GATA6-AS1 silencing induces TGM2 expression and inhibits mitochondrial respiration while TGM2 co-silencing recovered mitochondrial respiration. [A] Schematic representation of the mitochondrial electron transport chain [I, II, III, IV] and ATP synthase [complex V], with the modulators included in the Seahorse XF Cell Mito Stress Test. [B, C] Mito Stress Test measurement of oxygen consumption rate [OCR] in basal conditions and after sequential injections of oligomycin, FCCP and rotenone/antimycin A [B] in GATA6-AS1 knockdown and control Caco-2 cells without [left] and with [right] 100 µM DFO + 100 ng/ml LPS + 40 ng/ml IFNγ; changes in basal respiration, ATP production and maximal respiration were calculated [C]. [D] OCR [as in Figure 4B and C] in GATA6-AS1 knockdown and control cells transiently transfected with TGM2 or control siRNA to test whether reduction of TGM2 can rescue the GATA6-AS1 knockdown effect of cellular respiration. Changes in basal respiration, ATP production and maximal respiration. [E] Extracellular acidification rate [ECAR] was measured [see also Supplementary Figure S4]; non-glycolytic acidification was calculated and found to differ between GATA6-AS1 knockdown and control cells, and to be rescued by reduction of TGM2. Individual values are shown in the graph with their mean. All two-sided paired t-tests: *p < 0.05, **p < 0.01, ***p < 0.001. [F] Concluding scheme; GATA6-AS1 is reduced in gut epithelia of UC, CD and coeliac cases, and mitochondrial function is impaired in epithelia of UC and CD patients.,, To model our observations in patients mechanistically, we showed that GATA6-AS1 binds a complex that includes TGM2 [1]. GATA6-AS1 silencing resulted in TGM2 induction, similarly to the induction seen in patients [1]. Reduction of GATA6-AS1 and TGM2 induction caused attenuation of mitochondrial membrane potential [2], higher production of mitochondrial ROS [3], reduction of TCA metabolites [4] and reduced cellular respiration [5]. Schemes were created with biorender.com.

References

    1. Gomez JA, Wapinski OL, Yang YW, et al. . The NeST long ncRNA controls microbial susceptibility and epigenetic activation of the interferon-gamma locus. Cell 2013;152:743–54. - PMC - PubMed
    1. NE II, Heward JA, Roux B, et al. . Long non-coding RNAs and enhancer RNAs regulate the lipopolysaccharide-induced inflammatory response in human monocytes. Nat Commun 2014;5:3979. - PMC - PubMed
    1. Hong SH, Han G, Lee SL, et al. ., Testicular germ cell-specific lncRNA, Teshl, is required for complete expression of Y chromosome genes and a normal offspring sex ratio. Sci Adv 2021;7. - PMC - PubMed
    1. Allou L, Balzano S, Magg A, et al. . Non-coding deletions identify Maenli lncRNA as a limb-specific En1 regulator. Nature 2021;592:93–8. - PubMed
    1. Sirey TM, Roberts K, Haerty W, et al. ., The long non-coding RNA Cerox1 is a post transcriptional regulator of mitochondrial complex I catalytic activity. Elife 2019;8. - PMC - PubMed

Substances